. 2015 Oct 20;6(32):33253-68.
doi: 10.18632/oncotarget.5291.

A common promoter hypomethylation signature in invasive breast, liver and prostate cancer cell lines reveals novel targets involved in cancer invasiveness

Affiliations

A common promoter hypomethylation signature in invasive breast, liver and prostate cancer cell lines reveals novel targets involved in cancer invasiveness

David Cheishvili et al. Oncotarget. .

Abstract

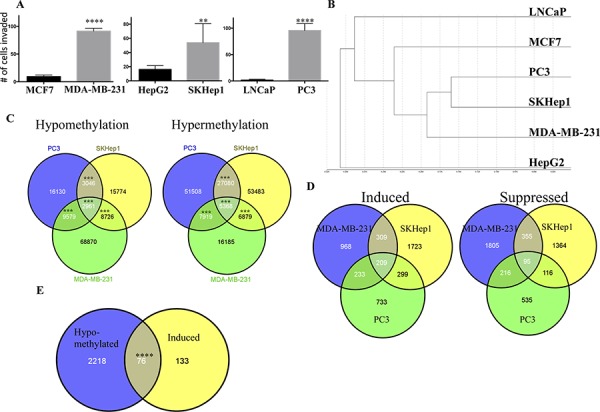
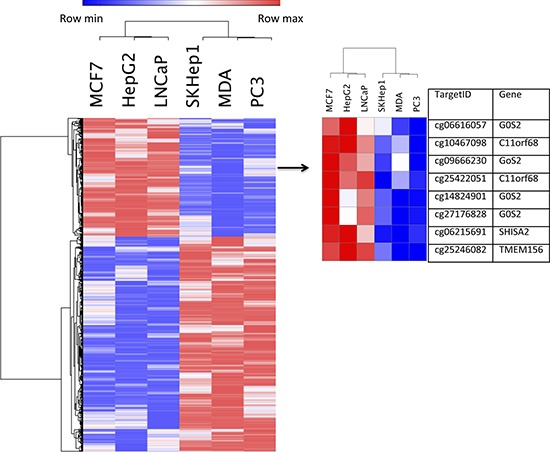
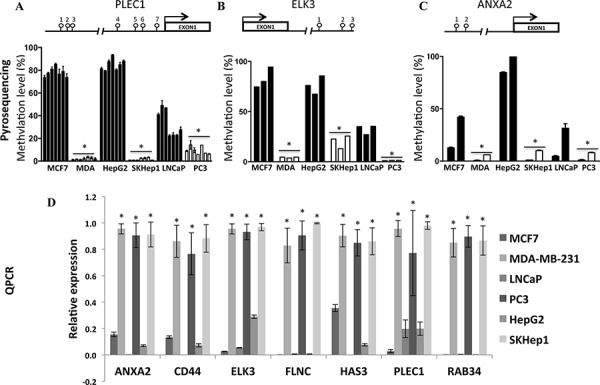
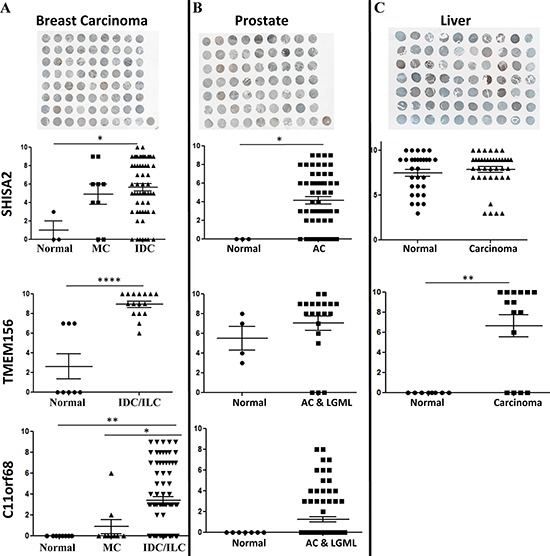
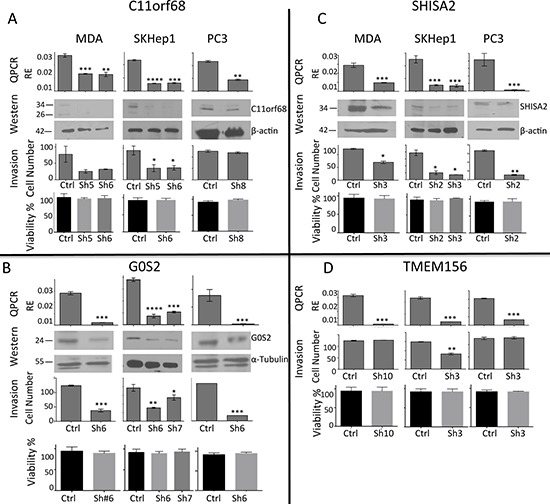
Cancer invasion and metastasis is the most morbid aspect of cancer and is governed by different cellular mechanisms than those driving the deregulated growth of tumors. We addressed here the question of whether a common DNA methylation signature of invasion exists in cancer cells from different origins that differentiates invasive from non-invasive cells. We identified a common DNA methylation signature consisting of hyper- and hypomethylation and determined the overlap of differences in DNA methylation with differences in mRNA expression using expression array analyses. A pathway analysis reveals that the hypomethylation signature includes some of the major pathways that were previously implicated in cancer migration and invasion such as TGF beta and ERBB2 triggered pathways. The relevance of these hypomethylation events in human tumors was validated by identification of the signature in several publicly available databases of human tumor transcriptomes. We shortlisted novel invasion promoting candidates and tested the role of four genes in cellular invasiveness from the list C11orf68, G0S2, SHISA2 and TMEM156 in invasiveness using siRNA depletion. Importantly these genes are upregulated in human cancer specimens as determined by immunostaining of human normal and cancer breast, liver and prostate tissue arrays. Since these genes are activated in cancer they constitute a group of targets for specific pharmacological inhibitors of cancer invasiveness.

Summary: Our study provides evidence that common DNA hypomethylation signature exists between cancer cells derived from different tissues, pointing to a common mechanism of cancer invasiveness in cancer cells from different origins that could serve as drug targets.

Keywords: DNA methylation; drug targets; epigenetics; hypomethylation; invasiveness.


Conflict of interest statement

CONFLICTS OF INTEREST

The authors declare that there are no conflicts of interest.

Figures

Figure 1
Figure 1. The DNA methylation landscape of metastatic cancer cell lines
A. Invasiveness of cancer cell lines. The level of invasiveness of breast liver and prostate cancer cells was determined by a Boyden chamber invasion assay. Statistical significance determined by Student t test (***P < 0.0001; **P < 0.01) B. Hierarchical clustering of non-invasive (LNCaP, MCF7, HepG2) and invasive (PC3, SKHep1, MDA-MB-231) cell lines by their global methylation profiles of more than 450000 CpG sites C. Venn diagram showing overlapping methylation changes of CpG sites between three invasive cancer cell lines. Statistical significance of the overlap is indicated. A significant effect is represented as *** (P < 0.001). D. Venn diagram showing overlapping expression changes between three invasive cancer cell lines. E. Venn diagram showing overlapping hypomethylated and upregulated genes. Statistical significance of the overlap is indicated. A significant effect is represented as **** (P < 0.0001).
Figure 2
Figure 2. Gene methylation heatmap with a standard hierarchical clustering for 5368 differentially methylated in non-invasive (LNCaP, MCF7, HepG2) and invasive (PC3, SKHep1, MDA-MB-231) cancer cell lines (left)
Right heat map represent selected out of left heat map target genes: C11orf68, G0S2, SHISA2 and TMEM156 and associated with them CpGs methylation heatmap (right).
Figure 3
Figure 3. Validation of DNA methylation in PLEC1 A. ELK3 B. and ANXA2 C. and mRNA D. expression differences between invasive and low invasive cancer cell lines
Pyrosequencing of A.) ANXA2 (NM_004039, Annexin A2), B.) ELK3 (NM_005230, ETS domain-containing protein) and C.) PLEC1 (NM_201380, Plectin) 5′UTR regions was performed on DNA extracted from invasive (MDA-MB-231, SKHep1, PC3) and non-invasive (MCF7, HepG2, LNCaP) cell lines. A schematic is shown for each 5′UTR with positions of CGs (lollipop) that were pyro sequenced indicated. Each bar represents the data for the individual CGs by the order presented in the scheme for each gene. Standard error is calculated from three experiments. Statistical significance was determined by Student t test. D.) Expression of ANXA2, CD44, ELK3, FLNC, HAS3, PLEC1 and RAB34 target genes in three non-invasive and three invasive cancer cell lines was determined by qPCR (see Materials and Methods). Experiment was performed at least three times in all three cell lines. Expression level of target genes was normalized to GAPDH rRNA values. Due to differences in the expression levels between the cell lines, the maximal expression level between replicates in invasive cells was matched to 1. The calculated ratios of invasive to non-invasive in all three type of cell lines were highly reproducible (see error bars).
Figure 4
Figure 4. Expression and Pyrosequencing of C11orf68 A. TMEM156 B. SHISA2 C. and G0S2 D. and target genes in invasive and non-invasive cell lines was determined by QPCR and Pyrosequencing respectively (see Materials and Methods)
Experiments were performed in triplicate in invasive (MDA-MB-231, SKHep1 and PC3) and their non-invasive (MCF7, HepG2 and LNCaP) counterpart cell lines. Expression levels of target genes were normalized to GAPDH rRNA values. A schematic diagram is shown for each of the four genes: C11orf68 (A), TMEM156 (B), SHISA2 (C) and G0S2 (D). Positions of CpGs (lollipop) that were sequenced are indicated. Standard error is calculated from three experiments. The number above lollipop is corresponding to the ID obtained from Illumina 450K for each studied CpG as follows: C11orf68 (1- cg25422051, 2- cg10467098) (A); TMEM156 (cg25246082) (B); SHISA2 (cg06215691) (C), G0S2 (1- cg06616057, 2-cg09666230, 3-cg14824901, 4-cg27176828) (D) The arrows indicate the position of CGs from the Illumina450K array that were validated. The Y axis indicates the percentage methylated cytosines according to each CpG shown on X axis. A significant effect is represented as ****, P < 0.0001; ***, P < 0.001; **, P < 0.01; *, P < 0.05.
Figure 5
Figure 5. Immunohistochemistry analysis of C11orf68, G0S2, SHISA2 and TMEM156 expression in breast A. prostate cancer B. and liver C
Tissue specimens obtained from US Biomax Inc. (Rockville, MD) from normal (normal tissues from healthy individuals (N) and/or cancer adjacent normal tissues-NAT); breast medullary (MC), invasive ductal (IDC) and lobular (ILC) carcinomas; liver hepatocellular carcinoma (HC); prostate adenocarcinoma (AC), low grade malignant leiomyosarcoma (LGML) were stained with specific antibodies (see Materials and Methods for details). The staining intensity represented on the Y-axis represents the total score, calculated as described in Material and Methods. Example images from Biomax samples collected from each studied tissue: breast, liver and prostate are depicted above the charts. A significant effect is represented as ****, P < 0.0001; ***, P < 0.001; **, P < 0.01; *, P < 0.05.
Figure 6
Figure 6. C11orf68, G0S2, SHISA2 and TMEM156 depletion decreases invasive capacities in vitro without affecting cell viability
Invasive breast (MDA-MB-231), liver (SKHep1) and prostate (PC3) cancer cell lines were stably transfected with different shRNAs targeting C11orf68 A. G0S2 B. SHISA2 C. and TMEM156 D. Expression (designated as “QPCR” and “Western” in A, B, C, D) of the depleted genes, quantified by QPCR and western blot after infection of MDA-MB-231, SKHep1 and PC3 with scrambled shRNA (ShSCR) and shRNAs as listed above directed to each of the tested genes. Quantitative analysis of western blots was performed using Image J software. C11orf68, G0S2, SHISA2 expression levels over b-actin levels are presented (TMEM156 antibody for western blot is not available). Invasion assays (designated as “Invasion” in A, B, C, D) were performed on transfected MDA-MB-231, SKHep1 and PC3 in Boyden Matrigel Invasion chambers for 48 h for PC3 and 24 hours for MDA-MB-231 and SKHep1 as described in ‘Materials and Methods’. Data represent an average ± SD of the mean of an experiment performed in triplicate experiments. Cell invasion was measured by Boyden chamber invasion assay. All results represent mean ± S.D. of three determinations in either two or three independent experiments; ***P < 0.001, **P < 0.01, *P < 0.05. Cell viability of the treated cells that were plated in 24 wells that did not contain a Matrigel-coated membrane.

References

    1. Graff J.R, et al. E-cadherin expression is silenced by DNA hypermethylation in human breast and prostate carcinomas. Cancer Res. 1995;55:5195–9. - PubMed
    1. Herman J.G, et al. Inactivation of the CDKN2/p16/MTS1 gene is frequently associated with aberrant DNA methylation in all common human cancers. Cancer Res. 1995;55:4525–30. - PubMed
    1. Baylin S.B., Jones P.A. A decade of exploring the cancer epigenome - biological and translational implications. Nat Rev Cancer. 2011;11:726–34. - PMC - PubMed
    1. Pakneshan P, et al. Reversal of the hypomethylation status of urokinase (uPA) promoter blocks breast cancer growth and metastasis. J Biol Chem. 2004;279:31735–44. - PubMed
    1. Stefanska B, et al. Definition of the landscape of promoter DNA hypomethylation in liver cancer. Cancer Res. 2011;71:5891–903. - PubMed

Publication types