. 2015 Dec 21;11(47):9055-72.
doi: 10.1039/c5sm01807b.

On scattered waves and lipid domains: detecting membrane rafts with X-rays and neutrons

Affiliations

On scattered waves and lipid domains: detecting membrane rafts with X-rays and neutrons

Drew Marquardt et al. Soft Matter. .

Abstract

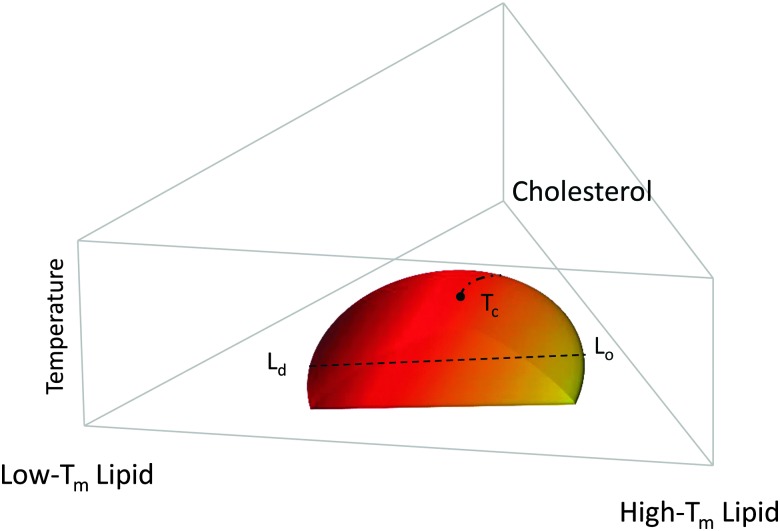
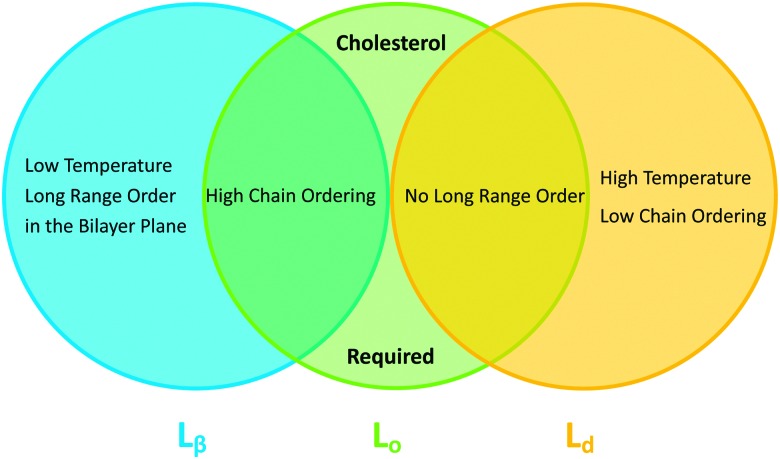
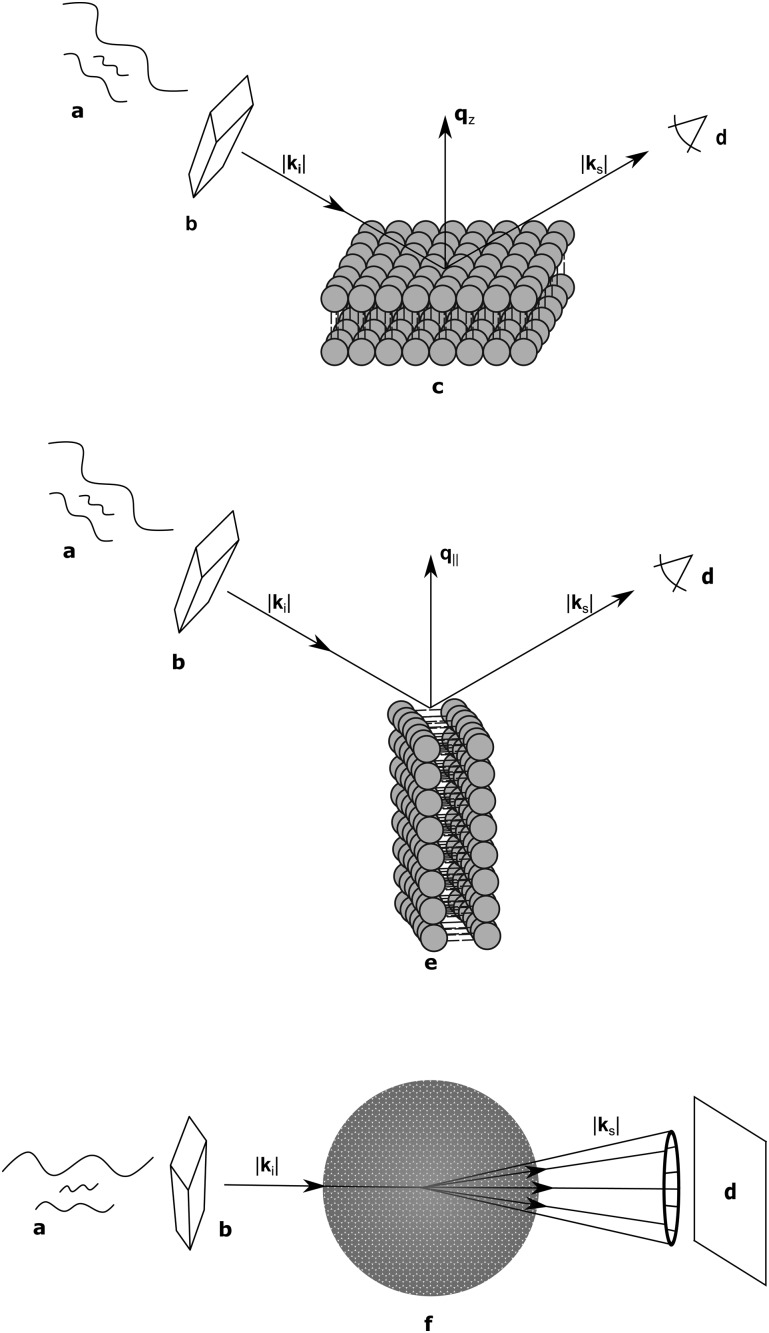
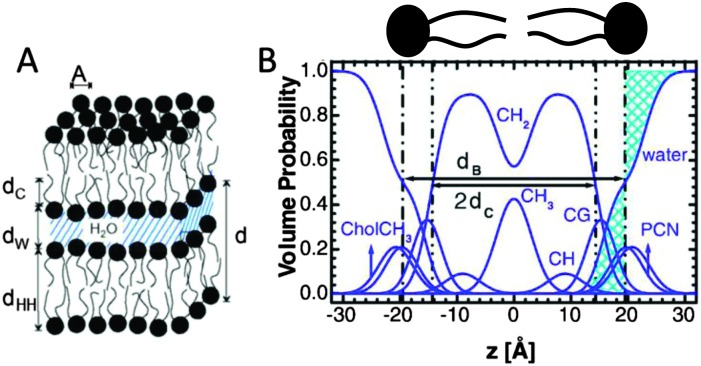
In order to understand the biological role of lipids in cell membranes, it is necessary to determine the mesoscopic structure of well-defined model membrane systems. Neutron and X-ray scattering are non-invasive, probe-free techniques that have been used extensively in such systems to probe length scales ranging from angstroms to microns, and dynamics occurring over picosecond to millisecond time scales. Recent developments in the area of phase separated lipid systems mimicking membrane rafts will be presented, and the underlying concepts of the different scattering techniques used to study them will be discussed in detail.


Figures

Fig. 1
Fig. 1. Generic compositional phase diagram for a ternary lipid mixture focusing on the temperature behavior of the Lo/Ld coexistence regime. The dashed line indicates a tie-line, and the dashed-dotted line describes the critical transitions occurring at T c. T m is the melting temperature. Other phase coexistence regions are not shown for purposes of clarity.
Fig. 2
Fig. 2. Venn diagram of properties shared between the gel (Lβ), liquid disordered (Ld) and liquid ordered (Lo) phases.
Fig. 3
Fig. 3. Schematic diagram of bilayer scattering geometries. Upper, a monochromatic beam with wave vector is selected from a “white” beam of incident neutron or X-ray radiation (a) using a monochromator (b). The angle of the scattered wave vector (where for elastic scattering) is recorded by a detector (d). The sample (c) is oriented such that the scattering vector is perpendicular to the bilayer surface, and therefore probes transverse bilayer structure. Middle, a 90° sample rotation (e) results in a scattering vector that is parallel to the bilayer surface, allowing for interrogation of in-plane structure. Bottom, a vesicle sample (f) results in isotropic scattering, whereby and are probed simultaneously.
Fig. 4
Fig. 4. Description of membrane structure in terms of the SDP model. Panel A shows a schematic of a stack of membranes with the corresponding structural parameters: d – lamellar repeat distance; d B – bilayer thickness; d W – bilayer separation; d C – hydrocarbon chain length; d HH – headgroup-to-headgroup distance; and A – area per lipid. Panel B shows the volume distribution functions of quasimolecular distributions in terms of the SDP model. Figure adapted from ref. 91.
Fig. 5
Fig. 5. Joint analysis of SAXS (inset) and SANS data of POPC MLVs and ULVs. Panel A shows SANS data of POPC (circles) and chain deutrated POPC-d31 (triangles) MLVs. Panel B shows corresponding data for ULVs (same symbols). Figure is adapted from ref. 98.
Fig. 6
Fig. 6. The influence of coherence volumes in detecting membrane domains. Coherence is represented as a 1D interferrogram with a given coherence length L coh (see also eqn (2)). For low wavelength spread and large V coh (top), scattering contributions from the domain and surrounding bilayer add coherently (eqn (22)). In this case, domain size, morphology, and configuration can in principle be determined in a small-angle scattering experiment. For multibilayer samples, Bragg peaks from distinct Lo and Ld lattices are averaged. At high wavelength spread (bottom), V coh < V D, resulting in incoherent addition of domain scattering contributions (eqn (23)), and a superposition of Ld and Lo Bragg peaks in a SAXS experiment, as demonstrated in Section 6.3.
Fig. 7
Fig. 7. Detecting domains with neutron scattering requires optimizing contrast conditions. Neutron scattering length density (NSLD) is depicted as a continuous gradient between dark gray and yellow (left). The upper panel demonstrates a typical SANS experiment performed in 100% D2O solvent, using protiated lipids. In this “high contrast” (HC) scenario, a large NSLD difference exists between solvent and the lipid hydrocarbon region (with a smaller contrast between the lipid headgroup and hydrocarbon chains). As such, lateral segregation of lipids (i.e., phase separation) results in no apparent change in contrast or scattered intensity (upper right). However, by using chain perdeuterated lipids and solvent contrast variation, it is often possible to simultaneously match the SLD of the lipid headgroup, hydrocarbon chains, and water, as shown in the lower panel. In such a “contrast matched” (CM) sample, uniform lipid mixing results in a null scattering condition (lower left), but lateral segregation of chain protiated and chain perdeuterated species generates significant lateral contrast (lower right), and hence an increase in scattering.
Fig. 8
Fig. 8. Optimizing experimental conditions for detecting domains in DSPC/DOPC/Chol. The relative homogeneous background scattering Q hom = Q 0 + Q r, calculated from lipid NSLDs (Table 1) using eqn (24)–(29), is plotted vs. fraction of DSPC-d70 (to total DSPC) and the solvent fraction of D2O. A global contrast match point is observed at 34.6% D2O and 65.9% DSPC-d70 (“CM”, expanded in inset). Close to the contrast match point, Q hom is attenuated by >6 orders of magnitude relative to a fully protiated bilayer in 100% D2O solvent (“HC”).
Fig. 9
Fig. 9. Experimentally measured total scattering reveals domain formation in 4-component lipid mixtures. Shown is the Porod invariant , plotted vs. temperature for DSPC/(DOPC + POPC)/Chol mixtures in a 0.39/0.39/0.22 molar ratio. Colors correspond to different values of the composition parameter ρ = χ DOPC/(χ DOPC + χ POPC) as indicated in the legend. Also shown are two single-phase control samples: DSPC/POPC/Chol 0.325/0.325/0.35 (gray diamond) and POPC/Chol 0.65/0.35 (gray square). Figure adapted from ref. 102.
Fig. 10
Fig. 10. Theoretical scattering curves for multidomain vesicles. For all curves shown, the average bilayer NSLD is identical. Differences in scattered intensity are due to differences in solvent NSLD and/or the lateral NSLD distribution, as indicated by the figure legend and color-coded vesicle images (right), and described in the text.
Fig. 11
Fig. 11. Lo/Ld phase coexistence as detected by SAXS. Like domains exhibit long-range alignment and consequently display two distinct lamellar lattices. Here o's indicate peaks associated with Lo domains and ×'s peaks associated with Ld domains. The inset to the scattering pattern of DSPC/DOPC/Chol in the phase coexistence regime shows the EDP of the two domains resulting from a global fit (red solid line). Figure taken from ref. 122.
Fig. 12
Fig. 12. Parsing scheme of ternary lipid mixtures based on MD simulations of an Lo phase (panel A, DPPC lipids are drawn in blue, DOPC in red, and cholesterol in yellow). Panel B shows the electron density profile calculated from simulations, and panel C the electron densities of individual molecular groups. The left side panel shows the individual contributions of DPPC (solid lines) and DOPC (dashed lines) for the CholCH3, PCN, CG, CH2 and CH3 groups. The contribution of cholesterol is shown as a separate yellow line. The panel on the right shows the condensed parsing scheme after merging individual contributions. Figure taken from ref. 100 with permission.
Fig. 13
Fig. 13. Melting of Lo domains in DOPC/DSPC/Chol. Panel A shows a contour plot of second order Bragg reflections associated with Lo and Ld phases. Above T c, only a single lamellar lattice is observed. Panel B shows Bragg scattering from Lo (dashes) and Ld (crosses) domains at 22 °C. Panel C is the same system at 50 °C. Best fits are shown as solid lines. Inserts to both panels show the resulting ED profiles for Lo and Ld phases. Figure taken from ref. 100 with permission.
Fig. 14
Fig. 14. Real-space snapshots of equilibrium Ld simulations at a given osmotic pressure. Figure taken from ref. 137 with permission.
Fig. 15
Fig. 15. Deconstruction of the total osmotic pressure, P, into contributions of hydration, P hyd, van der Waals, P vdW, and undulation interactions, P und, for coexisting Ld (upper) and Lo (lower) domains. Open black circles show the d W values at which the hydration and undulation pressures are equal. Figure taken from ref. 137 with permission.
Fig. 16
Fig. 16. WAXS scattering from: (A) 1 : 1 DOPC/DPPC; and (B and C) 1 : 1 DOPC/DPPC/Chol (15 mol%), T = 25 °C and 45 °C (T c ≃ 30 °C). The bottom row shows the corresponding I(q) plots with different φ-ranges (φ is the angle measured from the in-plane axis on the detector). Figure taken from ref. 142 with permission.
None
Drew Marquardt
None
Frederick A. Heberle
None
Jonathan D. Nickels
None
Georg Pabst
None
John Katsaras

References

    1. Lingwood D., Simons K. Science. 2010;327:46–50. - PubMed
    1. Kusumi A., Fujiwara T. K., Chadda R., Xie M., Tsunoyama T. A., Kalay Z., Kasai R. S., Suzuki K. G. N. Annu. Rev. Cell Dev. Biol. 2012;28:215–250. - PubMed
    1. Kraft M. L. Mol. Biol. Cell. 2013;24:2765–2768. - PMC - PubMed
    1. Sevcsik E., Brameshuber M., Fölser M., Weghuber J., Honigmann A., Schütz G. J. Nat. Commun. 2015;6:6969. - PMC - PubMed
    1. Feigenson G. W. Biochim. Biophys. Acta. 2009;1788:47–52. - PMC - PubMed

Publication types

MeSH terms

LinkOut - more resources