. 2015 Nov;35(11):2163-80.
doi: 10.1097/IAE.0000000000000765.

IMAGE ARTIFACTS IN OPTICAL COHERENCE TOMOGRAPHY ANGIOGRAPHY

Affiliations

IMAGE ARTIFACTS IN OPTICAL COHERENCE TOMOGRAPHY ANGIOGRAPHY

Richard F Spaide et al. Retina. 2015 Nov.

Abstract

Purpose: To describe image artifacts of optical coherence tomography (OCT) angiography and their underlying causative mechanisms. To establish a common vocabulary for the artifacts observed.

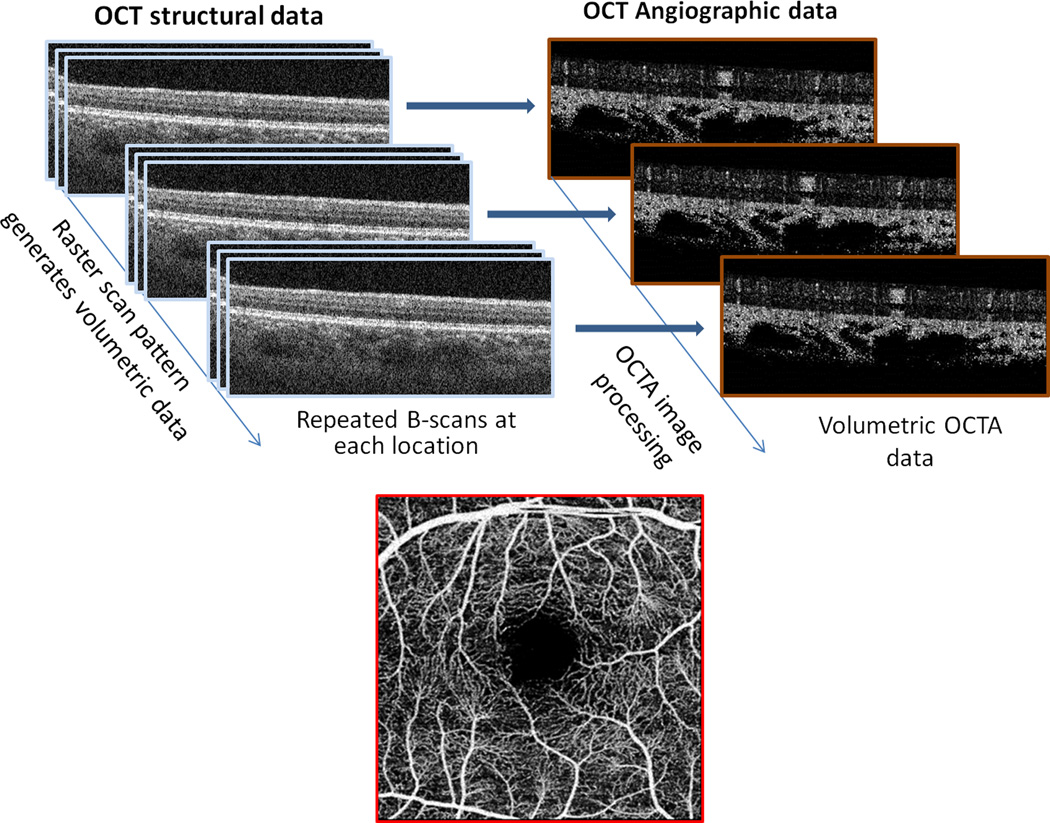
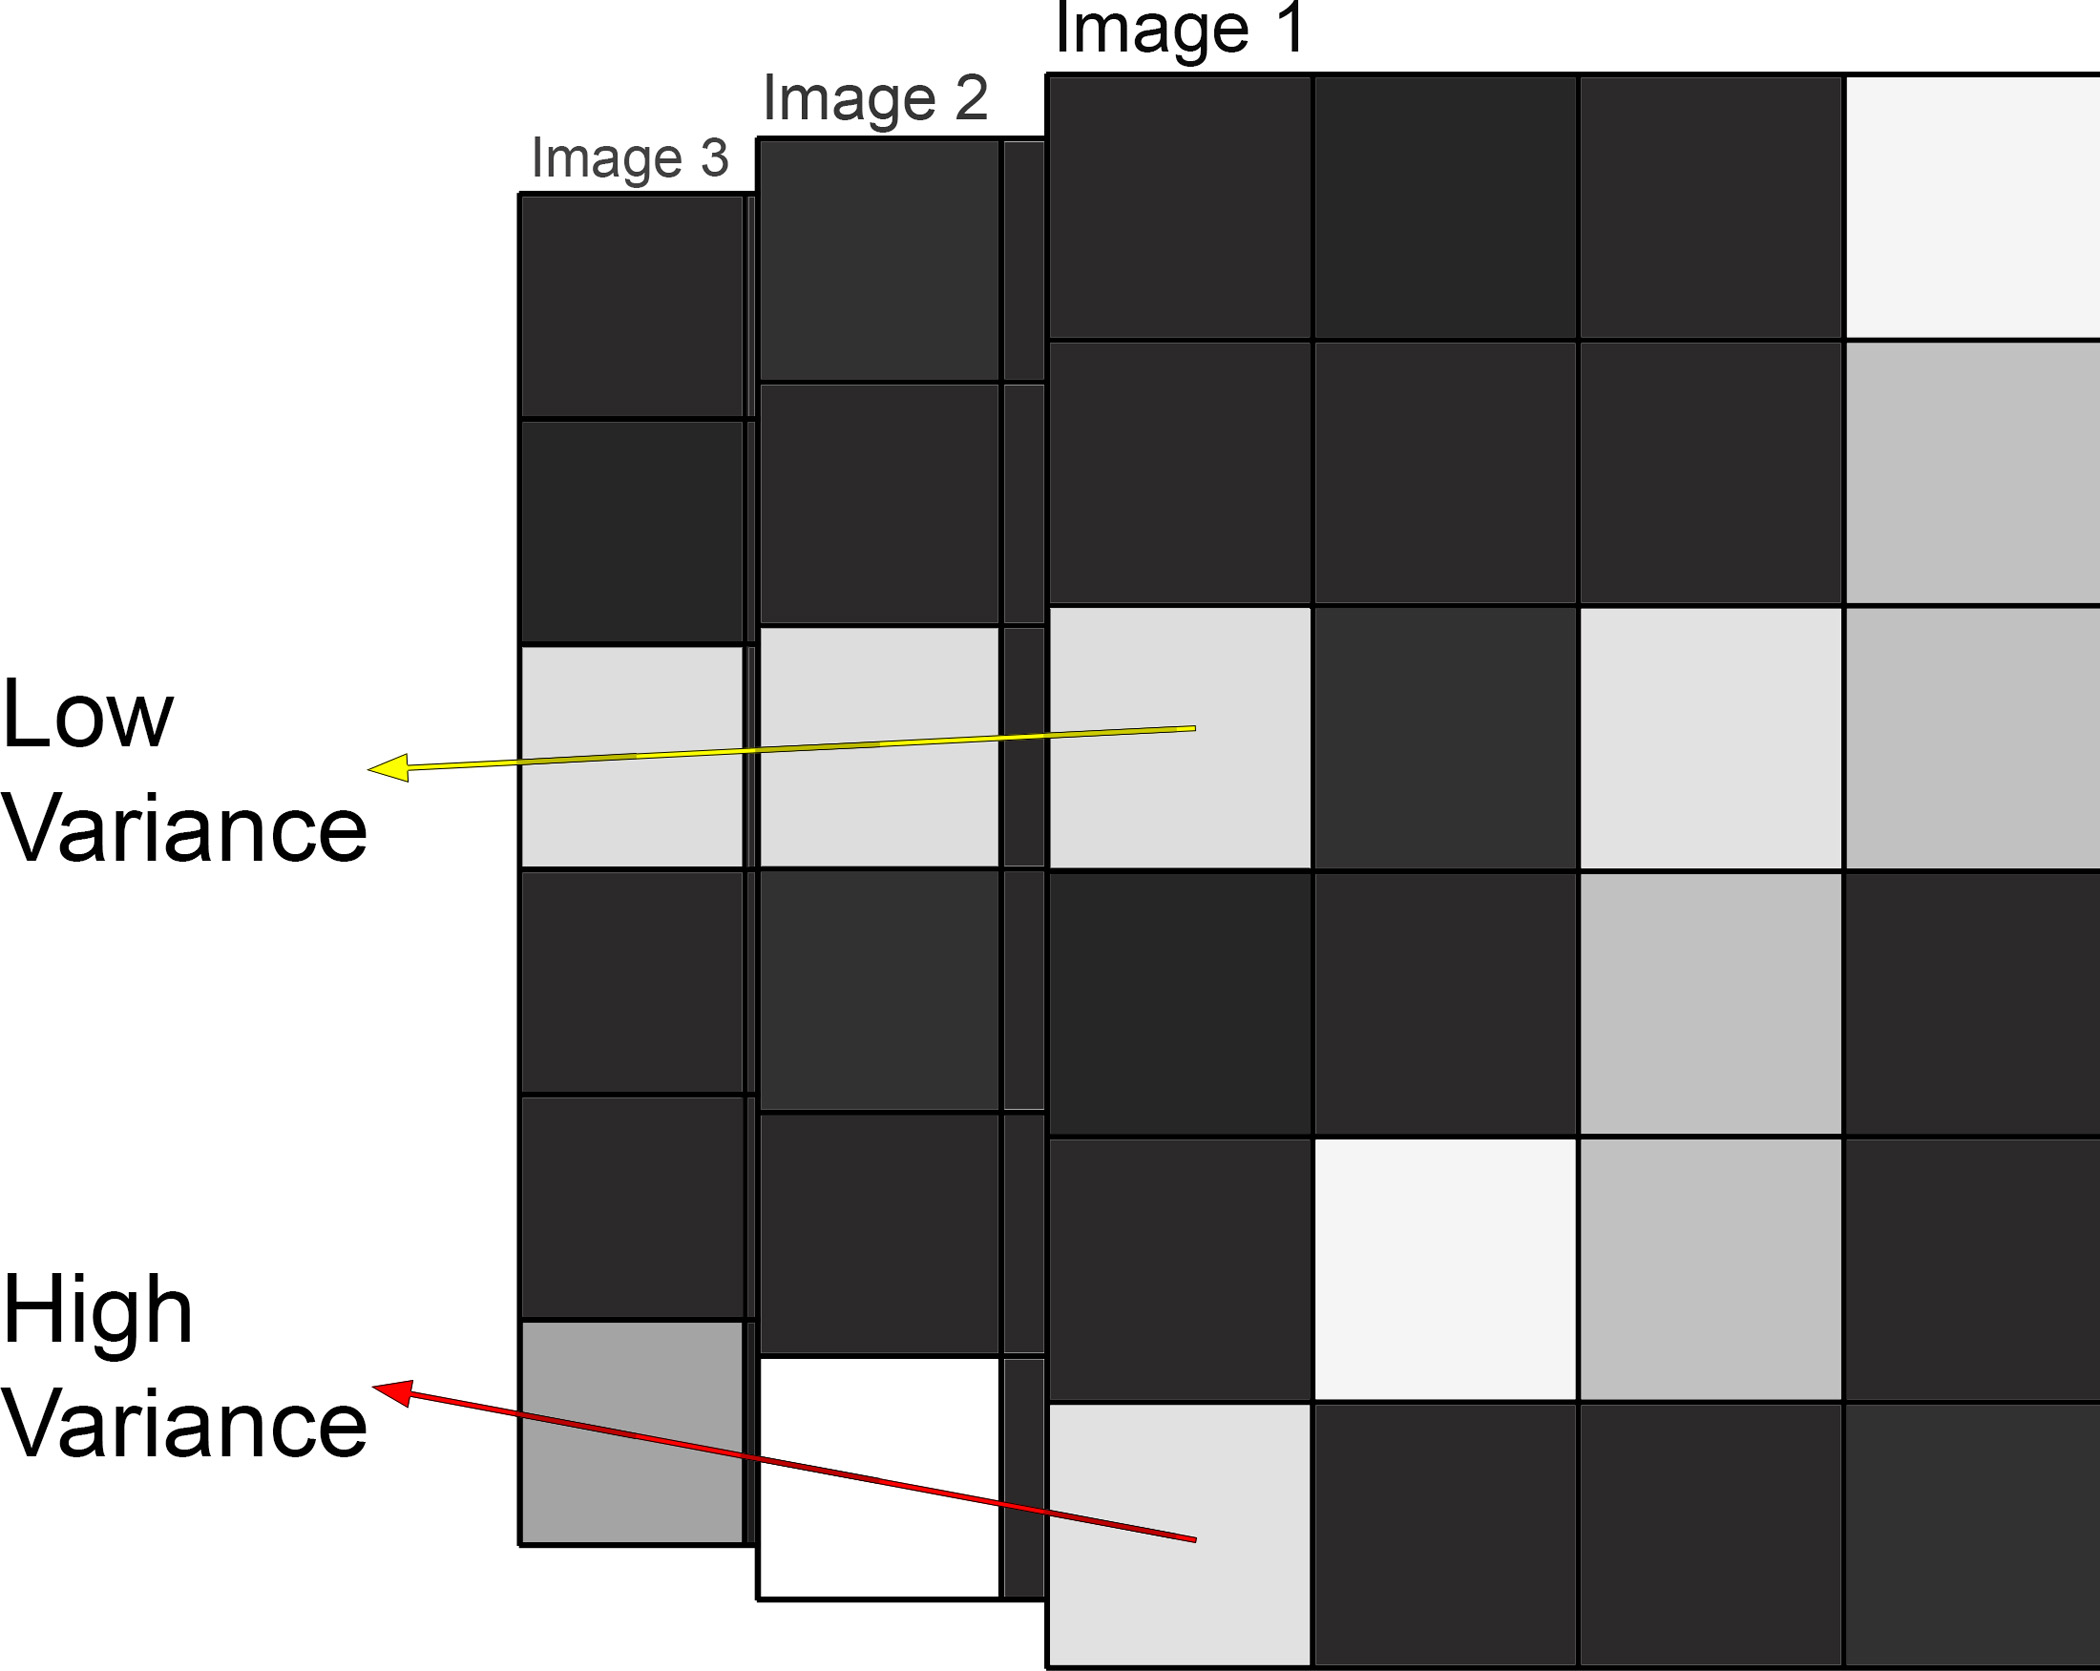
Methods: The methods by which OCT angiography images are acquired, generated, and displayed are reviewed as are the mechanisms by which each or all of these methods can produce extraneous image information. A common set of terminology is proposed and used.

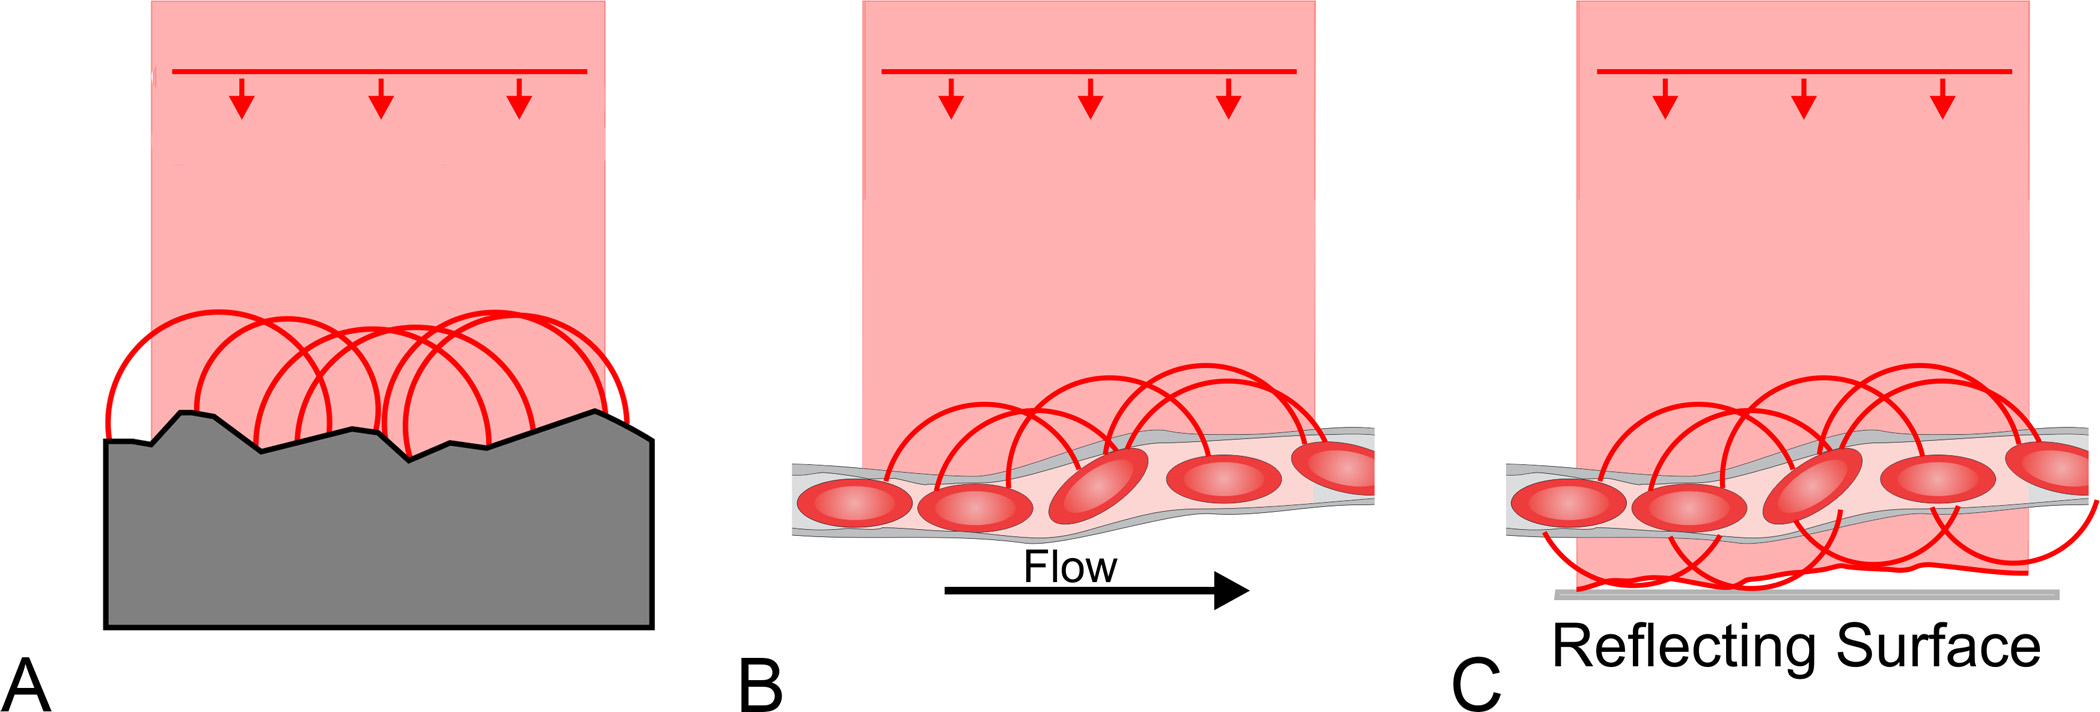
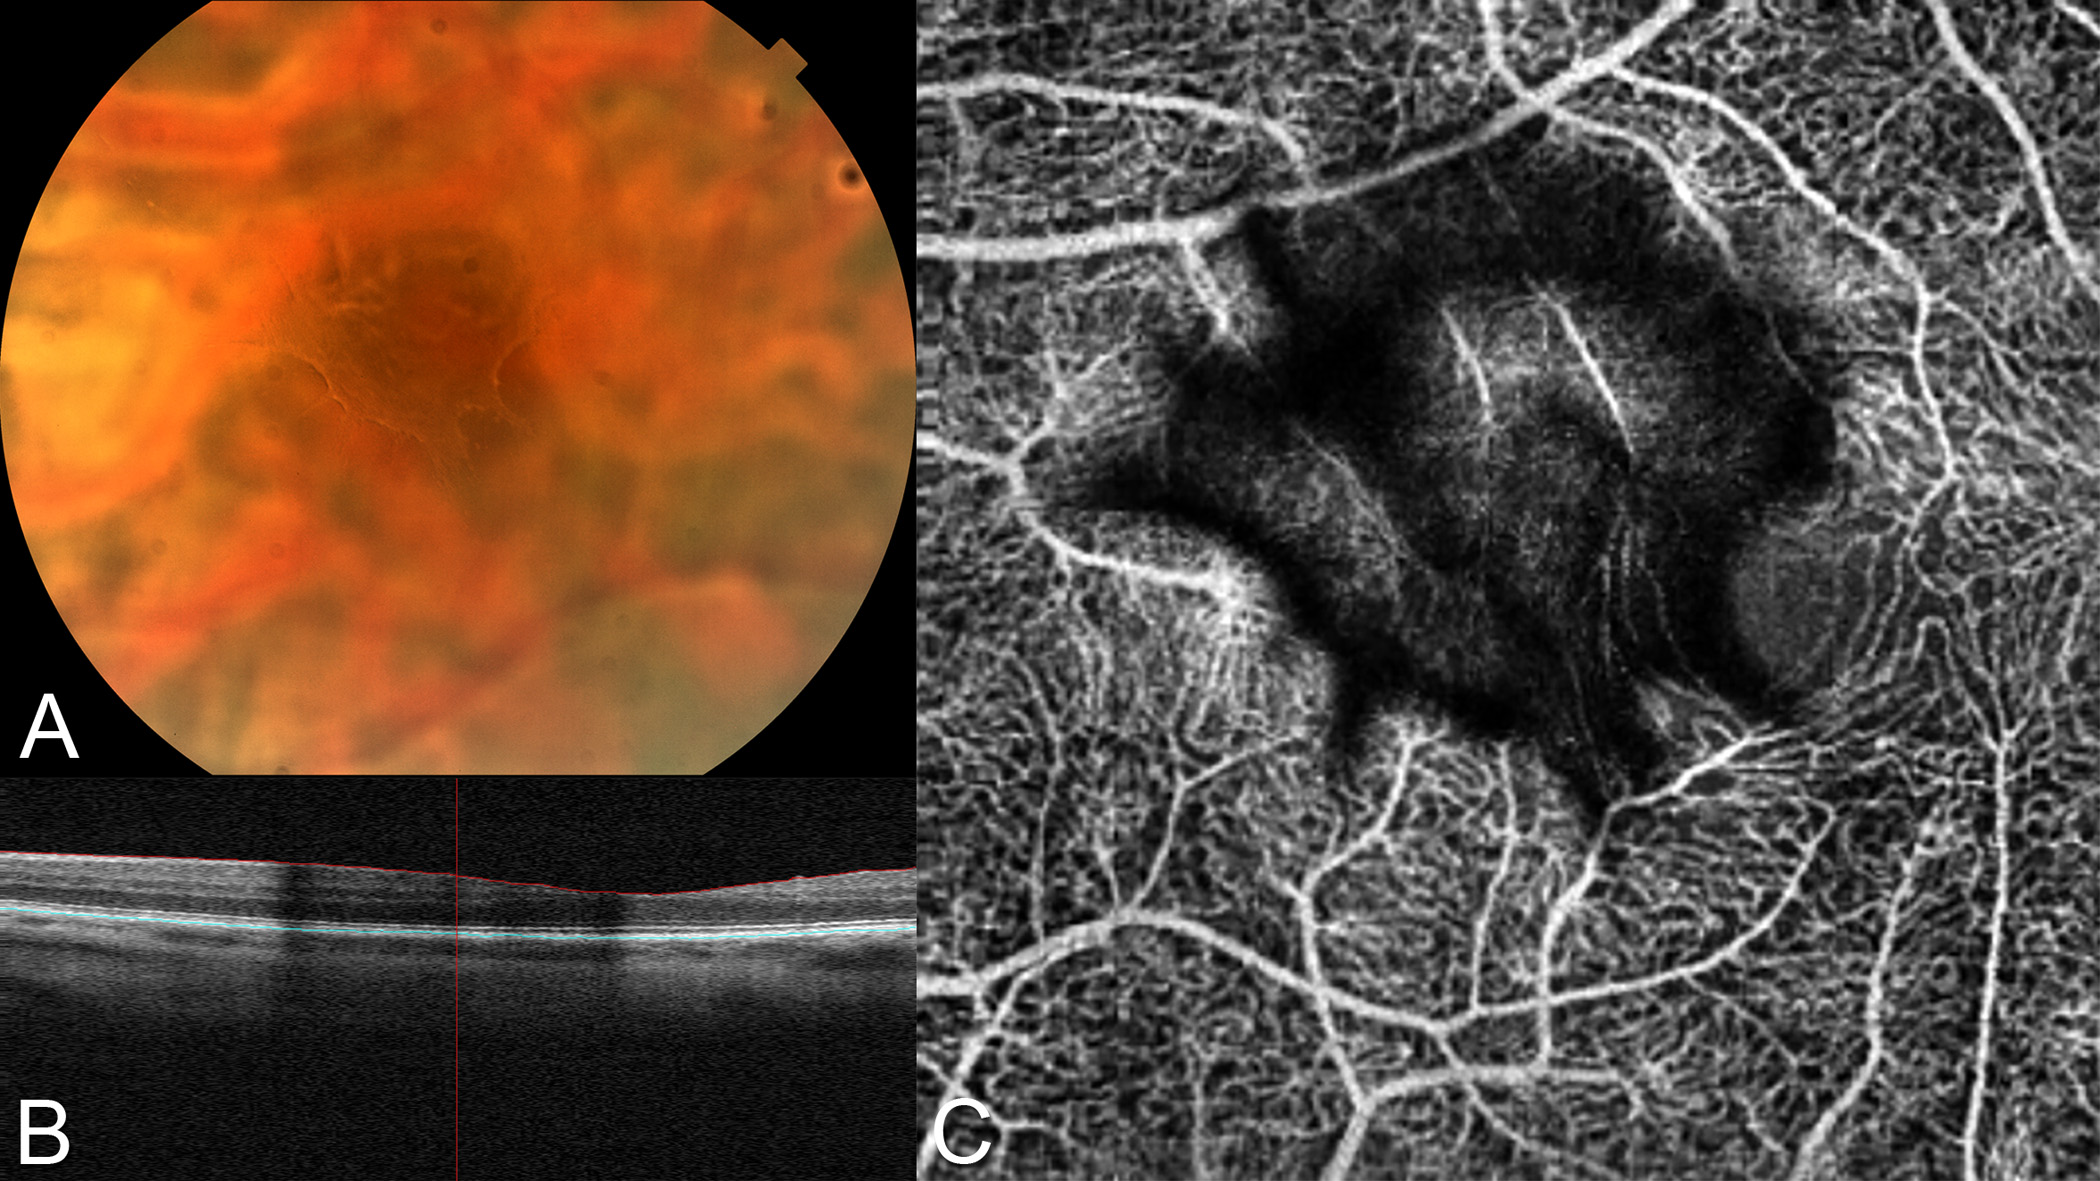
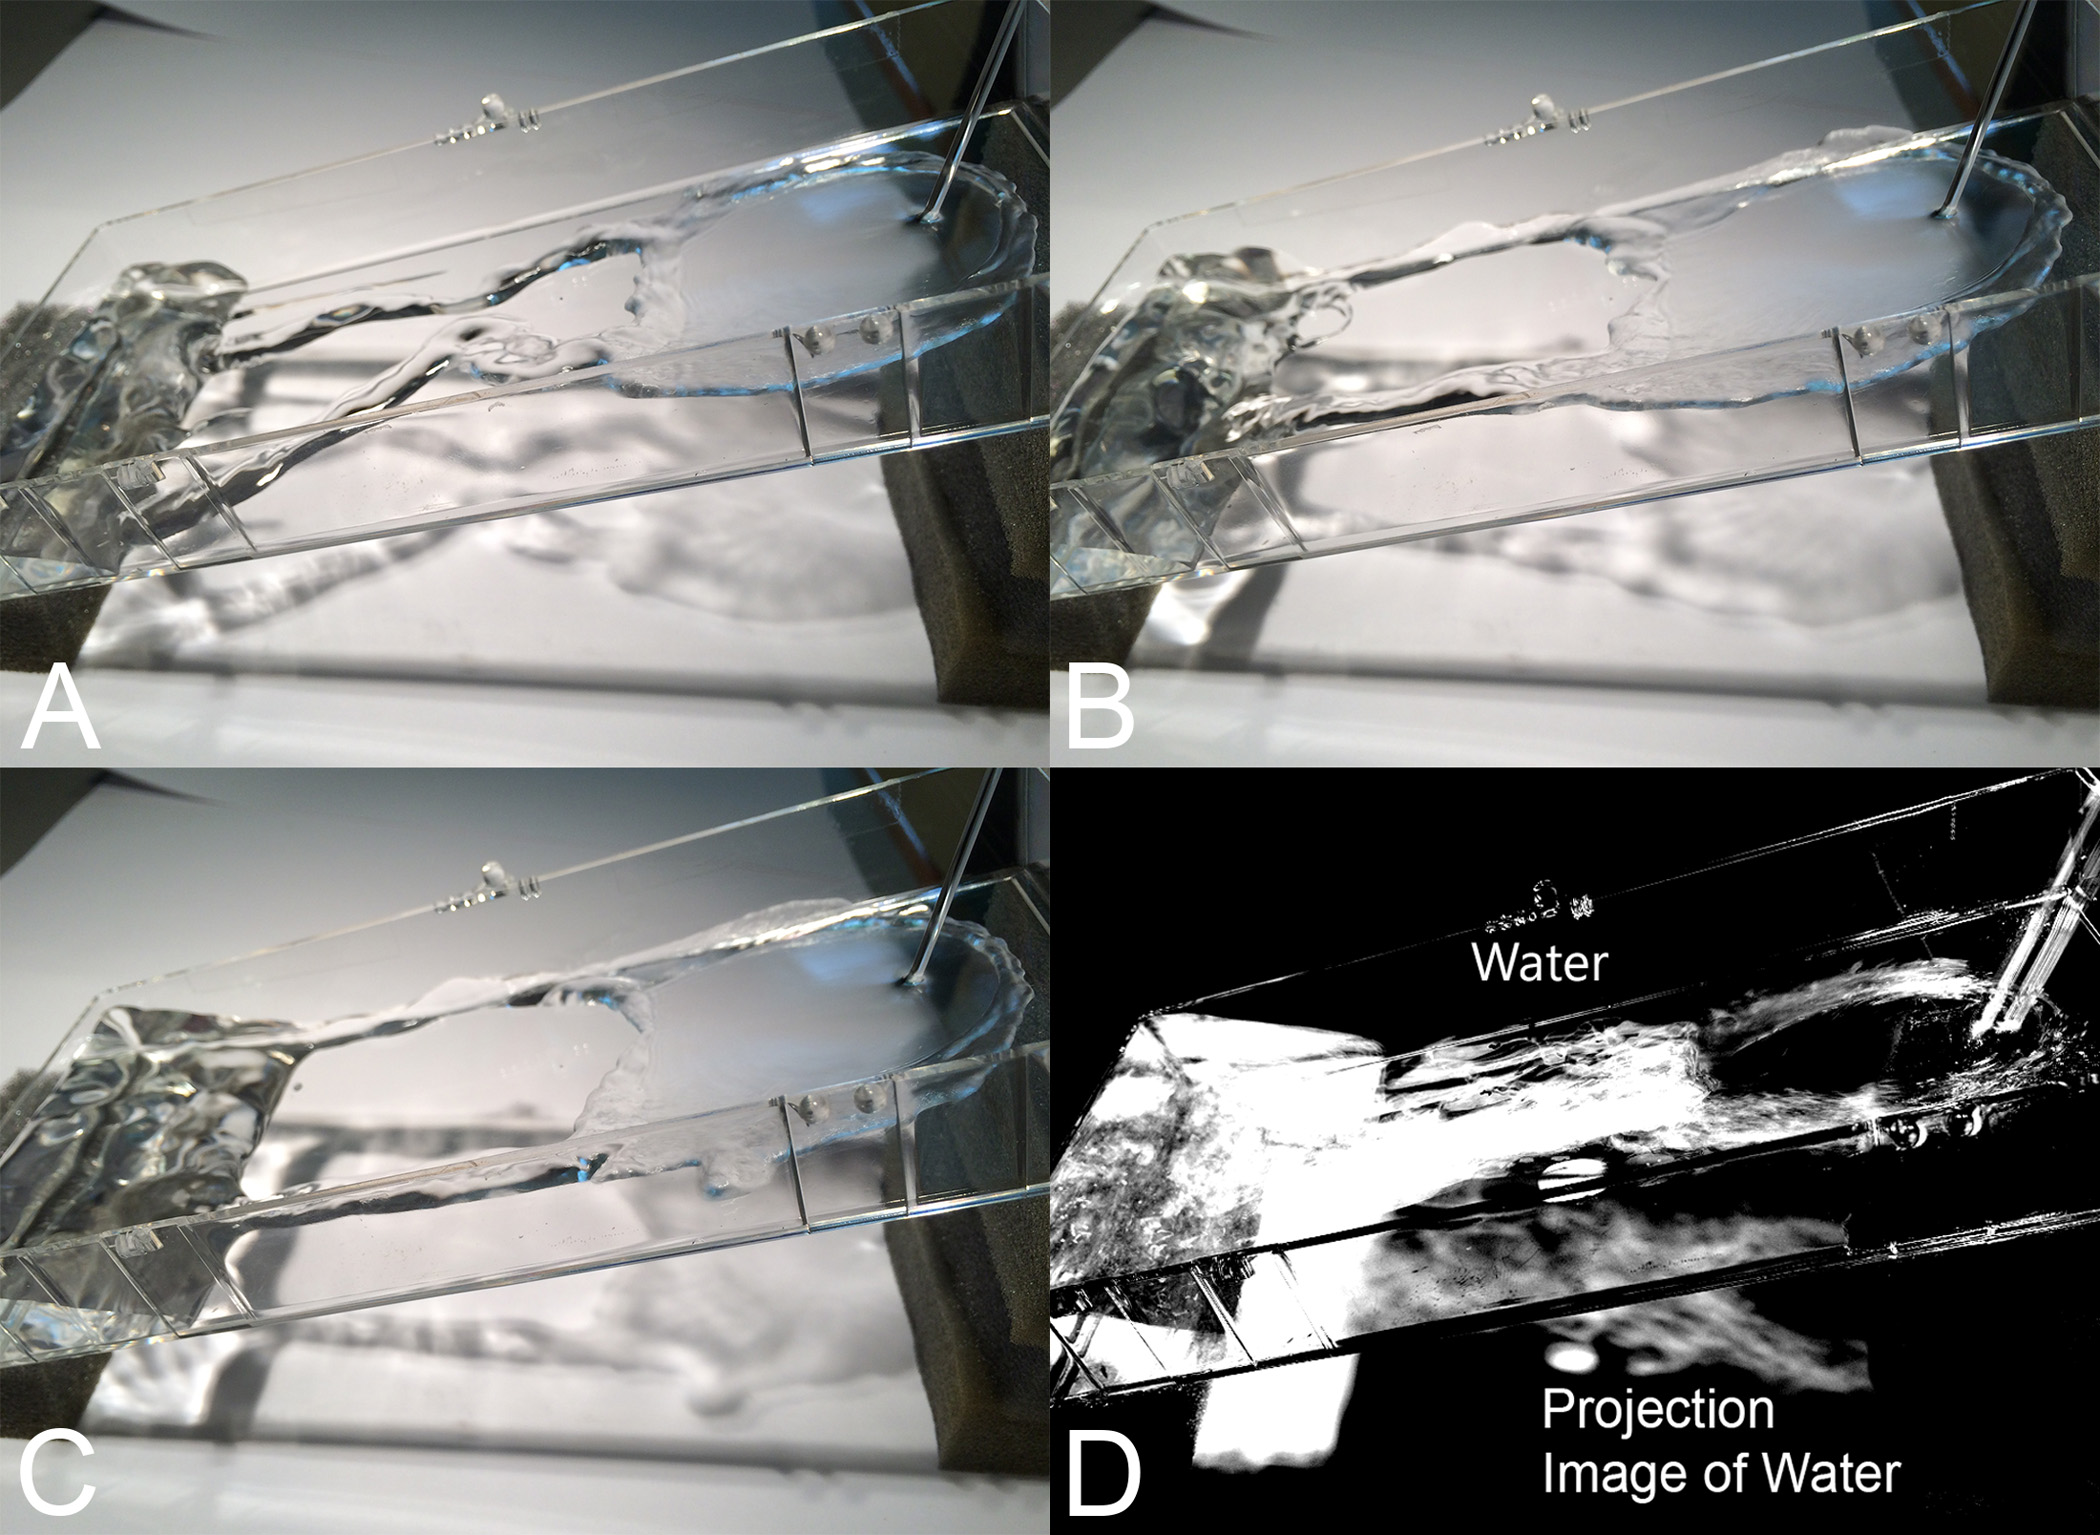
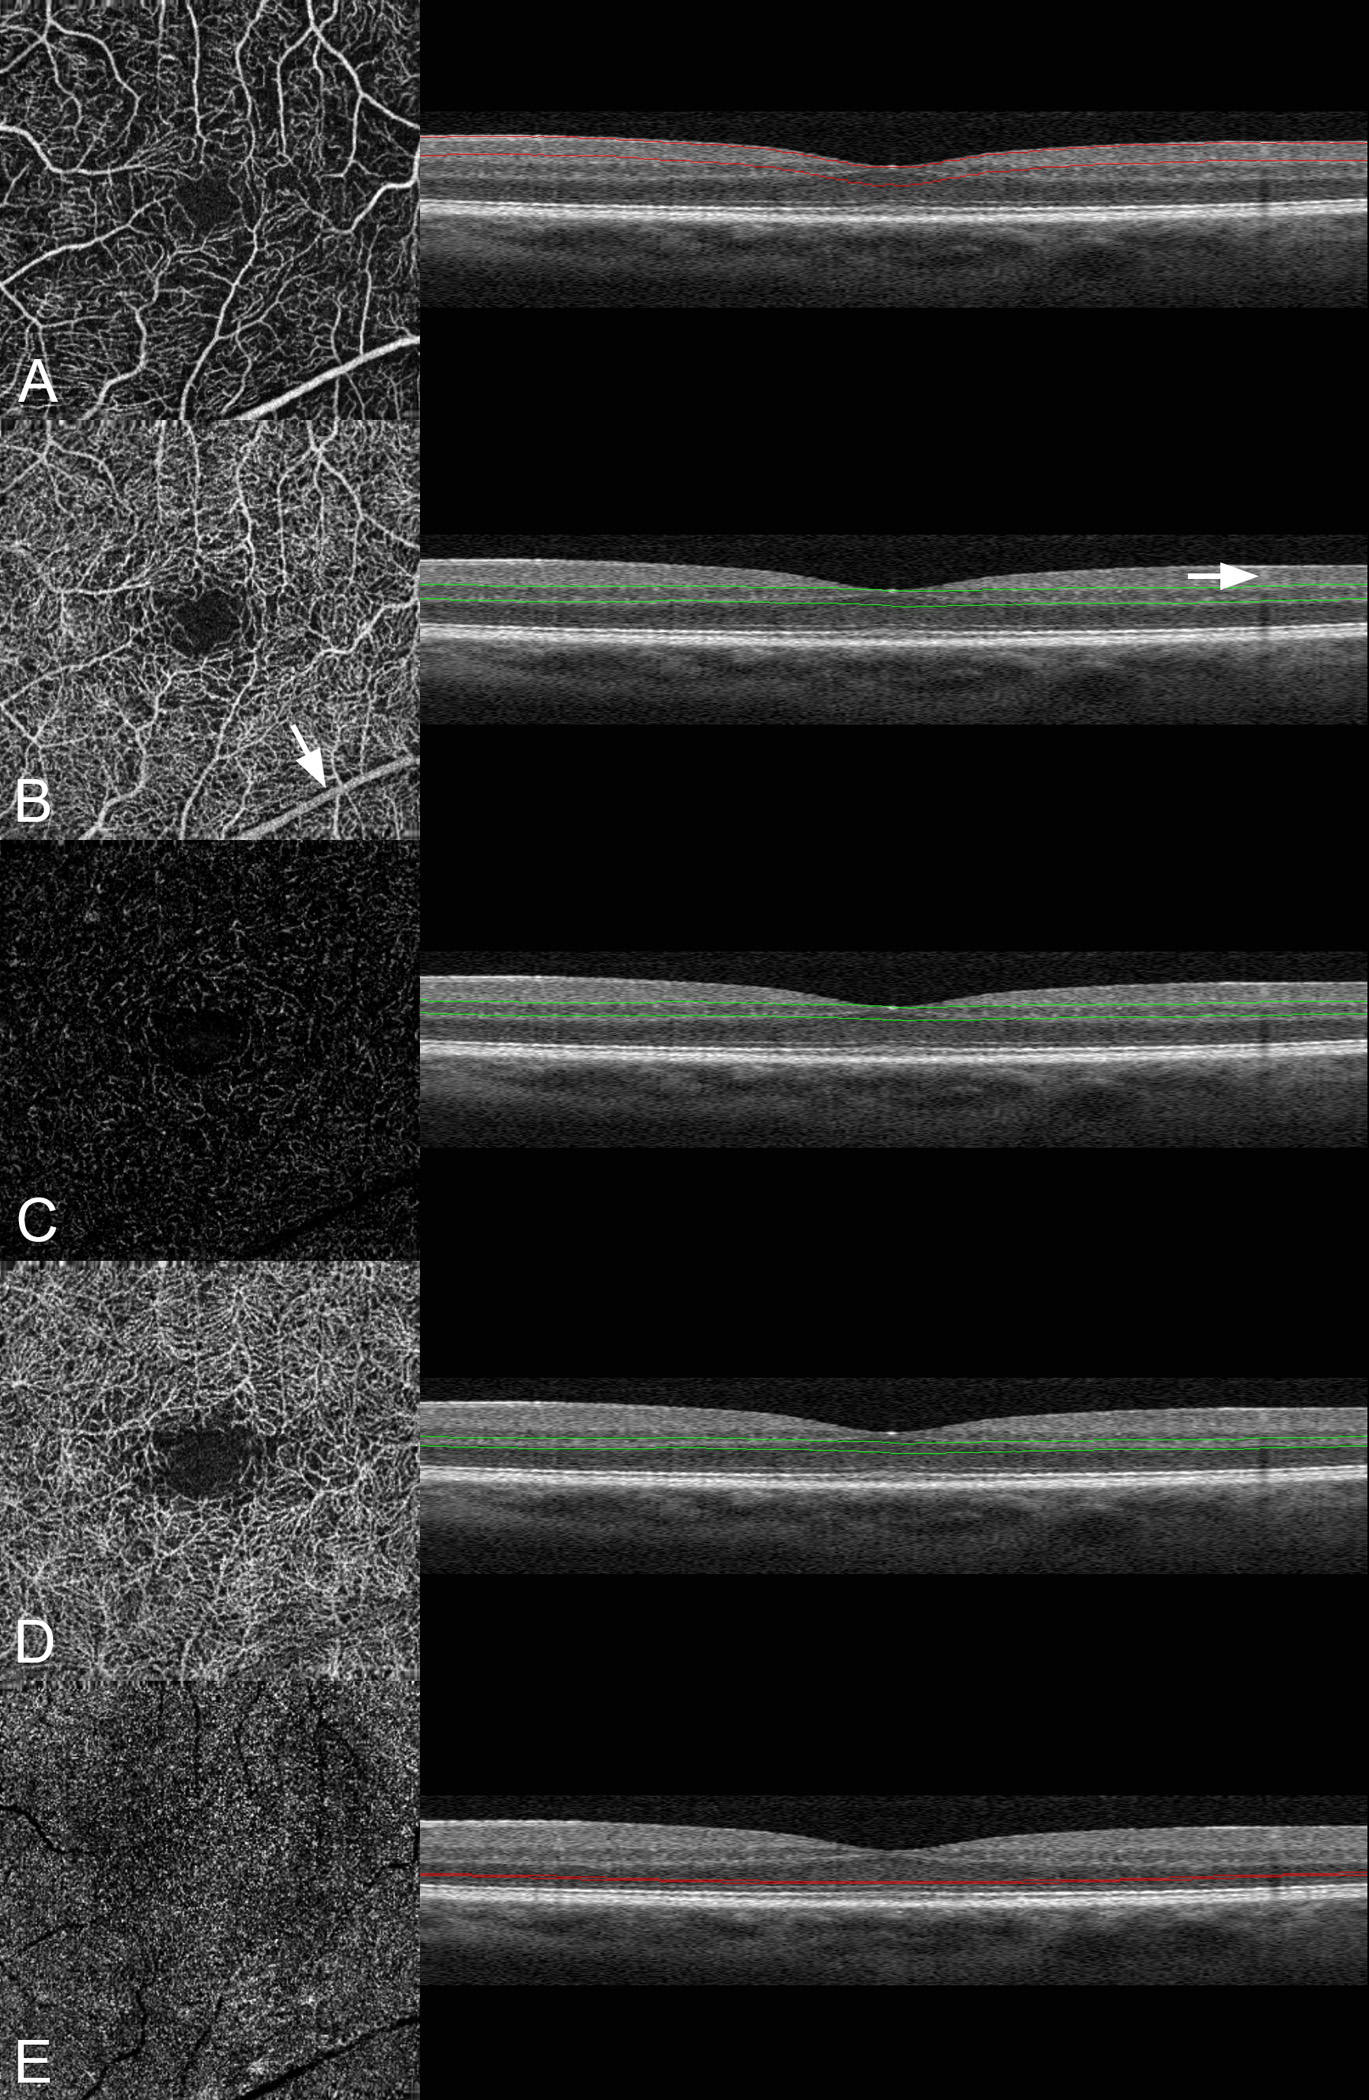
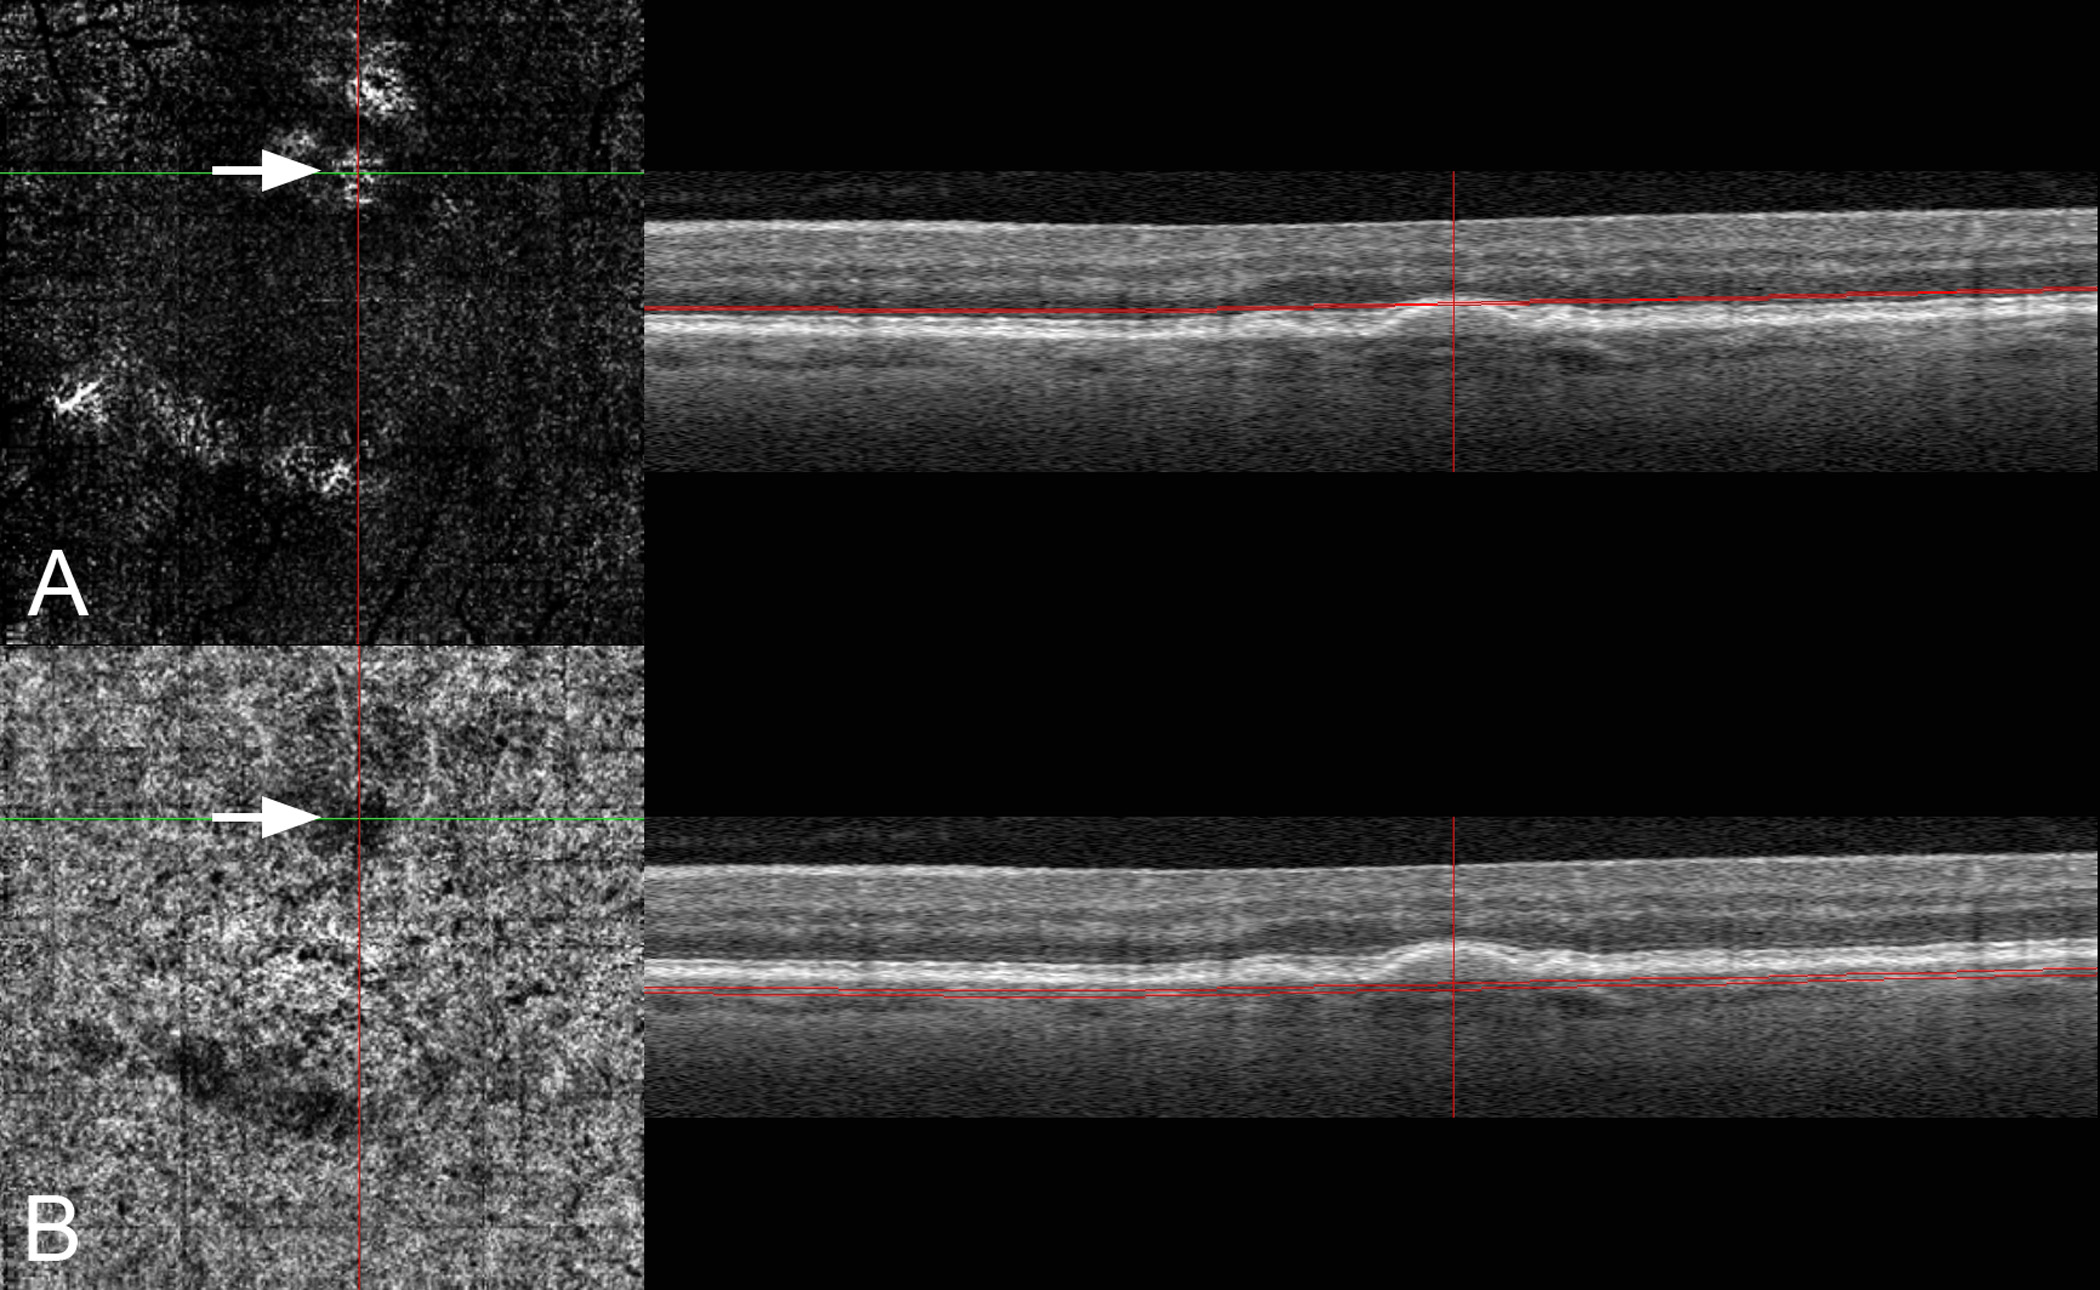
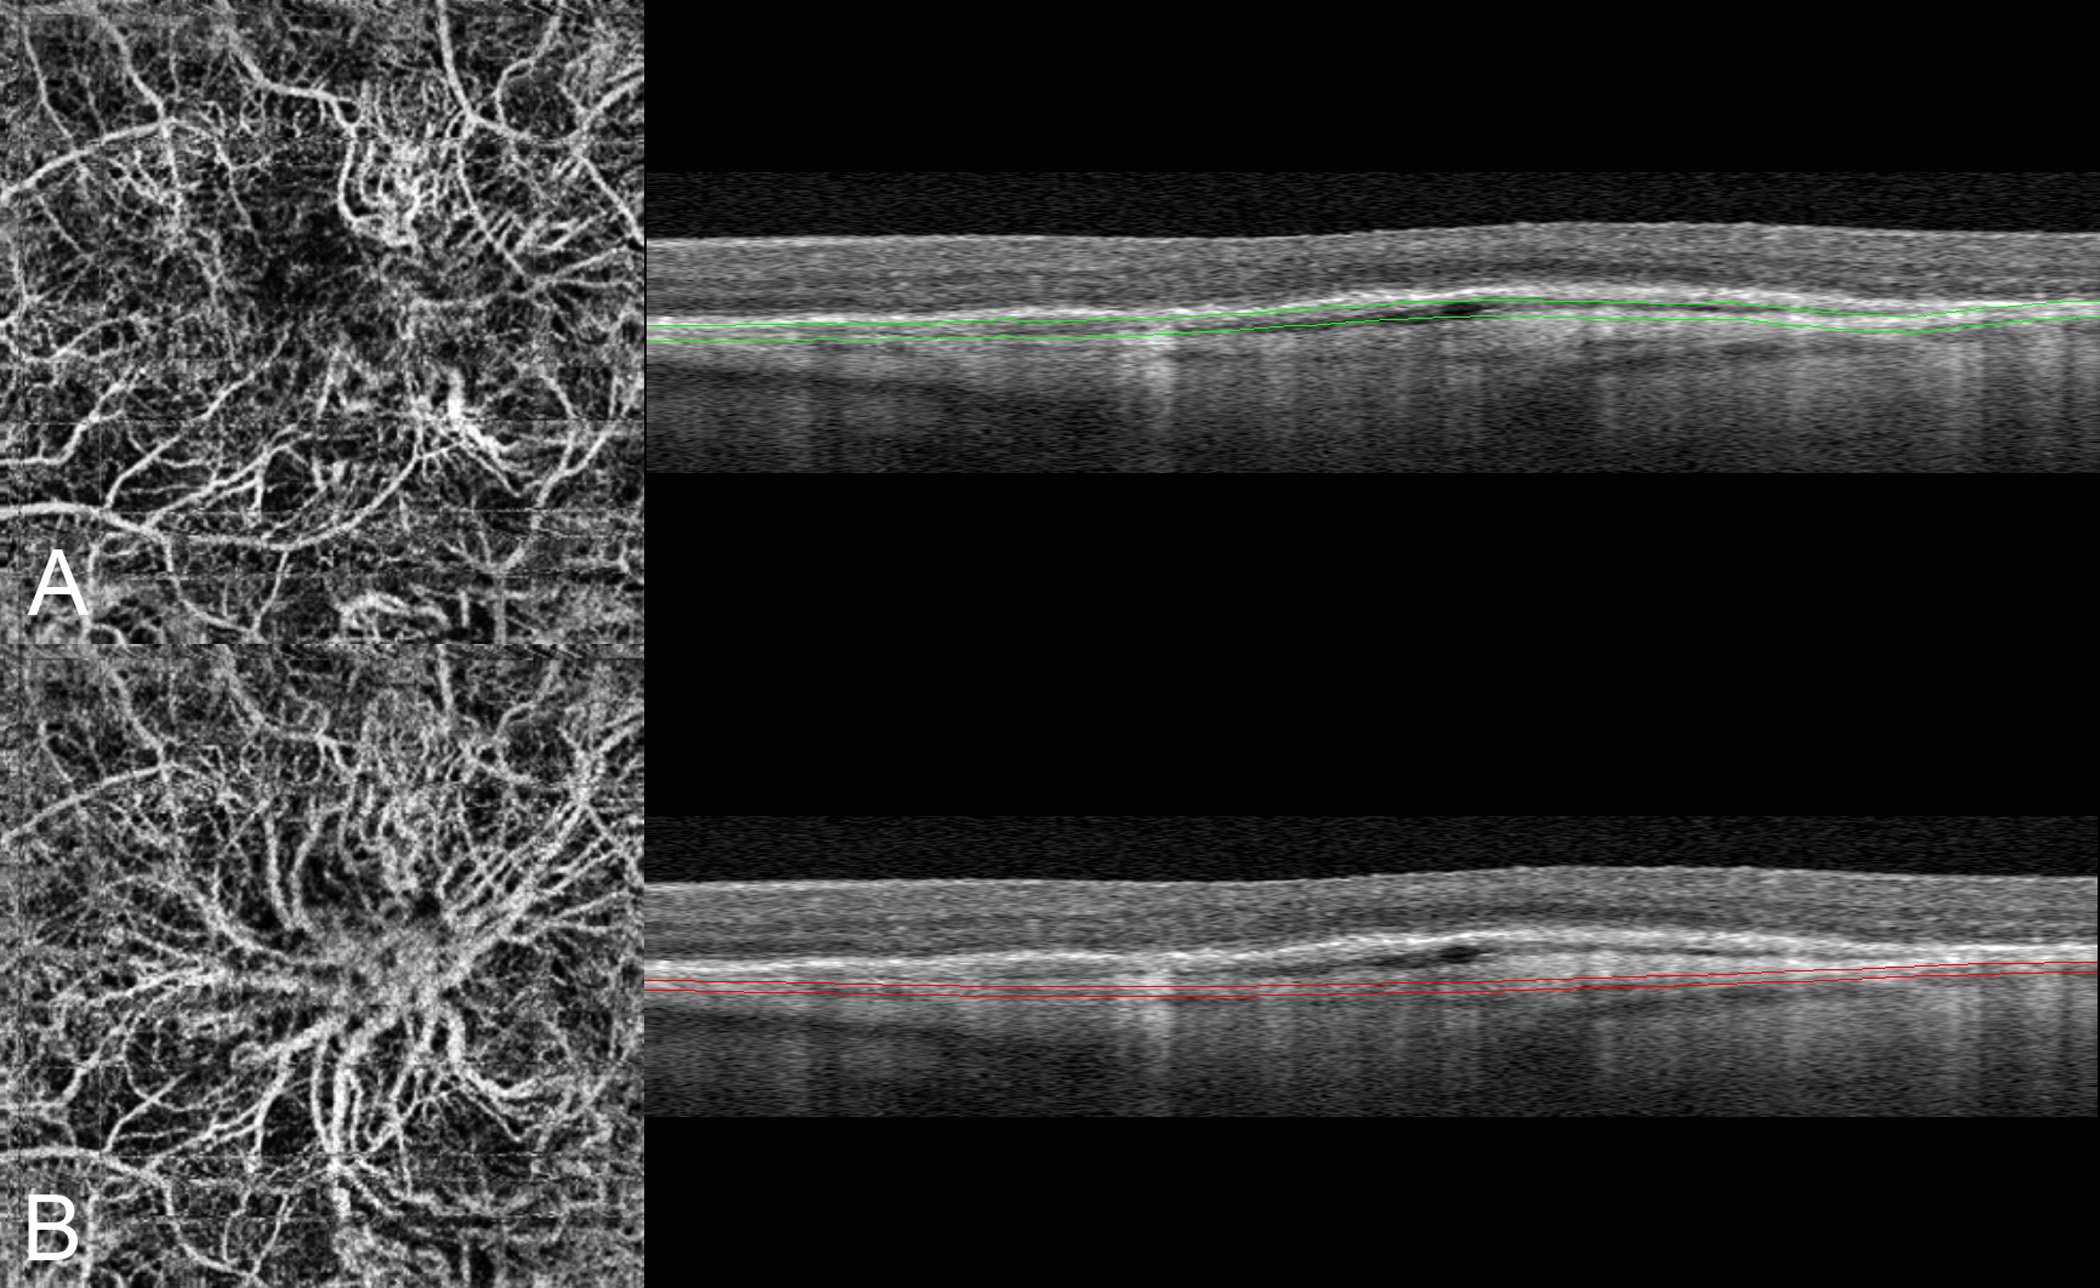
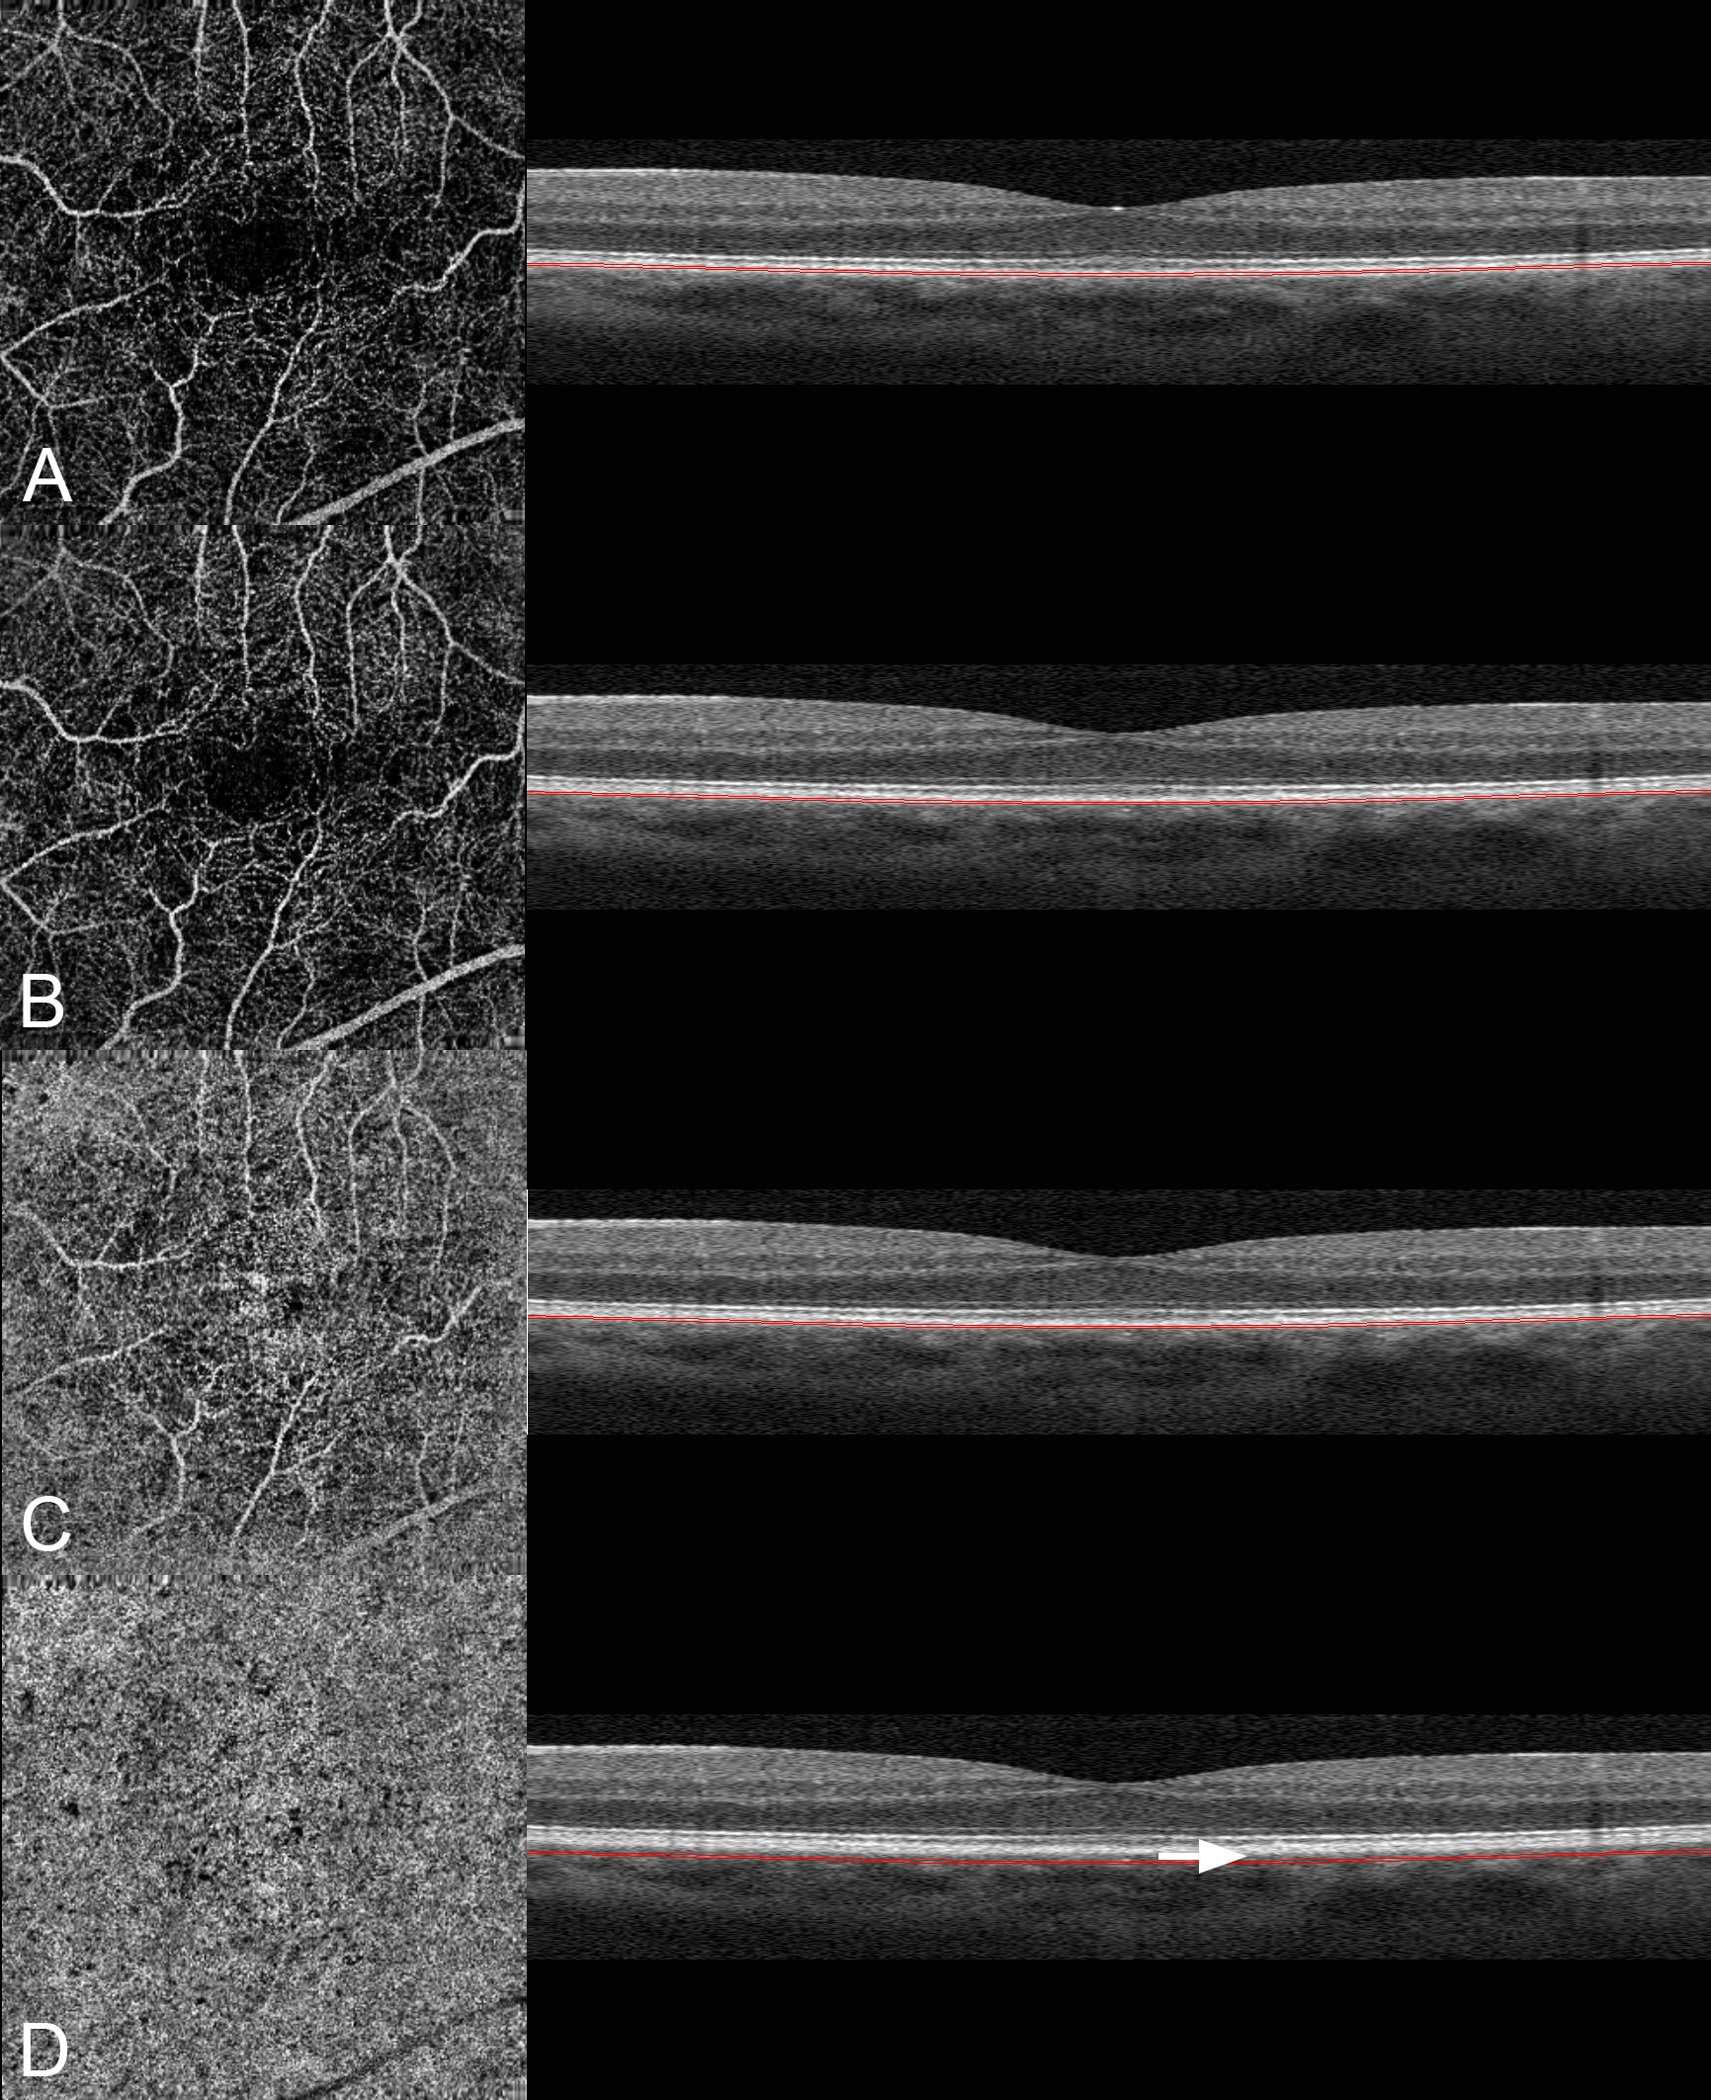
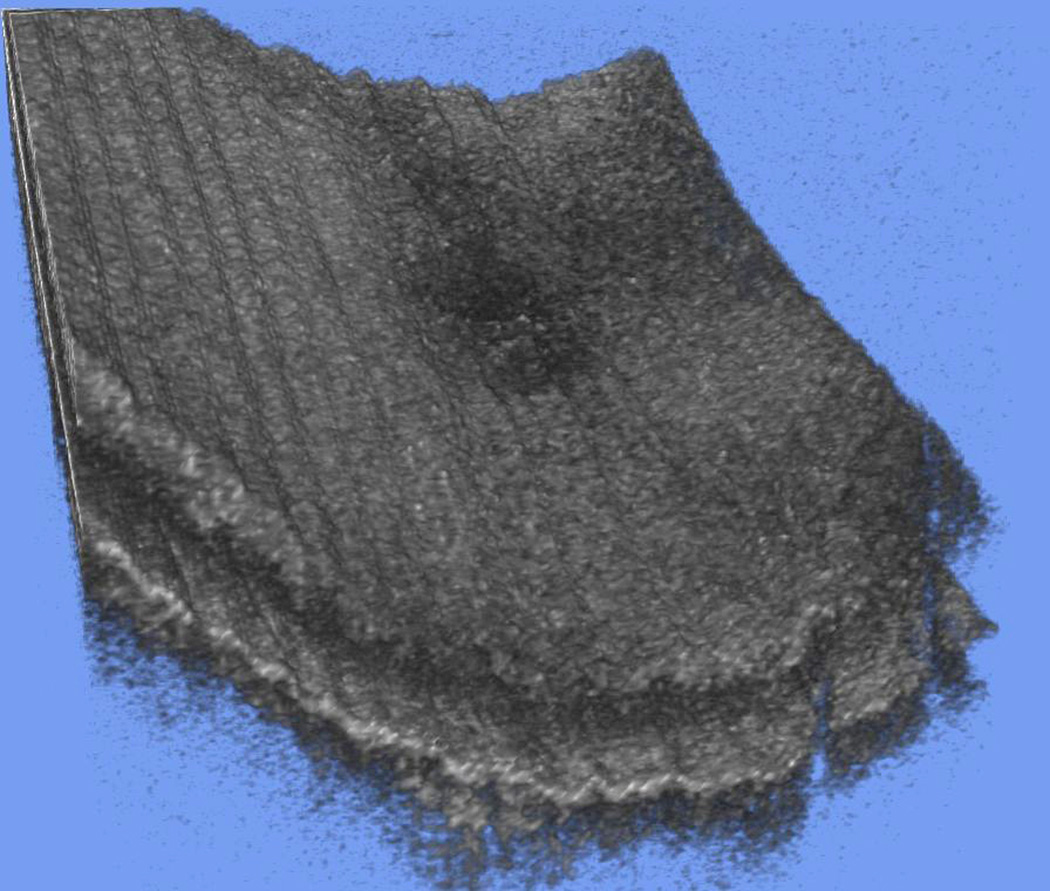
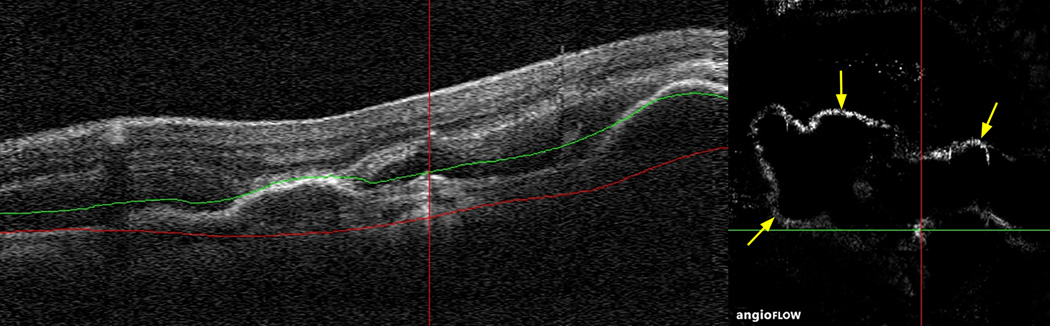
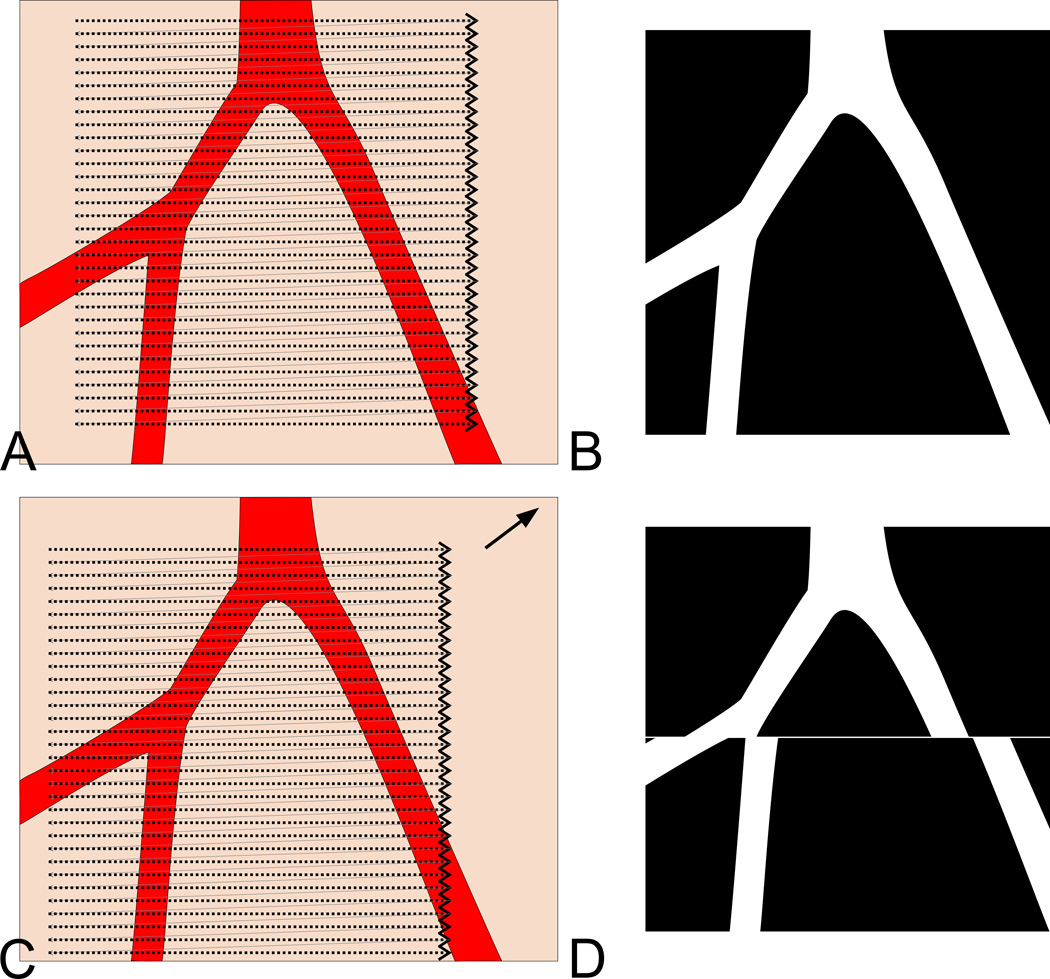
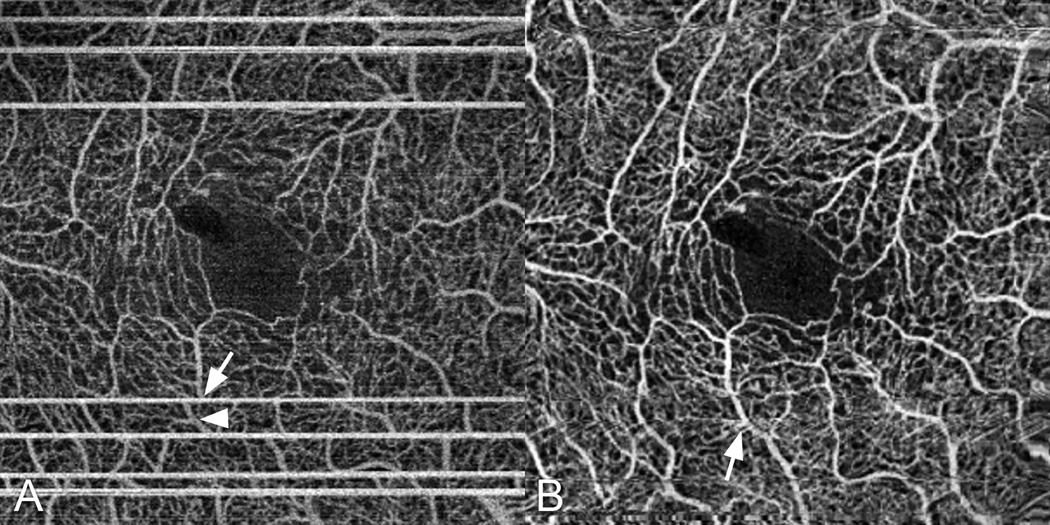
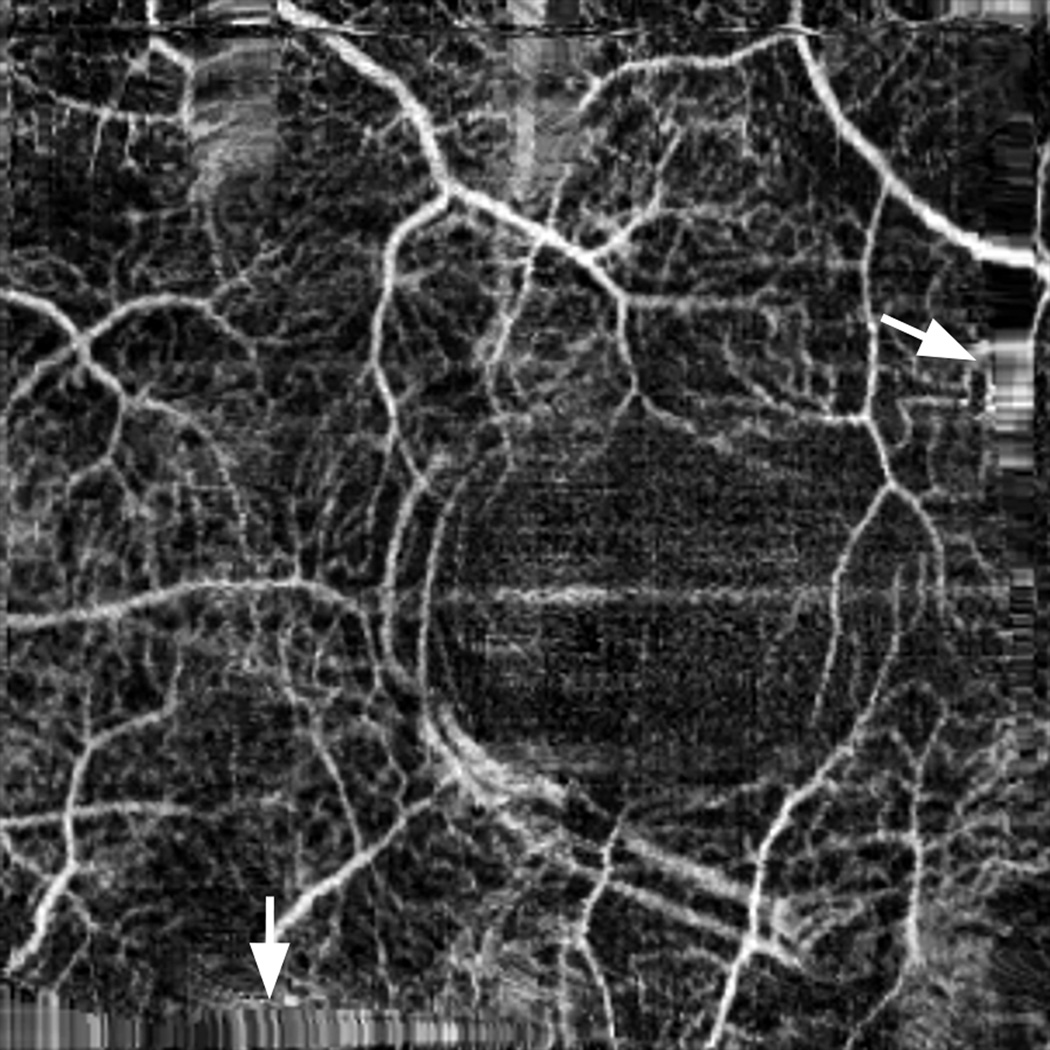
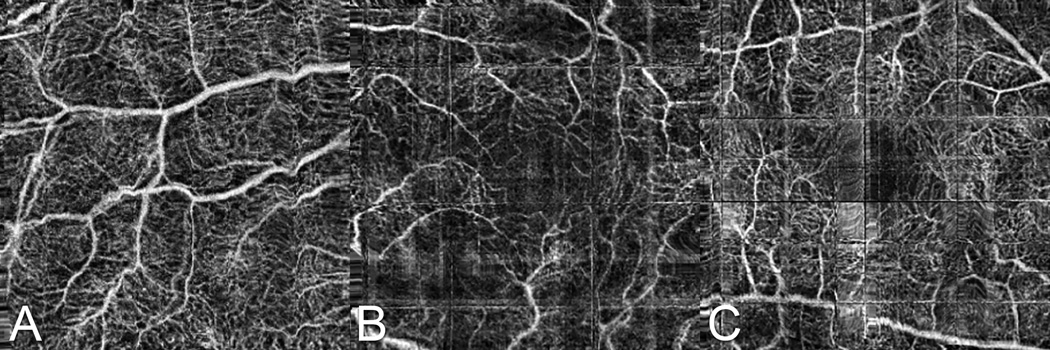
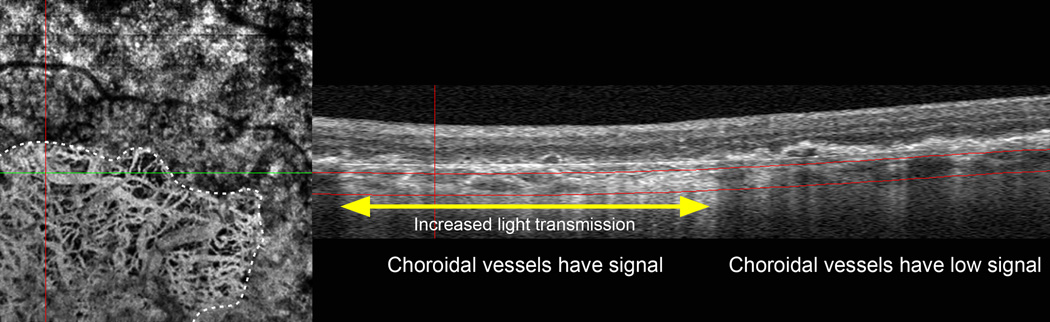
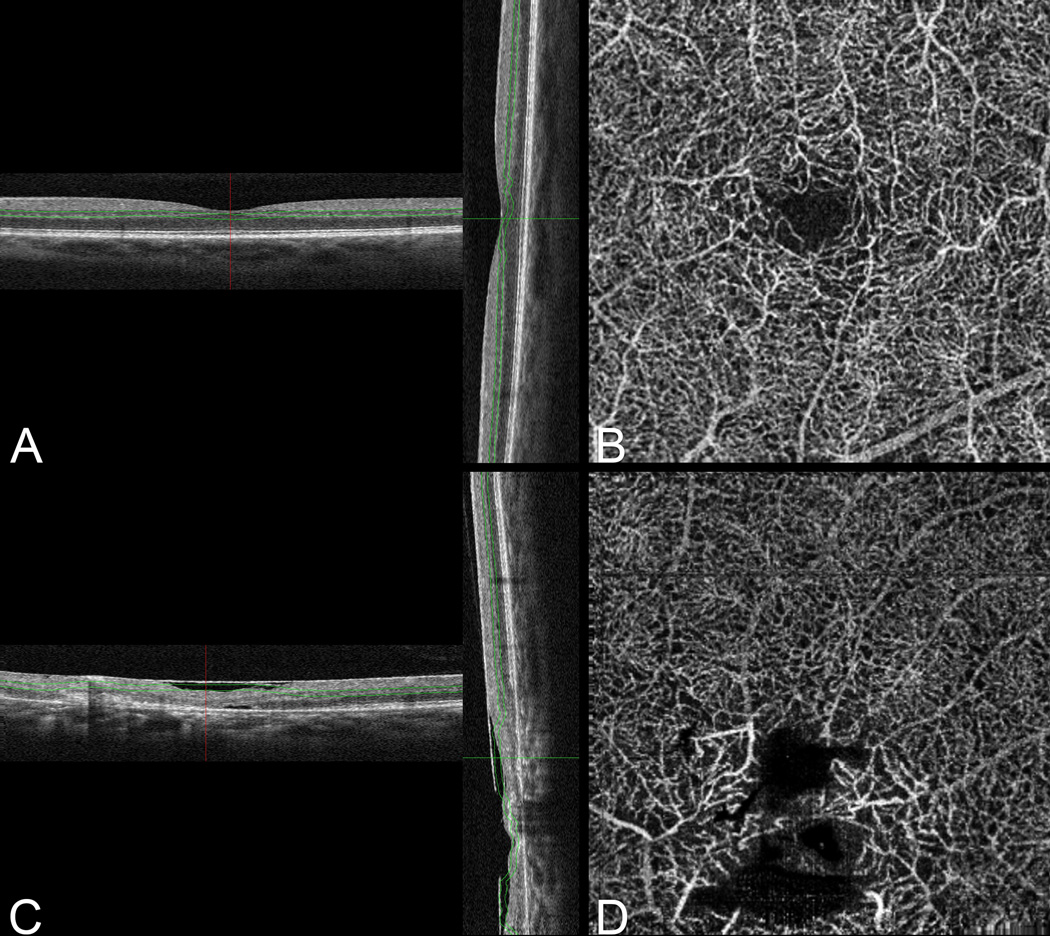
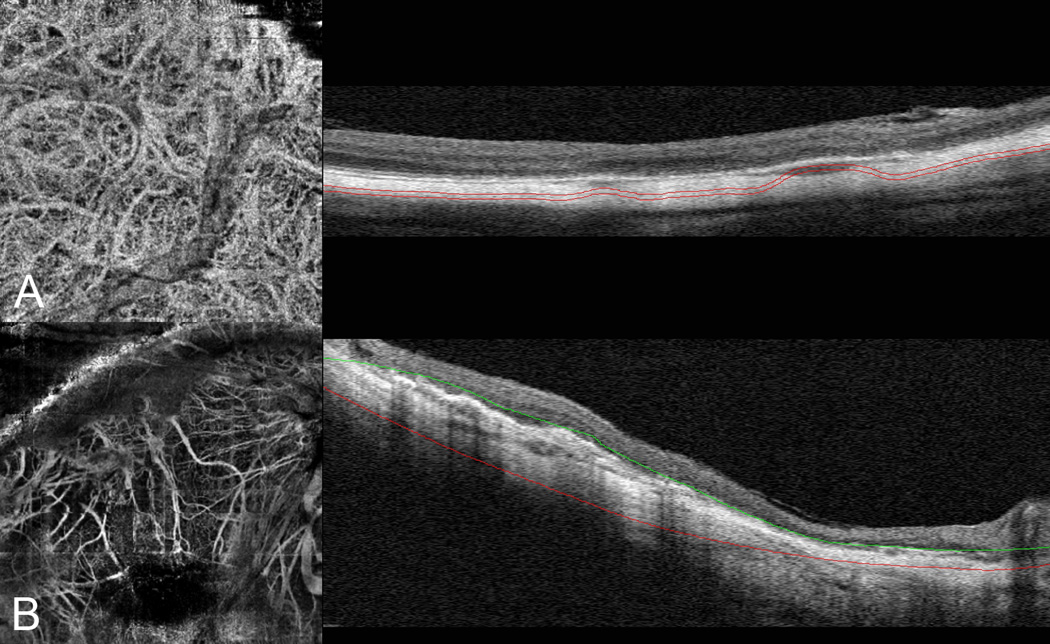
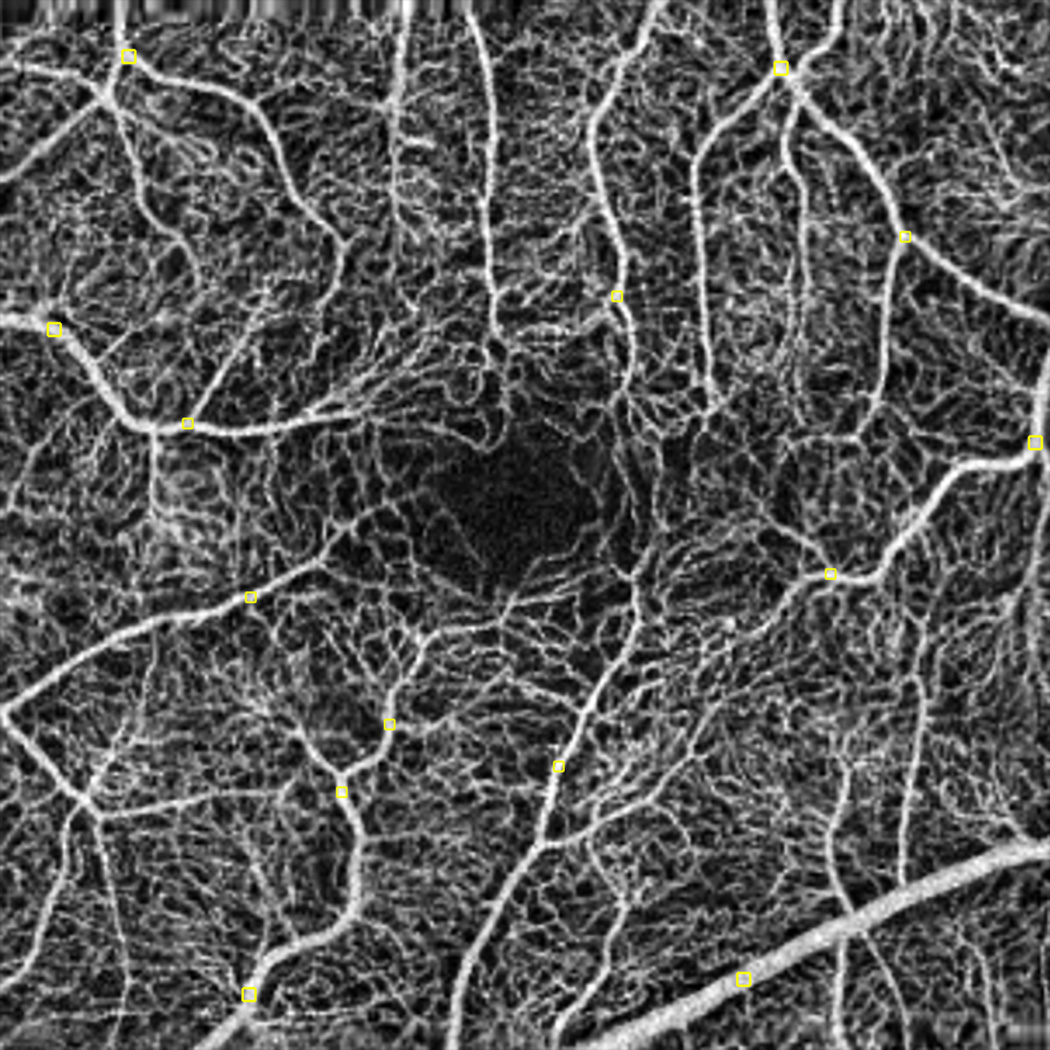
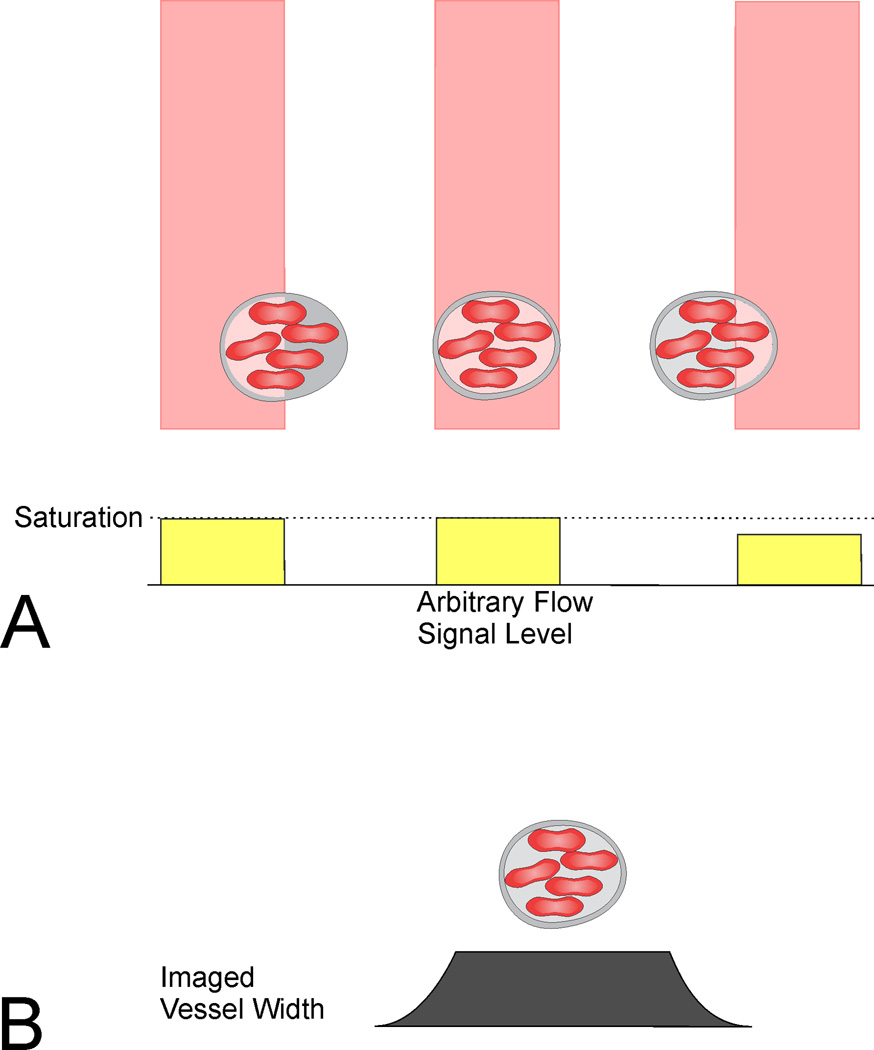
Results: Optical coherence tomography angiography uses motion contrast to image blood flow and thereby images the vasculature without the need for a contrast agent. Artifacts are very common and can arise from the OCT image acquisition, intrinsic characteristics of the eye, eye motion, image processing, and display strategies. Optical coherence tomography image acquisition for angiography takes more time than simple structural scans and necessitates trade-offs in flow resolution, scan quality, and speed. An important set of artifacts are projection artifacts in which images of blood vessels seem at erroneous locations. Image processing used for OCT angiography can alter vascular appearance through segmentation defects, and because of image display strategies can give false impressions of the density and location of vessels. Eye motion leads to discontinuities in displayed data. Optical coherence tomography angiography artifacts can be detected by interactive evaluation of the images.

Conclusion: Image artifacts are common and can lead to incorrect interpretations of OCT angiography images. Because of the quantity of data available and the potential for artifacts, physician interaction in viewing the image data will be required, much like what happens in modern radiology practice.


Figures

Figure 1
Figure 1
At each location in a volume scan multiple B-scans are obtained and compared. Regional variation in images is inferred to represent motion.
Figure 2
Figure 2
More than one image is compared in methods employing variance. Note the upper series of pixels (intersected by the yellow arrow); even though they are brighter than the background they do not vary among the images. The red arrow bisects pixels that in aggregate have the same mean value as the pixels bisected by the yellow arrow but show variability from one image to the next.
Figure 3
Figure 3
A. The wavefront of incoming light is shown by the straight line and when reflected by the surface numerous secondary waves radiate outward in a spherical fashion. These waves may cause varying amounts of constructive and destructive interference with each other setting up the condition for speckle formation. Since the reflecting surface is stable, so are the speckles. B. In the case of moving blood cells the reflecting pattern changes through time as the cells change position. Thus the speckle pattern will change. C. Light striking the blood vessel will do more than just be reflected back to the instrument, the light will pass through the vessel, be refracted, absorbed, and scattered to varying degrees. The light passing through the vessel is free to strike deeper reflecting surfaces. The light reaching these surfaces varies over time because of the effects of the blood flow in the vessel. Therefore any reflecting surface will appear to change over time and will be rendered as having flow.
Figure 4
Figure 4
Media opacity causing artifact. A. A barely visible vitreous condensation had a peculiar shape. To improve visualization of the opacity adaptive histogram equalization was performed. B. There was shadowing of the B-scan OCT image evident. C. A defect in the angiographic image was seen that corresponded to the vitreous condensation. Note in the darkest portions of the artifact, no flow is evident from the retinal vessels because of the loss of signal caused by the vitreous opacity. By analogy loss of signal caused by the pigment in the retinal pigment epithelium decreases visualization of blood flow in the choroid.
Figure 5
Figure 5
Origin of projection artifacts. A through C. Water is flowing in the clear channel and in successive images that in aggregate would be shown as a region of variable reflections. However the light going through the water strikes the background and this reflection changes over time. In D the variance image shows high variance in both locations even though flow occurred at only one region.
Figure 6
Figure 6
En-face layers and projection artifacts. Images A through E are different layers of the same eye. On the left is the angiographic image and on the right a B-scan image showing the level at which the angiographic image was obtained. In (A) the inner retinal circulation is shown. B. If the slab section is lowered to include the region around the inner nuclear layer the deep vascular plexus should be seen. However the vascular pattern looks quite similar to the inner plexus. Note the large retinal vessel seen in the angiographic image (arrow), but the section taken as shown in the B-scan image is clearly below the large vessel (arrow). Therefore the inner retinal vessels are being shown because of a projection image. C. If the software option is selected to remove the projection image from the inner retina, no vessels are visible. D. If the slab section is taken slightly posteriorly the deep plexus is more clearly seen. Note the slab section is centered on the outer plexiform layer, implying much of what is seen in the angiographic image is really a projection image. E. If the slab section is placed in the outer nuclear layer a noise pattern is seen as there is no blood flow in this avascular layer.
Figure 7
Figure 7
A. Projection artifacts from the retinal vessels to the tops of the drusen present in this patient with no choroidal neovascularization produces images that appear to have vessels. B. The same drusen attenuate the signal and cause shadowing defects in the underlying choriocapillaris, causing a false negative flow pattern (arrow).
Figure 8
Figure 8
Optimizing visualization of sub-RPE choroidal neovascularization by using the projection image. A. The OCT slab section was taken under the RPE, which is an area within a fibrovascular pigment epithelial detachment where vessels occur as shown in the structural OCT image on the right. The angiographic image on the left shows some of the choroidal neovascularization, but also shows prominent projection artifacts from the retinal circulation. Although the slab is shown by thin boundary lines the actual demarcation between the layers used to generate the angiographic image and what isn’t used is a gradient and not a sharp demarcation. B. If the slab section is moved posteriorly to lie within a layer of reflective fibrotic tissue, the choroidal neovascularization under the RPE is visualized while the retinal projection artifact is not as evident.
Figure 9
Figure 9
Images A through D are different layers of the same eye illustrated in Figure 6. On the left is the angiographic image and on the right a B-scan image showing the level at which the angiographic image was obtained. A. When the slab section is brought back to the level of the retinal pigment epithelium, a clear visualization of the retinal vessels is obtained. B. The thickness and anatomic location of the slab section was brought back to the level where the choriocapillaris resides. Note the image is dominated by retinal vascular projection. C. The slab section in (B) is displaced 15 microns further back into the choroid. Note that the angiographic image is getting brighter even though the corresponding area in the structural image is darker. The retinal vessels are less visible. D. The slab section is displaced an additional 20 microns into the choroid. The angiographic image shows a bright image suggestive of the choriocapillaris. Note the visible gap in the structural B-scan (arrow) separating the corresponding section and the expected anatomic location of the choriocapillaris.
Figure 10
Figure 10
Volume scan with the change in axial position from one B-scan to the next uncorrected. Note the fine sinusoidal movement present in the axial direction.
Figure 11
Figure 11
B scan (A) and corresponding OCTA (B) of a patient with pigment epithelial detachment. Note that the edges of the B scan generate a ‘false positive’ decorrelation signal on the OCTA image.
Figure 12
Figure 12
Demonstration of motion artifact. A. The OCT instrument creates a raster pattern while scanning a selected region of the eye. The scan takes a finite amount of time, but if the patient doesn’t move the image produced (B) has no motion artifact. C. If during the scan the eye moves in the direction of the black arrow the portion of the eye scanned prior to the movement will not match that of the portion of the eye after movement as shown in D. Note the white line at the junction of the two images, which is created because at that intersection of images there is a loss of correlation.
Figure 13
Figure 13
A. This patient has several white line defects, as highlighted by the arrow. Note a displacement artifact (arrowhead) in which there is a lateral displacement of part of the image. B. The effects of ocular motion on the OCTA were largely reduced by software techniques. Note the distortion and loss of detail at the branch point of the vessel (arrow).
Figure 14
Figure 14
An example of vessel doubling in (A) after software “correction” of ocular motion. B. One of the two component images used to create (A). The image in B alone shows no significant motion. There is slightly more noise as the averaging of two images to make (A) would be expected to increase the signal to noise ratio 3 dB.
Figure 15
Figure 15
This image has several stretch artifacts, two of which are highlighted by the arrows.
Figure 16
Figure 16
Examples of quilting defects ranging from A, a roiling distortion with some vessel doubling; B, larger rectilinear sections; to C, smaller rectangular segments some of which contain severe distortion.
Figure 17
Figure 17
Visualization of choroidal vessels. Left, an area of atrophy of the RPE and underlying choroid is present in the bottom left of the image as demarcated by the white dashed line. Within this area the choroidal vessels are visible. Right, the B-scan image corresponding to the section at the green line of the OCTA image. The area of RPE atrophy is evident by the increased transmission of light to deeper layers (yellow double arrow). Note the reflectivity arising from within the larger choroidal vessels. In the area of intact RPE there is very little evident reflectivity from within the choroidal vessels.
Figure 18
Figure 18
Segmentation defects. A. A normal retina is shown in a B-scan with a slab surrounding the inner nuclear layer, which typically would show the deep vascular plexus. The vertical image in A is the aggregate of B-scans section. Note the segmentation is accurate for the most part but the central macula shows some deviation of the slab as the inner nuclear layer doesn’t exist in the central macula. B. The vessels imaged are the deep plexus. C. A patient with advanced macular telangiectasis Type 2. There is atrophy and collapse of the retinal layers Note how the segmentation lines drift through various layers of the retina. D. The resultant vascular image is really vessels in more than one layer show as if they exist in a single layer. This is an inherent weakness of en-face segmentation and imaging.
Figure 19
Figure 19
Segmentation errors in highly myopic eyes. A. The choroid was selected for segmentation but the algorithm placed the slab selected in an undulating level encompassing some large choroidal vessels and much of the sclera. The corresponding OCTA image on the left is largely a projection image with some formed by direct section of the large choroidal vessels. B. In another highly myopic eye the outer retina was selected for segmentation. The algorithm selected part of the outer retina, plus the choroid and variable amounts of sclera. The resultant angiographic representation is difficult to interpret.
Figure 20
Figure 20
An OCT angiogram of the inner plexus of retinal vessels. Retinal arteries are known to have faster flow than veins and bigger vessels have faster flow than smaller ones, however the regions of interest bounded by the yellow boxes have nearly identical grayscale values. This illustrates the property of saturation.
Figure 21
Figure 21
Widening of the apparent diameter of retinal vessels by motion contrast techniques. Flow signal can be detected even if the illumination beam is not centered on the vessel. The signal saturates at a low level of flow signal. The effect of these factors is the diameter of vessels is imaged to be larger than they really are. The effect proportionately is more important for smaller vessels than larger ones.
Figure 22
Figure 22
Repeated OCTA scans of a diabetic with microaneurysms (A–D). Note each image is somewhat different. The leftmost microaneuryms appears large in (A) but not visible in (B). Careful examination of the images shows small capillary segments that are visible in one image but not necessarily in all. Vessels are considered to have flow if the difference in the underlying OCT images differs by a set amount. If the differences related to flow do not reach this amount no flow is considered to be present.

References

    1. Fingler J, Schwartz D, Yang C, Fraser SE. Mobility and transverse flow visualization using phase variance contrast with spectral domain optical coherence tomography. Opt Express. 2007;15(20):12636–12653. - PubMed
    1. Fingler J, Readhead C, Schwartz DM, Fraser SE. Phase-contrast OCT imaging of transverse flows in the mouse retina and choroid. Invest Ophthalmol Vis Sci. 2008;49(11):5055–5059. - PubMed
    1. Yu L, Chen Z. Doppler variance imaging for three-dimensional retina and choroid angiography. J Biomed Opt. 2010;15(1):016029. - PMC - PubMed
    1. Liu G, Qi W, Yu L, Chen Z. Real-time bulk-motion-correction free Doppler variance optical coherence tomography for choroidal capillary vasculature imaging. Opt Express. 2011;19(4):3657–3666. - PMC - PubMed
    1. Jia Y, Tan O, Tokayer J, et al. Split-spectrum amplitude-decorrelation angiography with optical coherence tomography. Optics Express. 2012;20(4):4710–4725. - PMC - PubMed

Publication types