. 2015 Oct 1;17(1):132.
doi: 10.1186/s13058-015-0641-9.

Transformation of enriched mammary cell populations with polyomavirus middle T antigen influences tumor subtype and metastatic potential

Affiliations

Transformation of enriched mammary cell populations with polyomavirus middle T antigen influences tumor subtype and metastatic potential

Daria Drobysheva et al. Breast Cancer Res. .

Abstract

Introduction: Breast cancer exhibits significant molecular, histological, and pathological diversity. Factors that impact this heterogeneity are poorly understood; however, transformation of distinct normal cell populations of the breast may generate different tumor phenotypes. Our previous study demonstrated that the polyomavirus middle T antigen (PyMT) oncogene can establish diverse tumor subtypes when broadly expressed within mouse mammary epithelial cells. In the present study, we assessed the molecular, histological, and metastatic outcomes in distinct mammary cell populations transformed with the PyMT gene.

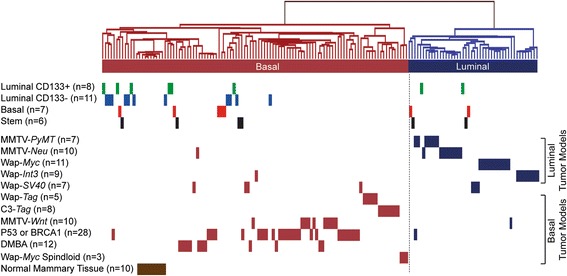
Methods: Isolated mouse mammary epithelial cells were transduced with a lentivirus encoding PyMT during an overnight infection and then sorted into hormone receptor-positive luminal (CD133+), hormone receptor-negative luminal (CD133-), basal, and stem cell populations using the cell surface markers CD24, CD49f, and CD133. Each population was subsequently transplanted into syngeneic cleared mouse mammary fat pads to generate tumors. Tumors were classified by histology, estrogen receptor status, molecular subtype, and metastatic potential to investigate whether transformation of different enriched populations affects tumor phenotype.

Results: Although enriched mammary epithelial cell populations showed no difference in either the ability to form tumors or tumor latency, differences in prevalence of solid adenocarcinomas and squamous, papillary, and sebaceous-like tumors were observed. In particular, squamous metaplasia was observed more frequently in tumors derived from basal and stem cells than in luminal cells. Interestingly, both molecularly basal and luminal tumors developed from luminal CD133+, basal, and stem cell populations; however, luminal CD133- cells gave rise exclusively to molecularly basal tumors. Tumors arising from the luminal CD133-, basal, and stem cell populations were highly metastatic; however, luminal CD133+ cells generated tumors that were significantly less metastatic, possibly due to an inability of these tumor cells to escape the primary tumor site.

Conclusions: Expression of PyMT within different mammary cell populations influences tumor histology, molecular subtype, and metastatic potential. The data demonstrate that luminal CD133+ cells give rise to less metastatic tumors, luminal CD133- cells preferentially establish basal tumors, and the cell of origin for squamous metaplasia likely resides in the basal and stem cell populations.


Figures

Fig. 1
Fig. 1
A model to assess the influence of the cell of origin on tumor phenotype. a Freshly isolated mammary epithelial cells (MECs) were transduced with the EF1α-PyMT-ZsGreen lentivirus, sorted into distinct populations by fluorescence-activated cell sorting (FACS), and transplanted into the cleared mammary fat pads of syngeneic mice. b Transduced MECs were sorted into basal, luminal, and stem cell populations based on the expression of the cell surface markers CD49f and CD24 (right). Luminal cells were further sorted according to CD133 expression into hormone receptor–positive (CD133+) and hormone receptor–negative (CD133−) populations (left). The collected populations are indicated by red gates. APC allophycocyanin, PE phycoerythrin. c FACS-enriched populations were evaluated for expression of basal keratin 14 (K14; red), luminal keratin 8 (K8; green), and 4′,6-diamidino-2-phenylindole dihydrochloride (blue) by immunofluorescence (scale bar = 20 μm). Inset shows representative K14/K8 double-positive cells from the stem cell enriched population (scale bar = 10 μm). d Quantification of the cytokeratin profile for each MEC subgroup (n = total number of cells imaged). e Real-time quantitative PCR (RT-qPCR) quantification of relative differences in cytokeratin (K8, K14), hormone receptor (p rogesterone [Pgr], estrogen receptor [Esr1]), transcription factor (p63, Slug), and tyrosine-protein kinase (c-Kit) RNA expression levels between sorted MEC populations normalized to the GAPDH housekeeping gene. Expression levels were compared (by t test) with RNA from unsorted controls (dashed line). *p < 0.05, **p < 0.01, ***p < 0.0005, ****p < 0.0001; ^expression values for p63 and Slug in the luminal CD133+ population could not be determined, as amplification only rarely occurred below 40 cycles. Each data point is a mean ± SEM for triplicate qPCR reactions from three independent cDNA synthesis/preamplification reactions (n = 9). f Kaplan-Meier curves of mice receiving orthotopic transplants of distinct MEC subgroups. Mice were killed when tumors reached 2 cm in diameter (n = number of mice). g RT-qPCR quantification of relative PyMT mRNA expression levels in averaged luminal CD133+ cell, luminal CD133− cell, basal cell, and stem cell tumors normalized to the Rplp0 housekeeping gene. No significant differences between tumor groups were detected (by t test, n = number of tumors). h Average ratio of phosphorylated (pAKT) to AKT, phosphorylated extracellular signal-regulated kinase (pERK) to ERK, and phosphorylated SRC (pSRC) to Src protein expression in luminal CD133+, luminal CD133−, basal, and stem cell tumors normalized to the β-actin. No significant differences were detected between tumor groups (by analysis of variance for multiple comparisons)
Fig. 2
Fig. 2
Analysis and prevalence of histology in tumors derived from mammary epithelial cell (MEC) populations. a through f Representative images of hematoxylin and eosin and cytokeratin staining of tumor histologies: acinar (a), papillary (b), solid adenocarcinoma (c), squamous (d), lipid rich (e), and sebaceous-like (f). Immunofluorescence staining was performed for basal keratin 14 (K14; red) and luminal keratin 8 (K8; green) (scale bar = 100 μm). ZsGreen fluorescence was not detected in the processed sections. Histological area per tumor was derived from luminal CD133+ cells (g), luminal CD133− cells (h), basal cells (i), and stem cells (j). Boxes above each column indicate tumors that were used for microarray analysis. Red boxes = basal subgroup; green boxes = luminal subgroup. Black circles mark tumors that were metastatic. k Average area of histology per MEC group (unpaired t test; n = number of tumors). l Representative images of estrogen receptor (ESR1) staining, including negative (left panel) and positive staining (right panel) (scale bar = 50 μm; n = number of tumors). m Quantification of ESR1 staining per MEC group (two proportion z test). n Quantification of ESR1 staining per histological specimen (two proportion z test). *p < 0.05, **p < 0.01, ***p < 0.0005, ****p < 0.0001
Fig. 3
Fig. 3
Tumor microarray gene expression profiling. Tumors were analyzed by microarray gene expression profiling and hierarchically clustered with mouse mammary tumor models using an intrinsic gene set identified by Herschkowitz et al. [7]. Vertical lines indicate individual tumors. Each enriched mammary epithelial cell population is indicated by a different color: green = luminal CD133+; blue = luminal CD133−; red = basal; black = stem cells. Mouse mammary tumor models that generate molecularly luminal tumors are shown in dark blue, and those predominantly within the basal subgroup are displayed in dark red. Normal mouse mammary tissue is represented in brown (n = number of tumors). DMBA 7,12-dimethylbenz[a]anthracene, MMTV mouse mammary tumor virus, PyMT polyomavirus middle T antigen
Fig. 4
Fig. 4
Metastatic profiles of tumors generated from enriched mammary epithelial cell populations. a Representative bright-field (left panel) and fluorescent (right panel) images of the same lung. Arrowheads indicate metastases (scale bar = 1 mm). b Representative image of hematoxylin and eosin staining of a metastatic lung section. Arrows indicate metastases (scale bar = 1 mm). c Percentage of mice with lung metastases per tumor group. Luminal CD133+ cell tumors were less metastatic than the other tumor groups (two proportion z test; n = number of mice). d Number of metastatic lung foci per tumor group. Luminal CD133+ cell tumors generated fewer metastatic foci than the other tumor groups (Mann–Whitney U test; median values shown). e Quantification of metastasis area per unique metastatic site in serial lung sections. No difference in size of tumor metastasis was detected between the tumor groups (n = number of mice). f Normalized number of circulating tumor cells in mice with luminal CD133+ tumors compared with all other tumor groups. ZsGreen signaling in whole blood isolated from tumor bearing mice was analyzed by fluorescence-activated cell sorting and normalized to no-tumor control signal. Luminal CD133+ tumor-bearing mice had fewer circulating tumor cells. Mice with non-metastatic tumors are represented by green, and those with metastatic tumors are represented by black (unpaired t test; mean values shown; n = number of mice). g Quantification of the number of lung tumor foci per tail vein injection of metastatic luminal CD133+ tumor cells (tumor 1), non-metastatic luminal CD133+ tumor cells (tumor 2), or metastatic luminal CD133− tumor cells (tumors 3 and 4) (unpaired t test; mean values shown; n = number of mice). Data shown in (a)–(e) represent spontaneous metastasis occurring from primary tumors, and data shown in (f) are from non-spontaneous tail vein injection assays. *p < 0.05, **p < 0.01, ***p < 0.0005, ****p < 0.0001

Similar articles

Cited by

References

    1. Sørlie T, Perou CM, Tibshirani R, Aas T, Geisler S, Johnsen H, et al. Gene expression patterns of breast carcinomas distinguish tumor subclasses with clinical implications. Proc Natl Acad Sci U S A. 2001;98:10869–74. doi: 10.1073/pnas.191367098. - DOI - PMC - PubMed
    1. Malhotra GK, Zhao X, Band H, Band V. Histological, molecular and functional subtypes of breast cancers. Cancer Biol Ther. 2010;10:955–60. doi: 10.4161/cbt.10.10.13879. - DOI - PMC - PubMed
    1. Weigelt B, Reis-Filho JS. Histological and molecular types of breast cancer: is there a unifying taxonomy? Nat Rev Clin Oncol. 2009;6:718–30. doi: 10.1038/nrclinonc.2009.166. - DOI - PubMed
    1. Santagata S, Ince TA. Normal cell phenotypes of breast epithelial cells provide the foundation of a breast cancer taxonomy. Expert Rev Anticancer Ther. 2014;14:1385–9. doi: 10.1586/14737140.2014.956096. - DOI - PMC - PubMed
    1. Visvader JE, Stingl J. Mammary stem cells and the differentiation hierarchy: current status and perspectives. Genes Dev. 2014;28:1143–58. doi: 10.1101/gad.242511.114. - DOI - PMC - PubMed

Publication types

MeSH terms