. 2015 Nov;25(11):873-87.
doi: 10.1016/j.nmd.2015.09.001. Epub 2015 Sep 6.

Sparing of the extraocular muscles in mdx mice with absent or reduced utrophin expression: A life span analysis

Affiliations

Sparing of the extraocular muscles in mdx mice with absent or reduced utrophin expression: A life span analysis

Abby A McDonald et al. Neuromuscul Disord. 2015 Nov.

Abstract

Sparing of the extraocular muscles in muscular dystrophy is controversial. To address the potential role of utrophin in this sparing, mdx:utrophin(+/-) and mdx:utrophin(-/-) mice were examined for changes in myofiber size, central nucleation, and Pax7-positive and MyoD-positive cell density at intervals over their life span. Known to be spared in the mdx mouse, and contrary to previous reports, the extraocular muscles from both the mdx:utrophin(+/-) and mdx:utrophin(-/-) mice were also morphologically spared. In the mdx:utrophin(+/)(-) mice, which have a normal life span compared to the mdx:utrophin(-/-) mice, the myofibers were larger at 3 and 12 months than the wild type age-matched eye muscles. While there was a significant increase in central nucleation in the extraocular muscles from all mdx:utrophin(+/)(-) mice, the levels were still very low compared to age-matched limb skeletal muscles. Pax7- and MyoD-positive myogenic precursor cell populations were retained and were similar to age-matched wild type controls. These results support the hypothesis that utrophin is not involved in extraocular muscle sparing in these genotypes. In addition, it appears that these muscles retain the myogenic precursors that would allow them to maintain their regenerative capacity and normal morphology over a lifetime even in these more severe models of muscular dystrophy.

Keywords: Extraocular muscle; Muscular dystrophy; MyoD; Pax7; Satellite cell; Utrophin.


Figures

Figure 1
Figure 1
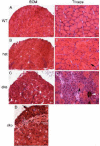
Utrophin Expression in Extraocular Muscle Cross-sections in WT, mdx, mdx:utrophin+/−, and mdx:utrophin−/− Mice. A) Expression in EOM from WT mouse. Arrow indicates positive immunostaining. As expected from the literature, utrophin was found in the areas of the EOM containing neuromuscular junctions and expressed in lower levels in areas more distant from the end plate zone (not shown). B) Expression in EOM from mdx mouse. Increased numbers of myofibers expressed utrophin compared to the WT muscle, and its distribution was wider in terms of both numbers of fibers and in terms of expression proximal or distal to the main endplate zone (not shown). Arrows indicate positive immunostaining. C) Expression in EOM from mdx:utrophin+/− (het) mouse. Arrow indicates positive immunostaining. Note that there are far fewer fibers showing utrophin expression than in the mdx EOM cross-sections, but more than was seen in the WT EOM sections. D) There was no expression of utrophin in the mdx:utrophin−/− (dko) mouse EOM. Bar is 30 μm.
Figure 2
Figure 2
Sparing of the Extraocular Muscles (EOM) in mdx:utrophin+/− (het) and mdx:utrophin−/− (dko) Mice but not the Levator Palpebrae Superioris Muscle or Triceps Skeletal Muscles. Photomicrographs of muscle specimens stained with hematoxylin and eosin obtained from mice at 3 months of age, except the mdx:utrophin−/− muscles which were obtained from 2 month old mice. Extraocular muscles from A. a wild type (WT) control EOM, B. an mdx:utrophin+/− (het) EOM, and C. an mdx:utrophin−/− (dko) EOM demonstrate that there was little sign of muscle pathology in the mouse models of muscular dystrophy. Bar for A-C is 100 μm. D. Photomicrograph of the levator palpebrae superioris (LPS) and the superior rectus muscle of an mdx:utrophin−/− (dko) mouse. Note that the LPS was significantly affected, with central nucleation (arrow) in almost every myofiber present, while the superior rectus was normal in appearance. E. Photomicrographs of normal triceps muscle from a wild type (WT) mouse, F. an mdx:utrophin+/− (het) triceps muscle, and G. an mdx:utrophin−/− (dko) triceps muscle demonstrate dystrophic pathology. There were many centrally nucleated myofibers in the mdx:utrophin+/− limb muscle specimen. The pathology was even more in the triceps muscle from the dko mouse. This included basophilic myofibers suggestive of new regeneration and accelerated protein synthesis, central nucleation (arrow), and a calcified fiber (arrowhead). For D-G, bar is 20μm.
Figure 3
Figure 3
Cross-sectional Areas in Extraocular Muscles from WT, mdx, mdx:utrophin+/− (het), and mdx:utrophin−/− (dko) Mice. A. Quantification of mean myofiber cross-sectional area in the orbital layer of WT, mdx, mdx:utrophin+/− (het), and mdx:utrophin−/− (dko) at indicated intervals showed that there were few differences between any of the genotypes at any of the ages examined. The only significant difference was between the WT orbital layer myofibers and the mdx/utrophin+/− myofibers at 12 months. B. Quantification of mean myofiber cross-sectional area in the global layer of WT, mdx, mdx:utrophin+/−, and mdx:utrophin−/− mice at indicated intervals showed that there were few differences between any of the genotypes at any of the ages examined. The only significant differences were between the WT global layer myofibers and the mdx/utrophin+/− myofibers at 3 months and the WT global layer myofibers and both the mdx and mdx/utrophin+/− myofibers at 12 months. Data are expressed as mean ± SEM. * indicates significant difference from WT control.
Figure 4
Figure 4
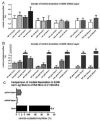
Central Nucleation in Extraocular Muscles from WT, mdx, mdx:utrophin+/−(het), and mdx:utrophin−/− (dko) Mice. A. Quantification of central nucleation density in the orbital layer of the EOM in WT, mdx, mdx:utrophin+/−, and mdx:utrophin−/− at indicated intervals showed that in the orbital layer there were no significant differences between any of the genotypes at any of the ages examined. B. Quantification of the density of central nucleation in the global layer of the EOM in WT, mdx, mdx:utrophin+/−, and mdx:utrophin−/− mice at indicated intervals showed that for each set of age-matched muscles, there were significantly more myofibers with centrally located nuclei in the mdx:utrophin+/− (het) than in WT control global layer myofibers at that time point. * indicates significant difference from WT control. C. Comparison of the density of central nucleation in the EOM orbital and global layers compared to triceps muscles from the mdx:utrophin+/− mouse. Note that the density of centrally located nuclei in EOM was approximately 30-fold lower than what was seen in the triceps muscles of age-matched mdx:utrophin+/− mice. Data are expressed as mean ± SEM. * indicates significant difference from EOM.
Figure 5
Figure 5
Density of Collagen I in WT, mdx, mdx:utrophin+/−, and mdx:utrophin−/− Mice. A. Photomicrographs of collagen I immunostaining in the EOM of WT (A), mdx:utrophin+/− (het) (B), and mdx:utrophin−/− (dko) mice (C). Arrows indicate collagen I which was significantly increased in these two genotypes compared to WT control. Bar is 50μm. D. Quantification of collagen I density in the EOM of WT, mdx, mdx:utrophin+/−, and mdx:utrophin−/− at indicated intervals shows that collagen I was upregulated in the EOM of both mdx:utrophin+/−, and mdx:utrophin−/− EOM. Data are expressed as mean ± SEM. * indicates significant difference from WT control.
Figure 6
Figure 6
Density of Collagen IV in WT, mdx, mdx:utrophin+/− (het), and mdx:utrophin−/− (dko) Mice. Photomicrographs of collagen IV immunostaining in the EOM of WT (A), mdx (B), mdx:utrophin+/− (het) (C), and mdx:utrophin−/− (dko) mice (D). Arrows indicate collagen IV around individual myofibers. The collagen IV levels in the disease models did not appear to differ significantly from levels in WT control mice. Bar is 50μm. E. Quantification of collagen IV density in the EOM of WT, mdx, mdx:utrophin+/−, and mdx:utrophin−/− at indicated intervals show that there were no significant changes in the level of collagen IV in the four genotypes examined. Data are expressed as mean ± SEM.
Figure 7
Figure 7
Pax7-Positive Satellite Cell Density in EOM from WT, mdx, mdx:utrophin+/−, and mdx:utrophin−/− Mice. A. EOM from an mdx:utrophin+/− (het) mouse immunostained for the expression of Pax7, with several positive nuclei indicated by the black arrows. Bar is 20μm. B. Quantification of Pax7-positive cell density in the orbital layer of WT, mdx, mdx:utrophin+/−, and mdx:utrophin−/− (dko) at indicated intervals showing no significant differences in Pax7-positive nuclear density at any of the ages or genotypes examined. C. Quantification of Pax7-positive satellite cell density in the global layer of WT, mdx, mdx:utrophin+/−, and mdx:utrophin−/− at indicated intervals. There were no significant differences when compared to age-matched WT controls. Data are expressed as mean ± SEM.
Figure 8
Figure 8
: MyoD-Positive Cell Density in the EOM of WT, mdx, mdx:utrophin+/−, and mdx:utrophin−/− Mice. A. EOM from an mdx:utrophin+/− (het) mouse immunostained for the expression of MyoD, with two positive nuclei in the orbital layer indicated by the black arrows. B. EOM from an mdx mouse immunostained for the expression of MyoD, with two positive nuclei in the orbital layer and two positive nuclei in the global layer indicated by the black arrows. Bar is 20μm. C. Quantification of MyoD-positive cell density in the orbital layer of WT, mdx, mdx:utrophin+/−, and mdx:utrophin−/− (dko) at indicated intervals showed that there was no significant difference in the density of MyoD-positive cells in any of the genotypes at any of the ages examined. D. Quantification of MyoD-positive cell density in the global layer of WT, mdx, mdx:utrophin+/−, and mdx:utrophin−/− at indicated intervals showed a significant increase in density of MyoD-positive nuclei in the mdx andmdx:utrophin−/− EOM compared to WT control global layer. No other significant differences were seen. Data are expressed as mean ± SEM. * indicates significant difference from age-matched WT control.

Similar articles

Cited by

References

    1. Marques MJ, Ferretti R, Vomero VU, Minatel E, Neto HS. Intrinsic laryngeal muscles are spared from myonecrosis in the mdx mouse model of Duchenne muscular dystrophy. Muscle Nerve. 2007;35:349–353. - PubMed
    1. Vereecken RL, Verduyn H. The electrical activity of the paraurethral and perineal muscles in normal and pathological conditions. Br. J. Urol. 1970;2:457–463. - PubMed
    1. Karpati G, Carpenter S. Small caliber skeletal muscle fibers do not suffer deleterious consequences of dystrophic gene expression. Am. J. Med. Genet. 1986;25:653–658. - PubMed
    1. Kaminski HJ, al-Hakim M, Leigh RJ, Katirji MB, Ruff RL. Extraocular muscles are spared in advanced Duchenne dystrophy. Ann. Neurol. 1992;32:586–588. - PubMed
    1. McLoon LK. In: The Extraocular Muscles. In: Adler's Physiology of the Eye. Kaufman P, Alm A, Levin LA, Nilsson S, Ver Hoeve J, Wu SM, editors. Mosby Press; Missouri: 2011. pp. 182–207.

Publication types

MeSH terms

LinkOut - more resources