

Theoretical detection threshold of the proton-acoustic range verification technique
- PMID: 26429247
- PMCID: PMC4567582
- DOI: 10.1118/1.4929939
Theoretical detection threshold of the proton-acoustic range verification technique
Abstract
Purpose: Range verification in proton therapy using the proton-acoustic signal induced in the Bragg peak was investigated for typical clinical scenarios. The signal generation and detection processes were simulated in order to determine the signal-to-noise limits.
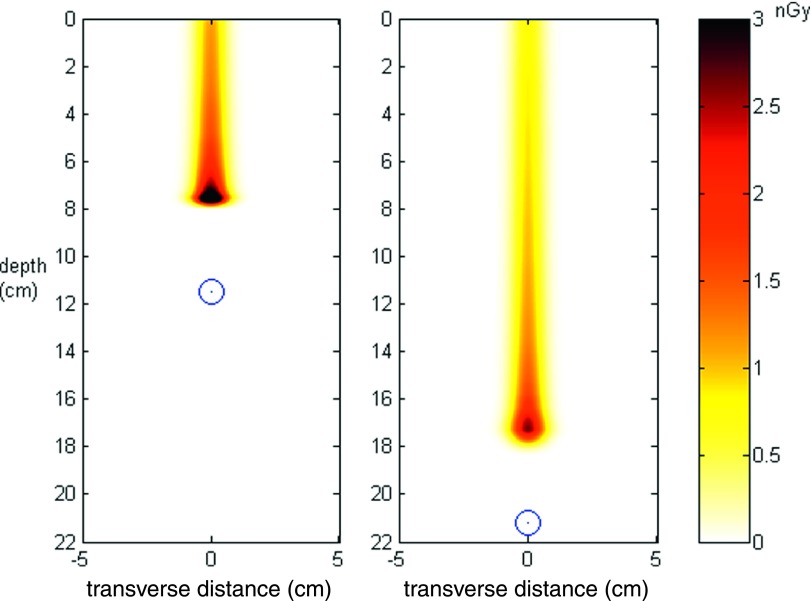
Methods: An analytical model was used to calculate the dose distribution and local pressure rise (per proton) for beams of different energy (100 and 160 MeV) and spot widths (1, 5, and 10 mm) in a water phantom. In this method, the acoustic waves propagating from the Bragg peak were generated by the general 3D pressure wave equation implemented using a finite element method. Various beam pulse widths (0.1-10 μs) were simulated by convolving the acoustic waves with Gaussian kernels. A realistic PZT ultrasound transducer (5 cm diameter) was simulated with a Butterworth bandpass filter with consideration of random noise based on a model of thermal noise in the transducer. The signal-to-noise ratio on a per-proton basis was calculated, determining the minimum number of protons required to generate a detectable pulse. The maximum spatial resolution of the proton-acoustic imaging modality was also estimated from the signal spectrum.
Results: The calculated noise in the transducer was 12-28 mPa, depending on the transducer central frequency (70-380 kHz). The minimum number of protons detectable by the technique was on the order of 3-30 × 10(6) per pulse, with 30-800 mGy dose per pulse at the Bragg peak. Wider pulses produced signal with lower acoustic frequencies, with 10 μs pulses producing signals with frequency less than 100 kHz.
Conclusions: The proton-acoustic process was simulated using a realistic model and the minimal detection limit was established for proton-acoustic range validation. These limits correspond to a best case scenario with a single large detector with no losses and detector thermal noise as the sensitivity limiting factor. Our study indicated practical proton-acoustic range verification may be feasible with approximately 5 × 10(6) protons/pulse and beam current.
Figures


References
-
- Min C.-H., Kim C. H., Youn M.-Y., and Kim J.-W., “Prompt gamma measurements for locating the dose falloff region in the proton therapy,” Appl. Phys. Lett. 89(18), 183517 (2006).10.1063/1.2378561 - DOI
-
- Sulak L. et al., “Experimental studies of the acoustic signature of proton beams traversing fluid media,” Nucl. Instrum. Methods 161(2), 203–217 (1979).10.1016/0029-554X(79)90386-0 - DOI
Publication types
MeSH terms
Substances
Grants and funding
LinkOut - more resources
Full Text Sources
Other Literature Sources
