. 2015 Dec;25(12):1860-72.
doi: 10.1101/gr.192237.115. Epub 2015 Oct 1.

Single-cell RNA-seq reveals changes in cell cycle and differentiation programs upon aging of hematopoietic stem cells

Affiliations

Single-cell RNA-seq reveals changes in cell cycle and differentiation programs upon aging of hematopoietic stem cells

Monika S Kowalczyk et al. Genome Res. 2015 Dec.

Abstract

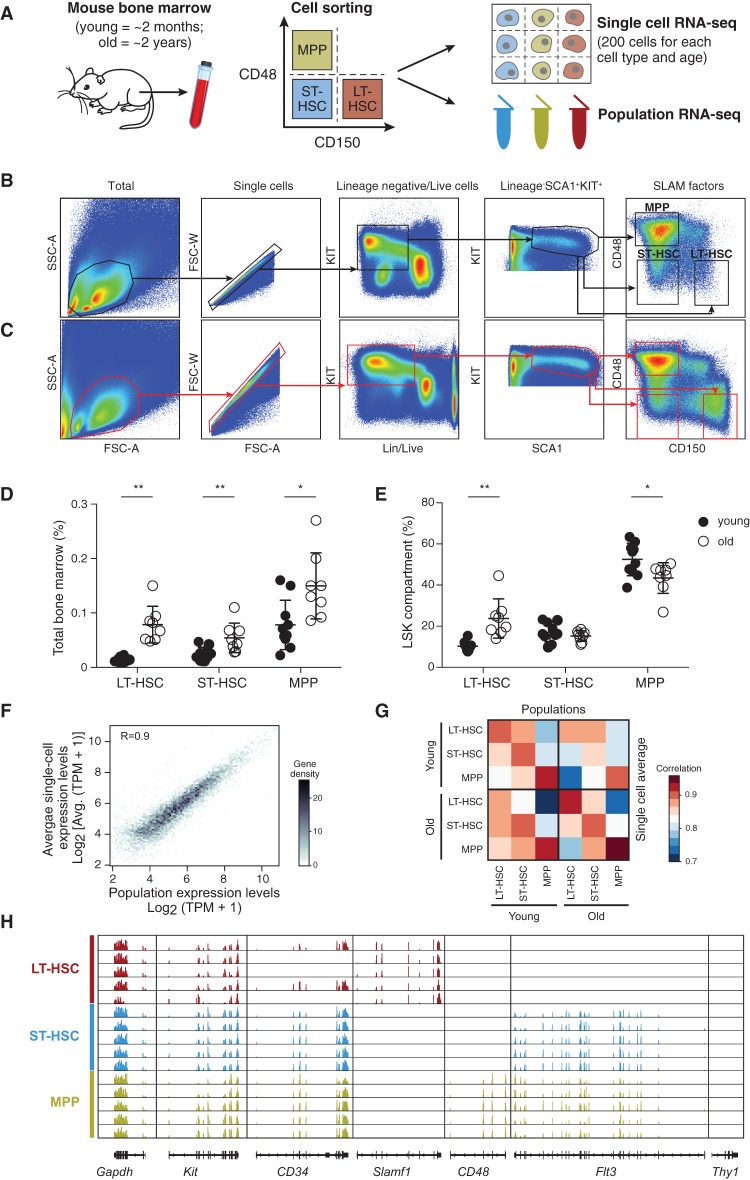
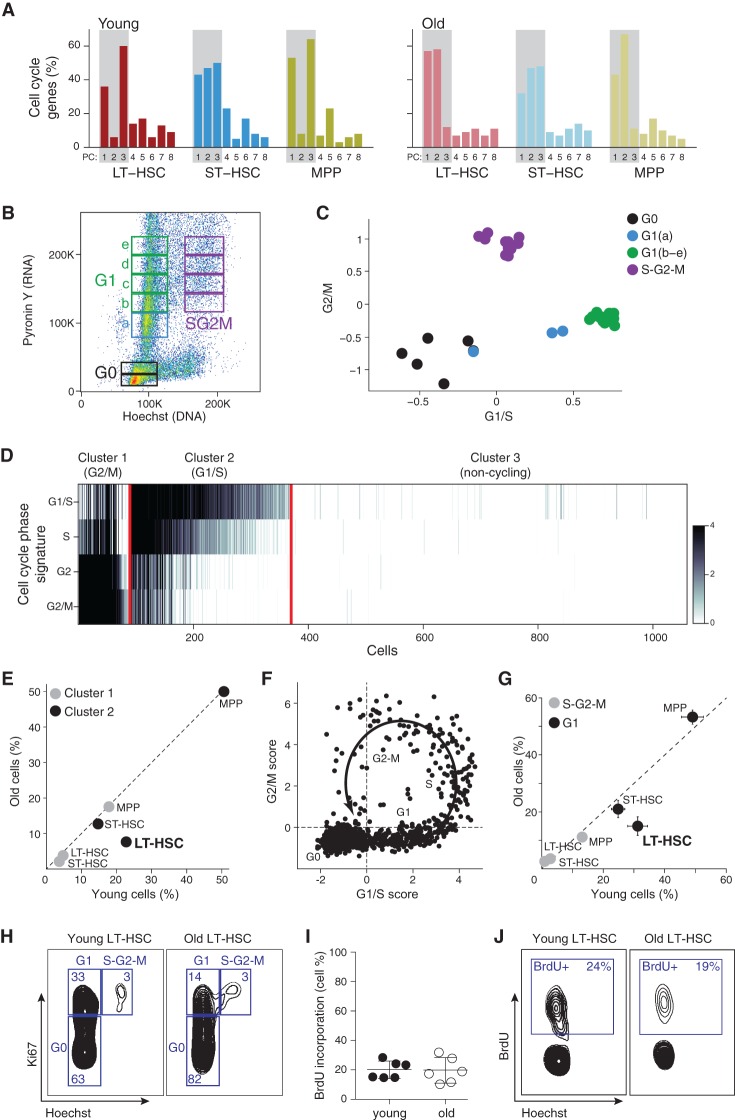
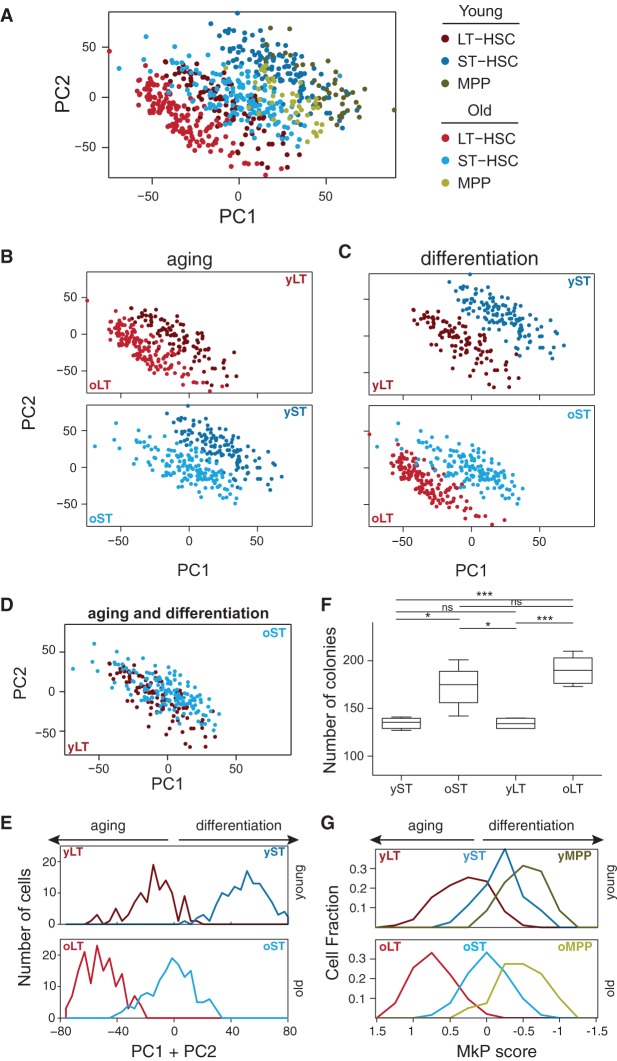
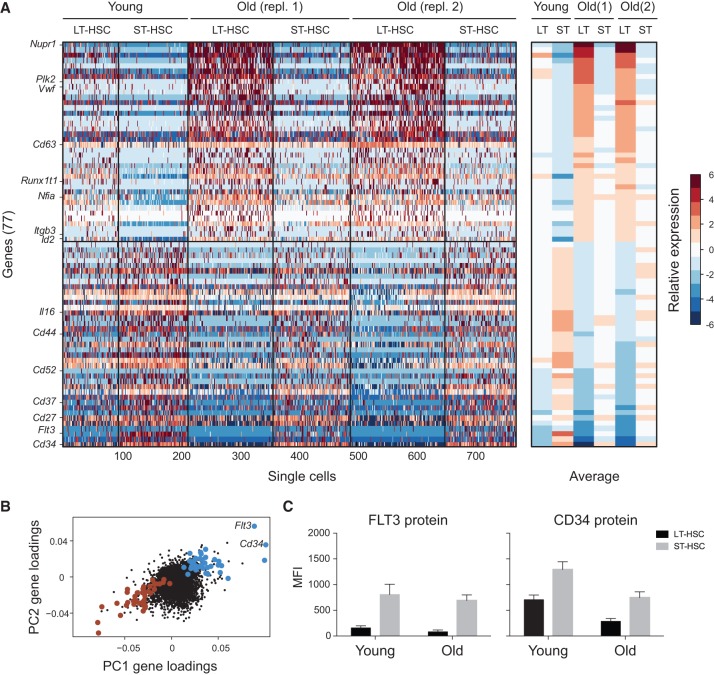
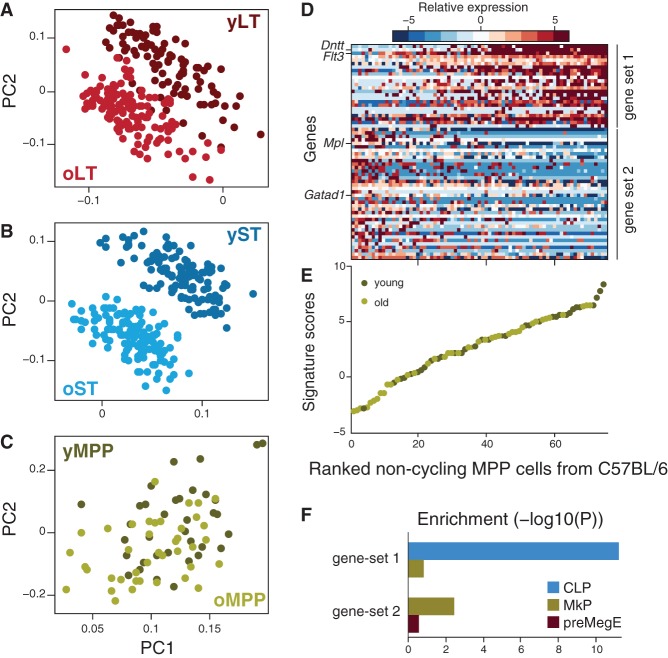
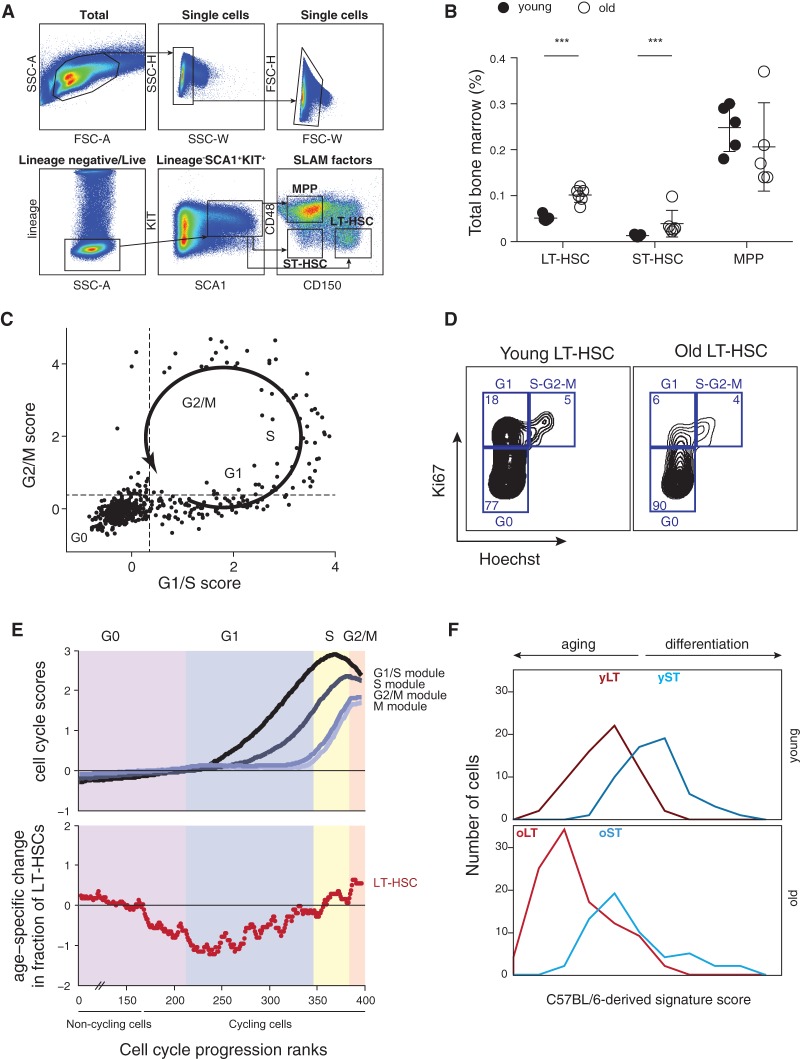
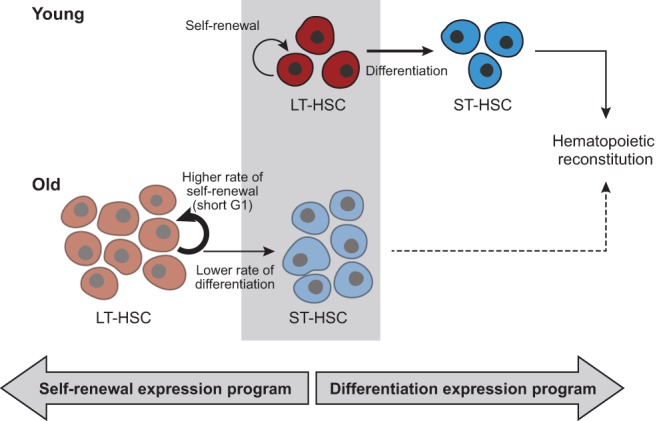
Both intrinsic cell state changes and variations in the composition of stem cell populations have been implicated as contributors to aging. We used single-cell RNA-seq to dissect variability in hematopoietic stem cell (HSC) and hematopoietic progenitor cell populations from young and old mice from two strains. We found that cell cycle dominates the variability within each population and that there is a lower frequency of cells in the G1 phase among old compared with young long-term HSCs, suggesting that they traverse through G1 faster. Moreover, transcriptional changes in HSCs during aging are inversely related to those upon HSC differentiation, such that old short-term (ST) HSCs resemble young long-term (LT-HSCs), suggesting that they exist in a less differentiated state. Our results indicate both compositional changes and intrinsic, population-wide changes with age and are consistent with a model where a relationship between cell cycle progression and self-renewal versus differentiation of HSCs is affected by aging and may contribute to the functional decline of old HSCs.


Figures

Figure 1.
Figure 1.
Single-cell RNA-seq of young and old HSCs. (A) Overview of experimental design. (B,C) Sorting strategy for isolating LT-HSCs (LSK CD48CD150+), ST-HSCs (LSK CD48CD150), and MPPs (LSK CD48+CD150) from young (B) and old (C) C57BL/6 mice. (D,E) LT-HSC compartment expands during aging. Shown are frequencies of LT-HSC, ST-HSC, and MPPs (x-axis) in young (black) and old (white) C57BL/6 mice as a percentage of bone marrow (BM; D) or stem cell compartment (lineage SCA1+KIT+, LSK; E). Statistically significant differences are as follows: (**) P < 0.01, (*) P < 0.05; n = 8–10. (F) Single-cell RNA-seq recapitulates population RNA-seq. Shown are expression levels for all genes calculated from RNA-seq of a population of young LT-HSCs (x-axis) and by averaging expression levels from approximately 200 single young LT-HSCs (y-axis). The Pearson correlation coefficient (r = 0.9) is denoted. Gray scale bar indicates gene density. (G) Heatmap of Pearson correlation coefficients (r; color bar) between pairs of RNA-seq profiles of populations (columns) and matching averaged single-cell data (rows) from C57BL/6. (H) RNA-seq coverage of known cell surface markers in representative cells from young C57BL/6 mice (plot generated by the Integrative Genome Viewer 2.3) (Robinson et al. 2011; Thorvaldsdottir et al. 2013).
Figure 2.
Figure 2.
Old LT-HSCs have a lower frequency of cells in G1 phase of the cell cycle. (A) The top eight PCs in each cell type and age. Shown is the percentage of annotated cell cycle genes (y-axis) in the top 100 genes that correlate with each of the PCs (x-axis) in each population. (B) Cell cycle analysis on mouse KIT-enriched BM cells stained with pyronin Y (y-axis) and Hoechst (x-axis), reflecting for each cell the amount of RNA and DNA, respectively. Sorting gates and cell cycle phases are indicated. (C) RNA-seq of KIT-enriched BM cells at different cell cycle phases. Shown is the average expression of G1/S genes (x-axis) and G2/M genes (y-axis) from RNA sequenced from gates in B (color-coded). (D) HSC single-cell transcriptomes can be clustered by their cell cycle status. Heatmap shows average expression of cell cycle phases gene signatures (rows) in each cell (column). The cells are partitioned into three clusters expressing the G1/S program, G2/M program, or neither. (E) Cell cycle distribution changes as a function of cell type and age. The percentage of cells in cluster 1 (G2/M, gray) and cluster 2 (G1/S, black), within each cell type, for young (x-axis) and old (y-axis) HSCs. (F) Cell cycle trajectory inferred from single-cell RNA-seq. Shown is the average expression of G1/S genes (x-axis) and G2/M genes (y-axis). The arrow and labels reflect inferred cell cycle progression. (G,H) Lower frequency of G1 cells among old LT-HSCs based on FACS analysis. (G) Shown are cell frequencies in G1 (black) and S-G2-M (gray) in cells from young (x-axis) and old (y-axis) mice based on intracellular staining with Ki67/Hoechst. (H) Representative FACS plots for young and old LT-HSCs from C57BL/6 mice. (I) The frequency of young and old LT-HSCs in S phase based on in vivo bromodeoxyuridine (BrdU) incorporation. (J) Representative BrdU FACS plots for young and old LT-HSCs from C57BL/6 mice.
Figure 3.
Figure 3.
HSC aging and differentiation are associated with opposite expression programs. A joint PCA was performed for all noncycling cells, and each of the top two PCs distinguishes cells by their cell type and age, with higher scores for young and differentiated HSCs and lower scores for old and less-differentiated cells. (AD) Each plot shows the loadings of PC1 and PC2, colored based on their cell type and age for cells from all six populations (A) or from specific pairs of populations that differ by age (B), differentiation (C), or both (D). (E) Distribution of PC1 + PC2 scores for young (top) and old (bottom) LT-HSCs and ST-HSCs. Aging is associated with a decrease in the PC1 + PC2 scores, and differentiation is associated with an increase in the PC1 + PC2 scores. (F) Colony formation assays using methylcellulose. Two hundred fifty of either young or old LT-HSCs and ST-HSCs were plated on methylcellulose (n = 5). Colonies were counted on day 10. The colony numbers are averages of duplicate measurements of each individual mouse. Statistically significant differences are as follows: (***) P < 0.001, (*) P < 0.05. (G) Distribution of the megakaryocyte progenitor (MkP) signature scores, defined as the average normalized expression of MkP-enriched genes (Sanjuan-Pla et al. 2013) (x-axis) for LT-HSC (red), ST-HSC (blue), and MPP (green) in young (top) and old (bottom) mice.
Figure 4.
Figure 4.
An inverse relationship between the transcriptional signatures of aging and differentiation. (A) A gene signature of aging and differentiation. (Left) Heatmap showing the relative expression levels of 77 genes (rows) significantly associated with aging and differentiation in all noncycling cells of LT-HSCs and ST-HSCs. Cells (columns) are sorted by age and within each age by cell type. Genes above the horizontal black bar are higher in LT-HSCs than in ST-HSCs and in old versus young cells. Genes below the horizontal black bar are higher in ST-HSCs than in LT-HSCs and in young versus old cells. (Right) The average expression of each gene (row) over all the noncycling cells from each combination of cell type and age (column). (B) Genes in the signature have correlated loadings on PC1 and PC2. Shown are the PC1 (x-axis) and PC2 (y-axis) loadings for each gene. Genes in the signature in B are marked in large points, colored in blue and red, respectively, for either high or low loadings for both PCs. (C) CD34 and FLT3 proteins are both decreased with age and increased with differentiation. Shown is the median fluorescence intensity (MFI; y-axis) of fluorescent-conjugated FLT3 (left) and CD34 (right) protein in young and old LT-HSCs (black) and ST-HSCs (gray).
Figure 5.
Figure 5.
Subsets of cells with lymphoid- and myeloid-like transcriptional bias are discernible within immunophenotypically defined MPPs in C57BL/6 mice. (AC) MPPs profiles are not distinguishable by age. PCA was performed independently for noncycling cells of each of LT-HSCs (A), ST-HSCs (B), and MPPs (C). Each plot shows the loadings of PC1 and PC2, colored based on cell type and age. Higher scores for young HSCs and lower scores for old cells are characteristic for LT-HSCs (A) and ST-HSCs (B), but not for MPPs (C). (D) Two distinct modules in MPPs. Heatmap shows the expression of genes from two distinct gene sets (rows; gene set 1 indicates lymphoid-biased; gene set 2, myeloid-biased) across all noncycling MPPs (columns). (E) Noncycling MPPs from both young and old mice form a continuous spectrum along the two states. Shown are the signature scores (average normalized expression of gene set 1 minus that of gene set 2) for each noncycling MPP from young (dark green) or old (light green) mouse. MPPs are ranked by increasing scores (x-axis). (F) Gene set enrichment analysis based on defined progenitor sets (CLP, MkP, and preMegE) within gene sets (gene set 1 and gene set 2) defining two subsets of MPPs in C57BL/6.
Figure 6.
Figure 6.
Age associated changes are conserved in DBA/2. (A) Gating strategy used to isolate LT-HSCs (LSK CD150+CD48), ST-HSCs (LSC CD150CD48), and MPPs (LSK CD150CD48+) from the BM of young (6–12 wk) DBA/2 mice. (B) LT-HSC compartment expands during aging. Shown are frequencies of LT-HSCs, ST-HSCs, and MPPs (x-axis) in young (black) and old (white) DBA/2 mice as a percentage of BM. Statistically significant differences: (***) P < 0.001. (C) Cell cycle trajectory inferred from single-cell RNA-seq. Shown is the average expression of G1/S genes (x-axis) and G2/M genes (y-axis). The arrow and labels reflect inferred cell cycle progression. (D) Representative FACS plots for Ki67/Hoechst intracellular staining in young and old LT-HSCs from DBA/2 mice. (E) Cell cycle distribution changes with age. (Top) Cells were ordered according to their inferred cell cycle progression, and the average expression of G1/S, S, and G2/M genes (y-axis, curves from dark to light gray) was calculated with a sliding window of 11 cells (x-axis). The first approximately 217 cells are “noncycling,” and only a small portion of them is depicted in the graph. The G0/G1 approximate border was defined as the first position with a positive G1/S score (i.e., above the average of all cells), and other borders were approximated by manual inspection of the figure. (Bottom) For each cell type, the log2 of the ratio between percentages of old cells divided by the percentage of young cells along the inferred cell cycle progression (with a sliding window of 100 cells) is shown. Shaded colors reflect the inferred cell cycle phases; cells are ordered by the analysis of the top panel. (F) Distribution of the C57BL/6-derived signature scores for young and old LT-HSCs and ST-HSCs, defined as the average normalized expression of young LT-HSC–enriched (dark red), old LT-HSC–enriched (light red), young ST-HSC–enriched (dark blue), and old ST-HSC–enriched (light blue) genes (x-axis), respectively.
Figure 7.
Figure 7.
A model of age-dependent changes in LT-HSCs. Young LT-HSCs (red; top) maintain an appropriate balance between efficient self-renewal (semi-circular arrow) and differentiation into ST-HSCs (horizontal arrow) that then further differentiate to reconstitute hematopoiesis. In contrast, old LT-HSCs (bottom) are inappropriately shifted toward self-renewal (thick semi-circular arrow) and thereby an accumulation of LT-HSCs (depicted by more copies of old LT-HSCs), ST-HSCs reduction (depicted by less copies of ST-HSCs), and less efficient reconstitution of hematopoiesis (dashed arrow). This can be due to either a short G1, which limits the capacity of old LT-HSCs to receive differentiation signals, or an expression program that resembles a less differentiated state and might reflect defects in differentiation, or both, as these might be causally linked.

References

    1. Abkowitz JL, Persik MT, Shelton GH, Ott RL, Kiklevich JV, Catlin SN, Guttorp P. 1995. Behavior of hematopoietic stem cells in a large animal. Proc Natl Acad Sci 92: 2031–2035. - PMC - PubMed
    1. Adolfsson J, Borge OJ, Bryder D, Theilgaard-Monch K, Astrand-Grundstrom I, Sitnicka E, Sasaki Y, Jacobsen SE. 2001. Upregulation of Flt3 expression within the bone marrow Lin−Sca1+c-kit+ stem cell compartment is accompanied by loss of self-renewal capacity. Immunity 15: 659–669. - PubMed
    1. Beerman I, Bhattacharya D, Zandi S, Sigvardsson M, Weissman IL, Bryder D, Rossi DJ. 2010. Functionally distinct hematopoietic stem cells modulate hematopoietic lineage potential during aging by a mechanism of clonal expansion. Proc Natl Acad Sci 107: 5465–5470. - PMC - PubMed
    1. Beghe C, Wilson A, Ershler WB. 2004. Prevalence and outcomes of anemia in geriatrics: a systematic review of the literature. Am J Med 116(Suppl 7A): 3S–10S. - PubMed
    1. Benveniste P, Frelin C, Janmohamed S, Barbara M, Herrington R, Hyam D, Iscove NN. 2010. Intermediate-term hematopoietic stem cells with extended but time-limited reconstitution potential. Cell Stem Cell 6: 48–58. - PubMed

Publication types

MeSH terms

Associated data