. 2015 Oct 2;350(6256):102-6.
doi: 10.1126/science.aac4690.

Aldehyde dehydrogenase 1a1 mediates a GABA synthesis pathway in midbrain dopaminergic neurons

Affiliations

Aldehyde dehydrogenase 1a1 mediates a GABA synthesis pathway in midbrain dopaminergic neurons

Jae-Ick Kim et al. Science. .

Abstract

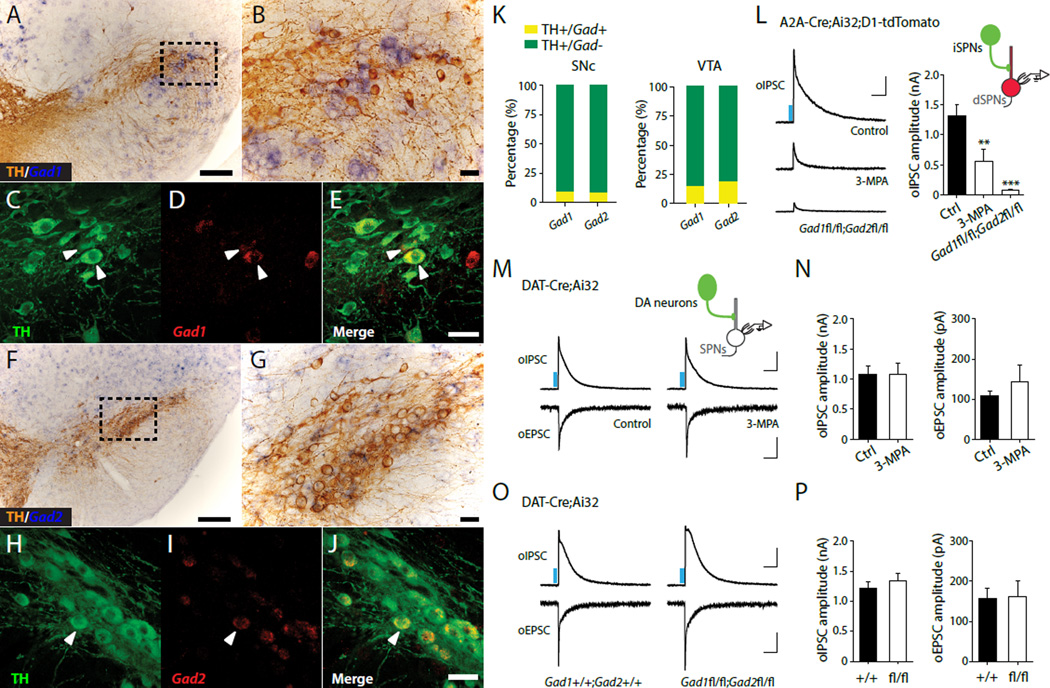
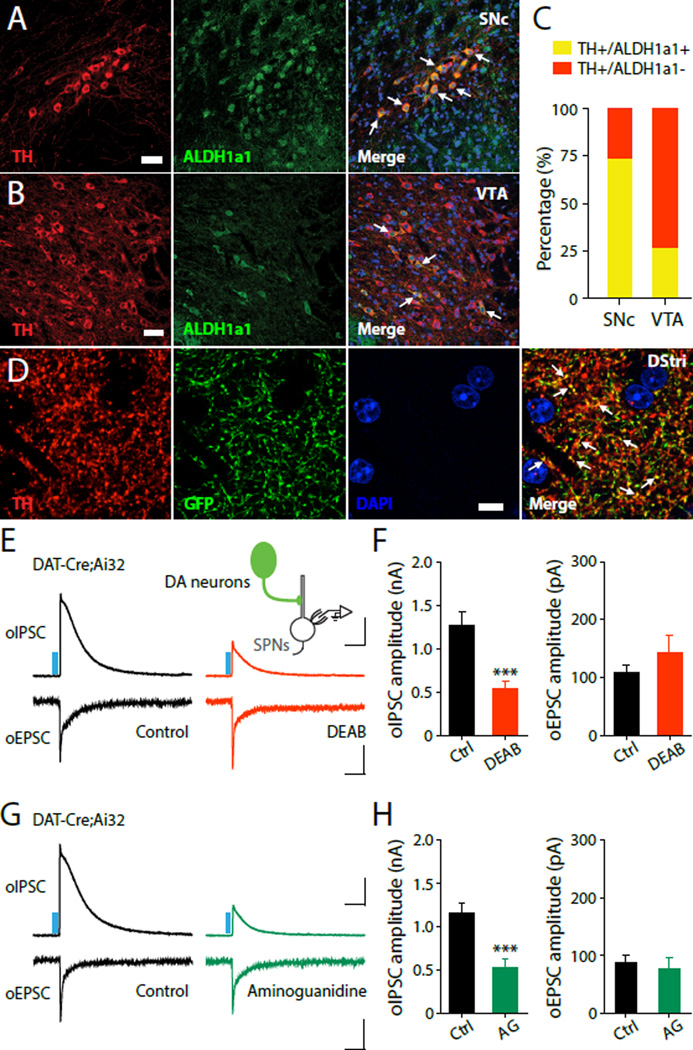
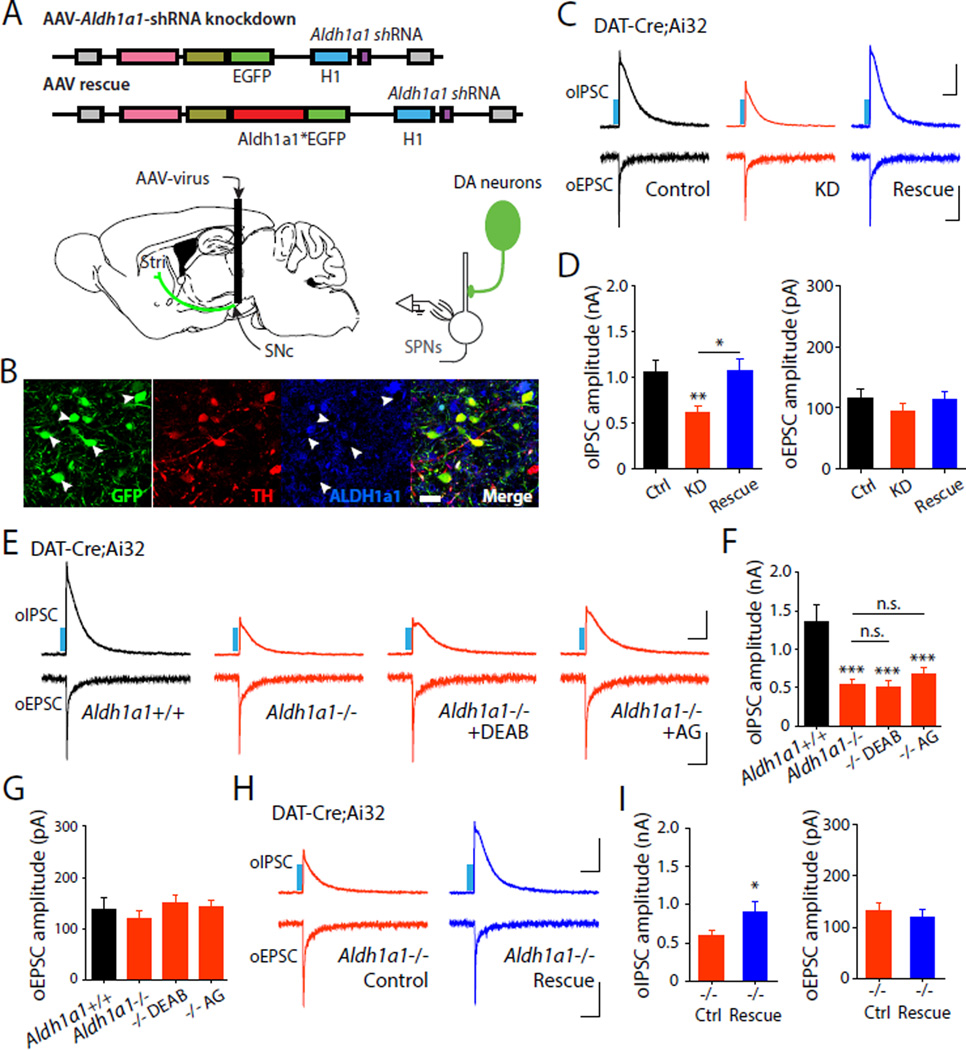
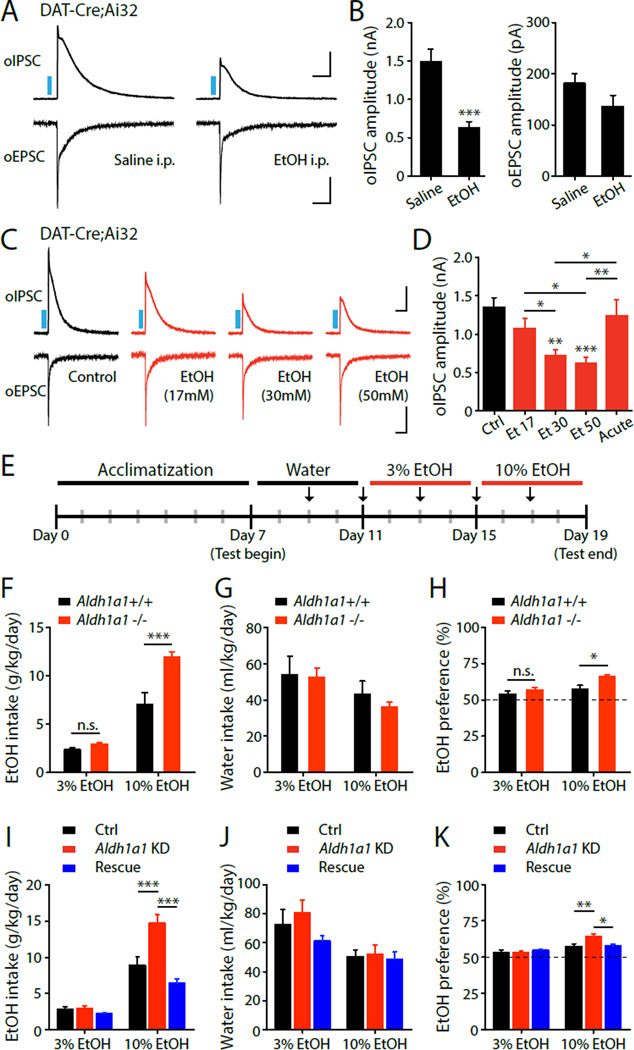
Midbrain dopamine neurons are an essential component of the basal ganglia circuitry, playing key roles in the control of fine movement and reward. Recently, it has been demonstrated that γ-aminobutyric acid (GABA), the chief inhibitory neurotransmitter, is co-released by dopamine neurons. Here, we show that GABA co-release in dopamine neurons does not use the conventional GABA-synthesizing enzymes, glutamate decarboxylases GAD65 and GAD67. Our experiments reveal an evolutionarily conserved GABA synthesis pathway mediated by aldehyde dehydrogenase 1a1 (ALDH1a1). Moreover, GABA co-release is modulated by ethanol (EtOH) at concentrations seen in blood alcohol after binge drinking, and diminished ALDH1a1 leads to enhanced alcohol consumption and preference. These findings provide insights into the functional role of GABA co-release in midbrain dopamine neurons, which may be essential for reward-based behavior and addiction.


Conflict of interest statement

The authors declare no conflicts of interest.

Figures

Fig. 1
Fig. 1. GABA co-release by midbrain DA neurons does not require GAD
(A to J) Expression of Gad1 and Gad2 mRNA in DA neurons of the SNc. Immunolabeled TH-positive dopaminergic neurons (brown) combined with chromogenic in situ hybridization (ISH) for Gad1 (A and B) and Gad2 (F and G) mRNA. Confocal fluorescence images of ISH for Gad1 (D) and Gad2 (I) mRNA (red) combined with TH immunostaining (green) (panels C-E and H-J) show limited expression of Gad in TH+ cells. (K) Quantification of TH/Gad co-localization in SNc (left) and VTA (right). (L) Left, Representative oIPSC traces in control (upper), 3-MPA-treated (500 μM, middle), and Gad1fl/fl;Gad2fl/fl (lower) A2A-Cre;Ai32;Drd1a-tdTomato mice. Right, summary statistics for oIPSC recordings. Representative traces (M) and summary statistics (N) for oIPSC and oEPSC recorded from DAT-Cre;Ai32 mice treated with ACSF (control) and 3- MPA, respectively. Representative traces (O) and summary statistics (P) for oIPSC and oEPSC recorded from DAT-Cre;Ai32;Gad1+/+;Gad2+/+ and DAT-Cre;Ai32;Gad1fl/fl;Gad2fl/fl mice. Blue bar indicates 450 nm light stimulation. Scale bars: 200 μm for A,F, 50 μm for B-E, G-J, 400 pA, 100 ms for oIPSC and 50 pA, 100 ms for oEPSC. Error bars indicate Mean ± SEM. **P < 0.01, ***P < 0.001.
Fig. 2
Fig. 2. ALDH1a1-mediated non-canonical GABA synthesis in DA neurons
(A and B) Confocal images depicting double immunostaining for TH (left, red) and ALDH1a1 (middle, green) in SNc (A) and VTA (B). Scale bar: 40 μm. (C) Quantification of ALDH1a1 expression in TH+ DA neurons in SNc and VTA. (D) Confocal images depicting double immunostaining for TH (red), ALDH1a1–GFP (green), and DAPI (blue) in the dorsal striatum (DStri). Scale bar: 10µm. Representative oIPSC and oEPSC traces (E) and summary statistics (F) recorded from DAT-Cre;Ai32 mice treated with ACSF (control, left) and DEAB (10 µM, right). Representative oIPSC and oEPSC traces (G) and summary statistics (H) recorded from DAT-Cre;Ai32 mice treated with ACSF (control, left) and aminoguanidine (AG, 100 µM, right). Blue bar indicates 450 nm light stimulation. Scale bars: 400 pA, 100 ms for oIPSC and 50 pA, 100 ms for oEPSC. Error bars indicate Mean ± SEM. ***P < 0.001.
Fig. 3
Fig. 3. Aldh1a1 knockdown and genetic deletion reduce dopaminergic oIPSCs and are rescued by Aldh1a1 over-expression
(A) Schematic illustration depicting viral shRNA constructs (Aldh1a1* indicates an shRNA-resistant wild-type Aldh1a1) and experimental configuration. (B) Confocal image showing expression of shRNA (green) in TH+ (red) neurons. Arrowheads indicate absence of ALDH1a1 (blue) in GFP+/TH+ neurons. Scale bar: 20 µm. Representative oIPSC and oEPSC traces (C) and summary statistics (D) in DAT-Cre;Ai32 mice injected with Aldh1a1 knockdown and rescue viruses. Representative oIPSC and oEPSC traces (E) and summary statistics for oIPSC (F) and oEPSC (G) in Aldh1a1+/+;DAT-Cre;Ai32 or Aldh1a1−/−;DAT-Cre;Ai32 mice, or loss of function mice treated with DEAB (10 µM), and aminoguanidine (100 µM). Representative oIPSC and oEPSC traces (H) and summary statistics (I) recorded from Aldh1a1−/−;DAT-Cre;Ai32 mice injected with control and rescue viruses. Blue bar indicates 450 nm light stimulation. Scale bars: 400 pA, 100 ms for oIPSC and 50 pA, 100 ms for oEPSC. Error bars indicate Mean ± SEM. *P < 0.05, **P < 0.01, ***P < 0.001.
Fig. 4
Fig. 4. Altered GABA co-release in conditions related to alcohol binge drinking
Representative oIPSC and oEPSC traces (A) and summary statistics (B) in DAT-Cre;Ai32 mice in control or following repeated in vivo administration of EtOH. Representative oIPSC and oEPSC traces (C) and summary statistics (D) in DAT-Cre;Ai32 mice in control, or treated with EtOH (17–50 mM). (E) Shematic illustration depicting the timeline of the two-bottle choice behavioral assay. (F) Quantification of average daily EtOH intake, (G) average daily water intake, and (H) average EtOH preference. (I) Quantification of average daily EtOH intake in Aldh1a1 KD or overespression mice. (J) average daily water intake. (K) average EtOH preference. Blue bar indicates 450 nm light stimulation. Scale bars: 400 pA, 100 ms for oIPSC and 50 pA, 100 ms for oEPSC. Error bars indicate Mean ± SEM. *P < 0.05, **P < 0.01, ***P < 0.001.

References

    1. Schultz W. Multiple dopamine functions at different time courses. Annual review of neuroscience. 2007;30:259. - PubMed
    1. Tritsch NX, Sabatini BL. Dopaminergic modulation of synaptic transmission in cortex and striatum. Neuron. 2012 Oct 4;76:33. - PMC - PubMed
    1. Chen BT, Hopf FW, Bonci A. Synaptic plasticity in the mesolimbic system: therapeutic implications for substance abuse. Annals of the New York Academy of Sciences. 2010 Feb;1187:129. - PMC - PubMed
    1. Redgrave P, et al. Goal-directed and habitual control in the basal ganglia: implications for Parkinson's disease. Nature reviews. Neuroscience. 2010 Nov;11:760. - PMC - PubMed
    1. Tritsch NX, Ding JB, Sabatini BL. Dopaminergic neurons inhibit striatal output through non-canonical release of GABA. Nature. 2012 Oct 11;490:262. - PMC - PubMed

Publication types

MeSH terms