. 2015 Oct;25(10):1521-35.
doi: 10.1101/gr.187823.114.

Signatures of post-zygotic structural genetic aberrations in the cells of histologically normal breast tissue that can predispose to sporadic breast cancer

Affiliations

Signatures of post-zygotic structural genetic aberrations in the cells of histologically normal breast tissue that can predispose to sporadic breast cancer

Lars A Forsberg et al. Genome Res. 2015 Oct.

Abstract

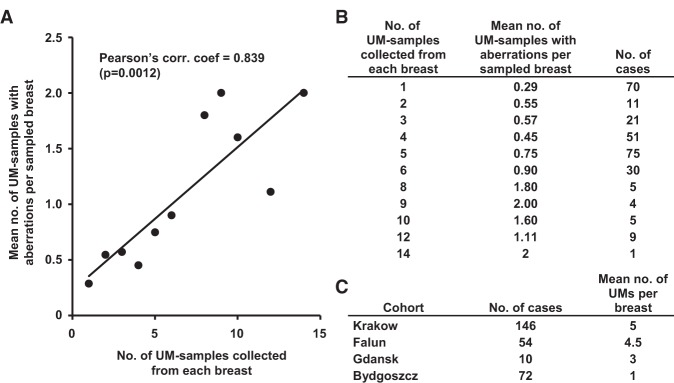
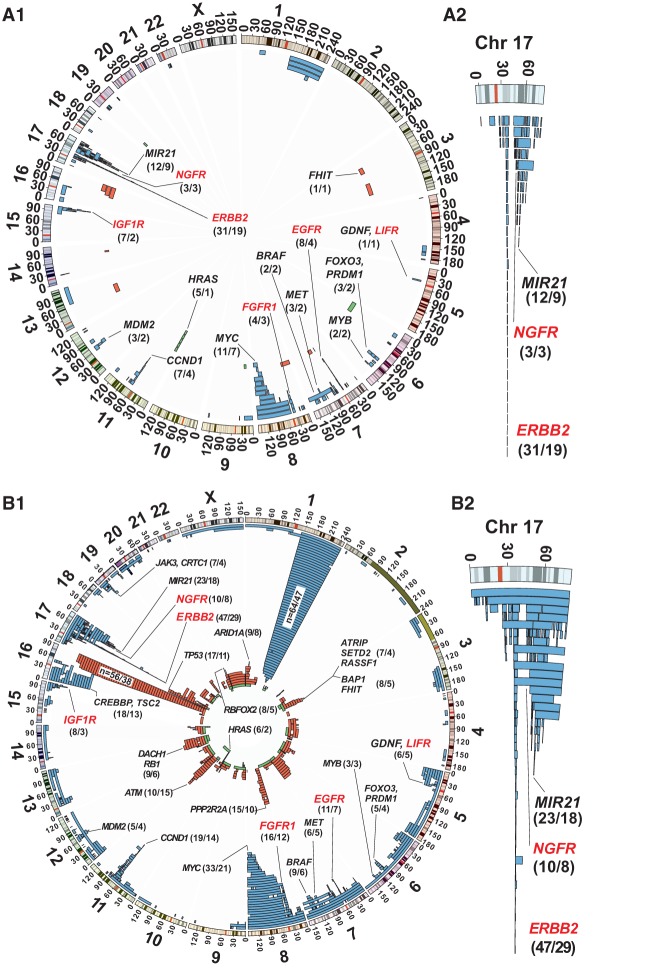
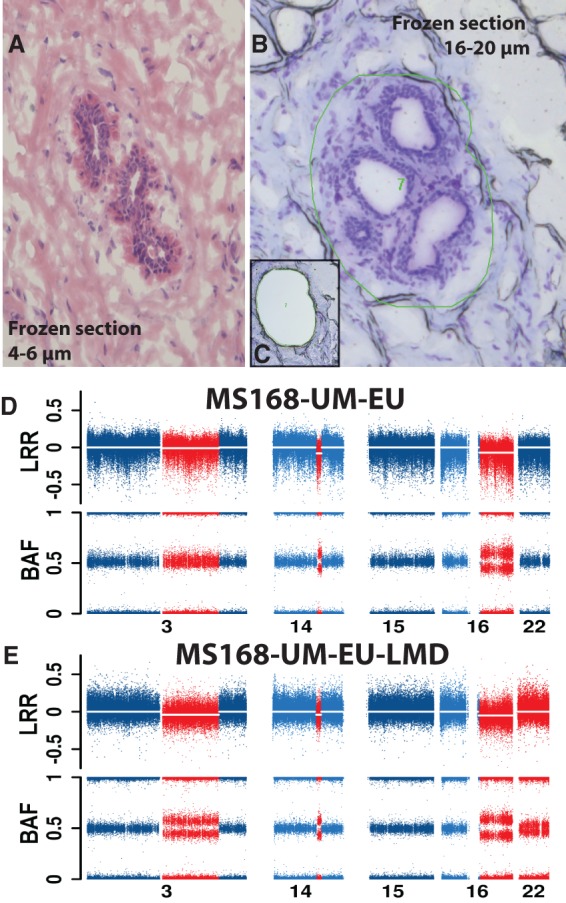
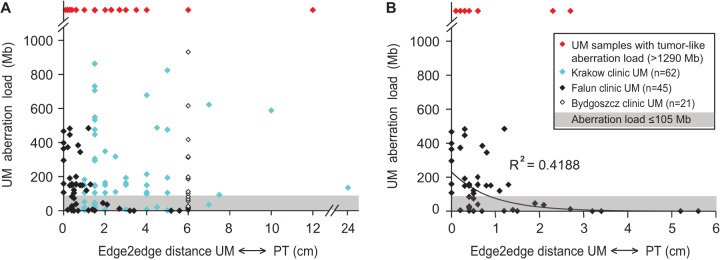
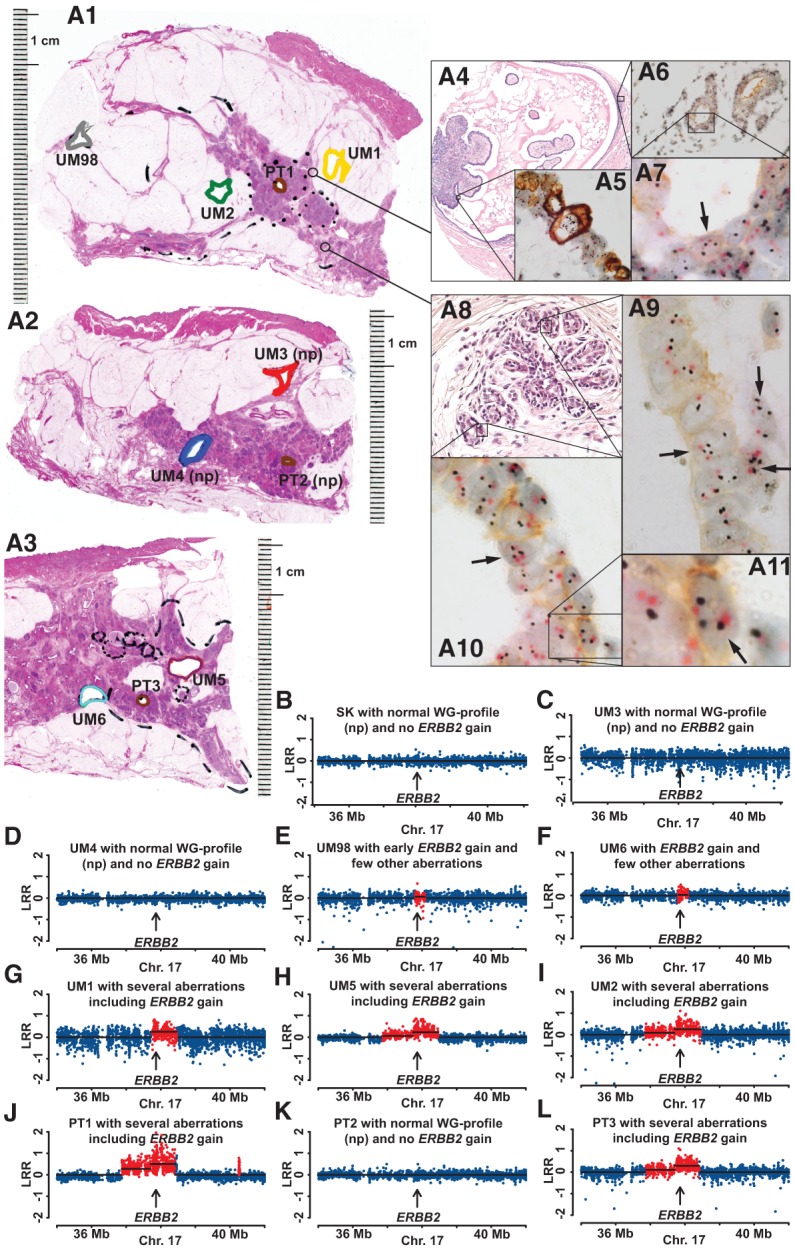
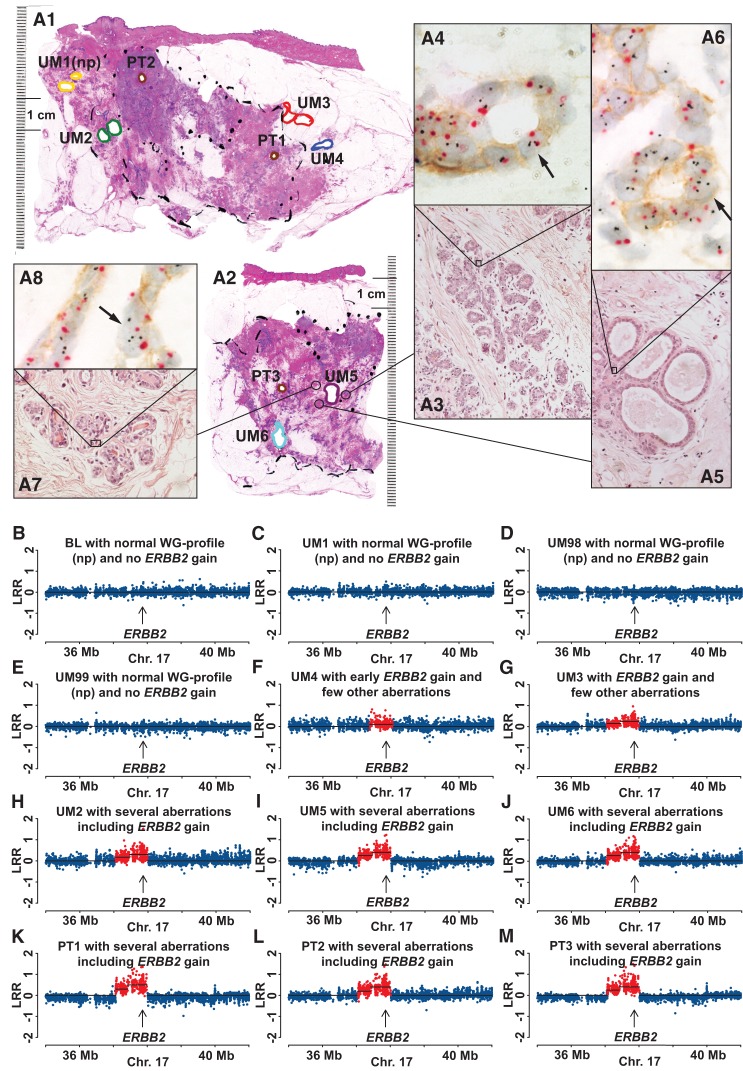
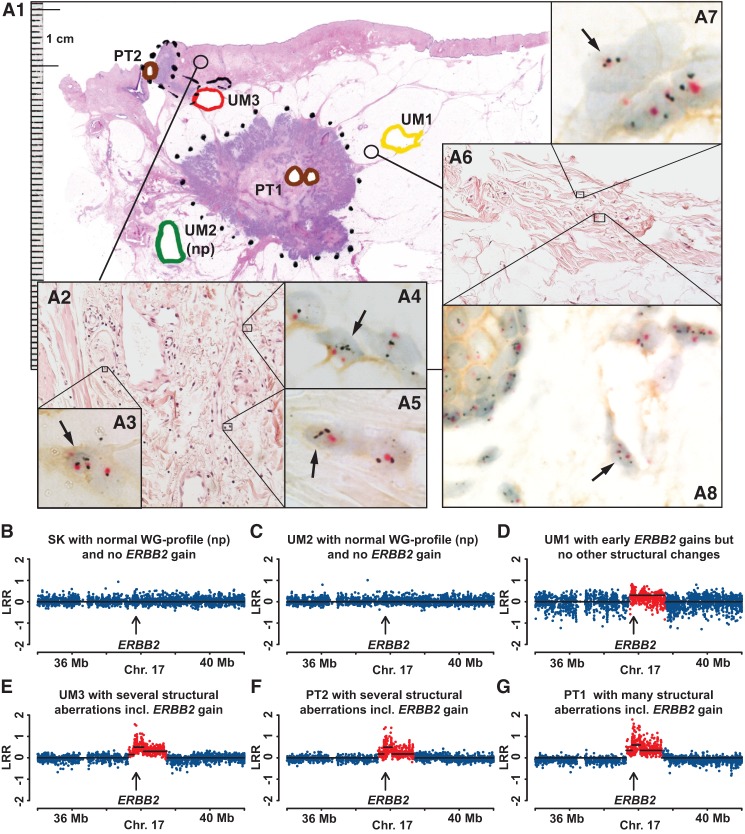
Sporadic breast cancer (SBC) is a common disease without robust means of early risk prediction in the population. We studied 282 females with SBC, focusing on copy number aberrations in cancer-free breast tissue (uninvolved margin, UM) outside the primary tumor (PT). In total, 1162 UMs (1-14 per breast) were studied. Comparative analysis between UM(s), PT(s), and blood/skin from the same patient as a control is the core of the study design. We identified 108 patients with at least one aberrant UM, representing 38.3% of cases. Gains in gene copy number were the principal type of mutations in microscopically normal breast cells, suggesting that oncogenic activation of genes via increased gene copy number is a predominant mechanism for initiation of SBC pathogenesis. The gain of ERBB2, with overexpression of HER2 protein, was the most common aberration in normal cells. Five additional growth factor receptor genes (EGFR, FGFR1, IGF1R, LIFR, and NGFR) also showed recurrent gains, and these were occasionally present in combination with the gain of ERBB2. All the aberrations found in the normal breast cells were previously described in cancer literature, suggesting their causative, driving role in pathogenesis of SBC. We demonstrate that analysis of normal cells from cancer patients leads to identification of signatures that may increase risk of SBC and our results could influence the choice of surgical intervention to remove all predisposing cells. Early detection of copy number gains suggesting a predisposition toward cancer development, long before detectable tumors are formed, is a key to the anticipated shift into a preventive paradigm of personalized medicine for breast cancer.


Figures

Figure 1.
Figure 1.
A larger number of UM samples studied per breast increases the likelihood of finding genetically aberrant UM tissue. (A) The number of UMs sampled per patient is positively correlated with the mean number of UMs displaying an aberrant genetic profile among all 282 studied cases of breast cancer. (B) Table showing the number of cases that were used for the plot in A and that were the basis for calculation of the correlation coefficient. (C) Table showing the number of cases and the mean number of UMs that were studied from each of the four participating oncology centers.
Figure 2.
Figure 2.
Position and frequency of post-zygotic copy number aberrations in UM samples from 282 breast cancer patients included in the study. (A1,B1) Genome-wide view of aberrations stratified by size; <105 Mb of total size and up to 1288 Mb for all size-scored aberrations, respectively. (A2,B2) An enlarged view of complex 17q amplicons, targeting ERBB2, NGFR, and MIR21, among other genes, which are also displayed in A1 and B1. Three types of aberrations were detected using whole-genome Illumina SNP-array genotyping, such as gains (blue), deletions (red), CNNLOH/UPD (green), and are displayed using Circos plots (Krzywinski et al. 2009). Recurrent mutations including previously known cancer genes are specified by name. The numbers in parentheses after the gene names indicate the number of UM specimens and the number of cases, respectively, showing variation in each of the recurrent loci. A1 shows the 235 structural aberrations scored in 80 UM samples collected from 50 subjects. This plot displays early aberrations, which are detected in normal UM cells, with a maximum total size of aberrations of <105 Mb. Six genes coding for cell-surface receptors showing recurrent copy number gains are highlighted in red. In B1, a less strict cut-off size limit was used as compared to A1, and 904 size-scored aberrations detected in 156 UM samples collected from 93 cases are plotted. The highly recurrent regions are all-encompassing loci previously described to be of importance in breast cancer (Table 1).
Figure 3.
Figure 3.
Laser-microdissection (LMD) validation of three deletions on Chromosome 3, 14, and 16 in normal cells from sample MS168-UM-EU. (A) A representative image of normal breast parenchyma (hematoxylin and eosin staining) in thin frozen section from specimen MS168-UM-EU, with a normal duct. (B,C) Images before and after the normal structures have been dissected by laser and collected. The thick frozen sections (16–20 µm) in B and C have been stained with cresyl violet. The green irregular circle in B shows the area marked for dissection by laser. (D,E) Genetic copy number profiles of chromosomes with aberrations (in red) and without (in blue) from SNP arrays. The profile in D has been produced using the bulk DNA derived from all cells in sample MS168-UM-EU, while the profile in E is derived from DNA isolated from microdissected cells. Sample MS168-UM-EU shows deletions present in ∼5%–15% of cells, as indicated by the BAF values deviating from the value of 0.5. The corresponding number of cells affected by deletions in sample MS168-UM-EU-LMD is higher, suggesting an enrichment of cells with aberrations. The combined load of deletions on Chromosomes 3, 14, and 16 in the sample MS168-UM-EU is 92.8 Mb. Interestingly, the microdissected sample MS168-UM-EU-LMD contains also a low proportion of cells (∼5%–10%) with a copy number neutral loss of heterozygozity (CNNLOH) of whole Chromosome 22, which was not detectable in the bulk DNA derived from all cells in sample MS168-UM-EU.
Figure 4.
Figure 4.
The total aberration load of UM samples in relation to the distances between UMs and PTs. The “edge2edge” distance was measured as the shortest distance between the borders of the PT and UM samples. For patients with multifocal disease, the distance was measured to the closest primary tumor. In A, combined data from three clinics (Krakow, Falun, and Bydgoszcz) are shown. (B) Falun cases only. The shaded area in both plots illustrates the 105-Mb threshold as defined by our comparative genetic and histological analysis that is described in the text. In our material, no UM samples with an aberration load below the 105-Mb threshold showed any atypical/cancer-like features upon microscopic inspection. Red diamonds highlight UMs in which the total aberration load (i.e., >1288 Mb) was indicative of tumor content in these samples, as explained in the text. The symbols for samples derived from each of the clinics are explained in the box in B. The distances for the Falun cases were measured in a microscope using a large-scale histology format, allowing high precision of measurements, i.e., below 1 mm accuracy. The distances for the other two clinics were measured with a ruler upon dissection of the breast by a pathologist and are less precise. In six instances of UM samples from the Falun clinic, the microscopic investigation of large-format histology preparations resulted in detection of tumor/atypical cells in the area where UM samples were taken, and these UMs are plotted at zero distance from the primary tumor. The trend line was introduced for Falun cases with an R2 value of the correlation coefficient. The UM samples from the Bydgoszcz clinic were collected at a 4- to 8-cm distance from PTs and we used the average distance in this plot, as reflected by the cluster of measurements at the 6-cm distance in A. The plotted data can be found in Supplemental Table 2.
Figure 5.
Figure 5.
Comprehensive study of pathology and genetics for case MN036, showing increased copy number and expression of the ERBB2 gene in normal epithelial cells. (A1,A2,A3) Three large-format histology slides taken at different levels of the mastectomy specimen stained with hematoxylin and eosin, with diagnosis of multifocal invasive ductal carcinoma (Luminal B, HER2+). Areas of tissue samples taken for DNA extraction, prior to formalin fixation of the tissue, are marked with colored thick lines. Positions of three primary tumors 1, 2, and 3 (PT1, PT2, and PT3) are shown in brown. In A1, UM1, UM2, and UM98 are labeled in yellow, green, and gray, respectively. In A2, UM3 and UM4 are labeled in red and blue, respectively. In A3, UM5 and UM6 are labeled in purple and light blue, respectively. (np) Normal genetic profiles (see also below, BL). Two cores from paraffin-embedded tissue (thin-lined black circles) from A1 were taken for separate analysis using the HER2 tricolor Dual ISH DNA Probe Cocktail Assay (Roche) and the results are shown in A4A11. (A4) A papillary structure lined partly by cancer cells and partly by histologically normal epithelium. High-magnification image in A5 shows tumor cells with very strong overexpression of HER2 protein containing up to 20 copies of ERBB2 (black dots). (A6,A7) Histological images of normal breast tissue. Black arrows in A7, A9A11 point to single nuclei of normal epithelial cells containing more than two copies of ERBB2 (black dots). The centromere of Chromosome 17 is stained in red. A weak but clearly discernible immunohistochemical staining of HER2 protein is visible in the cell membrane of normal epithelial cells upon high magnification. (BL) A segment of Chromosome 17 containing ERBB2 in 11 samples from Illumina global genome analysis. Skin (SK, normal control tissue), UM3, UM4, and PT2 show no evidence of gain of ERBB2. The remaining seven samples were scored as containing increased copy numbers (red dots) for ERBB2. Note that sample UM98, located at a distance of >4 cm from the PT1 sample, also shows evidence for cells containing an increased number of copies of ERBB2. The total size of aberrations in UM samples is as follows: UM6, 0.4 Mb; UM98, 0.4 Mb; UM1, 0.8 Mb; UM2, 27.7 Mb; UM5, 36.5 Mb.
Figure 6.
Figure 6.
Multimodal examination of pathology, gene copy number, and gene expression for case AW020, with evidence of increased copy number and expression of ERBB2 in normal epithelial cells. (A1,A2) Two section levels of large-format histology slides of breast tissue stained with hematoxylin and eosin, with diagnosis of multifocal invasive ductal carcinoma (Luminal B, HER2+). Areas of tissue samples taken for DNA extraction, prior to formalin fixation of the tissue, are marked with colored thick lines. Positions of three primary tumors 1, 2, and 3 (PT1, PT2, and PT3) are shown in brown. In A1, UM1, UM2, UM3, and UM4 are labeled in yellow, green, red, and blue, respectively. In A2, UM5 and UM6 are labeled in purple and light blue, respectively. (np) Normal genetic profiles (see also below, BM). Three cores from paraffin-embedded tissue (thin-lined black circles) surrounding sample UM5 were taken for separate analysis using the HER2 tricolor Dual ISH DNA Probe Cocktail Assay (Roche) and the results are shown in A3A8. (A3,A5,A7) Histological images of normal breast tissue with cross-sections through terminal ductal lobular units (TDLUs). Black arrows in A4, A6, and A8 point to single nuclei of normal epithelial cells containing more than two copies of ERBB2 (black dots). The centromere of Chromosome 17 is stained in red. Note a weak but clearly discernible immunohistochemical staining of HER2 protein in the cell membrane of normal epithelial cells upon high magnification. (BM) A segment of Chromosome 17 containing ERBB2 in 12 samples from Illumina global genome analysis. Blood (BL, normal control tissue), UM1, UM98, and UM99 samples have normal profiles (np) with no gain of ERBB2. The remaining eight samples were scored as containing an increased copy number (red dots) for ERBB2. The samples UM98 and UM99 are taken from parts of breast tissue as far away as possible from the segment (lobe) affected by breast cancer and are not visualized in A1 and A2. The total size of aberrations in UM samples is as follows: UM4, 0.7 Mb; UM3, 7.4 Mb; UM2, 191 Mb; UM5, >39% of the genome; UM6, >39% of the genome.
Figure 7.
Figure 7.
Comprehensive analysis of pathology, gene copy number, and gene expression for case MA018, showing evidence for increased copy number and expression of ERBB2 in normal epithelial as well as in normal mesenchymal cells. (A1) A large-format histology slide of breast tissue stained with hematoxylin and eosin, with diagnosis of multifocal invasive ductal carcinoma (HER2+, non-luminal). Areas of tissue samples taken for DNA extraction, prior to formalin fixation of the tissue, are marked with colored thick lines. Positions of two primary tumors 1 and 2 (PT1 and PT2) are shown in brown. UM1, UM2, and UM3 are labeled in yellow, green, and red, respectively. (np) Normal genetic profiles (see also below, BG). Two cores from paraffin-embedded breast tissue (thin-lined black circles) surrounding samples UM1 and UM3 were taken for separate analysis using the HER2 tricolor Dual ISH DNA Probe Cocktail Assay (Roche) and the results are shown in A2A8. Black arrows point to single nuclei of normal mesenchymal stromal cells and epithelial cells containing more than two copies of ERBB2 (black dots). The centromere of Chromosome 17 is stained in red. Note a weak but clearly discernible immunohistochemical staining of HER2 protein in the cell membrane of normal mesenchymal and epithelial cells upon high magnification. (BG) A segment of Chromosome 17 containing ERBB2 from six samples from Illumina global genome analysis. Skin (SK, normal control tissue) and UM2 samples have normal profiles (np) with no gain of ERBB2. The remaining four samples were scored as containing an increased copy number (red dots) for ERBB2. The total size of aberrations in UM samples is as follows: UM98, 0.7 Mb (not shown in this figure); UM1, 0.9 Mb; UM3, >39% of the genome.

References

    1. Aaltonen KE, Ebbesson A, Wigerup C, Hedenfalk I. 2011. Laser capture microdissection (LCM) and whole genome amplification (WGA) of DNA from normal breast tissue—optimization for genome wide array analyses. BMC Res Notes 4: 69. - PMC - PubMed
    1. Bista RK, Wang P, Bhargava R, Uttam S, Hartman DJ, Brand RE, Liu Y. 2012. Nuclear nano-morphology markers of histologically normal cells detect the “field effect” of breast cancer. Breast Cancer Res Treat 135: 115–124. - PMC - PubMed
    1. Boeva V, Popova T, Bleakley K, Chiche P, Cappo J, Schleiermacher G, Janoueix-Lerosey I, Delattre O, Barillot E. 2012. Control-FREEC: a tool for assessing copy number and allelic content using next-generation sequencing data. Bioinformatics 28: 423–425. - PMC - PubMed
    1. The Cancer Genome Atlas. 2012. Comprehensive molecular portraits of human breast tumours. Nature 490: 61–70. - PMC - PubMed
    1. Conlin LK, Thiel BD, Bonnemann CG, Medne L, Ernst LM, Zackai EH, Deardorff MA, Krantz ID, Hakonarson H, Spinner NB. 2010. Mechanisms of mosaicism, chimerism and uniparental disomy identified by SNP array analysis. Hum Mol Genet 19: 1263–1275. - PMC - PubMed

Publication types

Associated data