. 2015 Aug 26;1(2):152-162.
doi: 10.1016/j.cels.2015.08.003.

Transcription Factor Activity Mapping of a Tissue-Specific in vivo Gene Regulatory Network

Affiliations

Transcription Factor Activity Mapping of a Tissue-Specific in vivo Gene Regulatory Network

Lesley T MacNeil et al. Cell Syst. .

Abstract

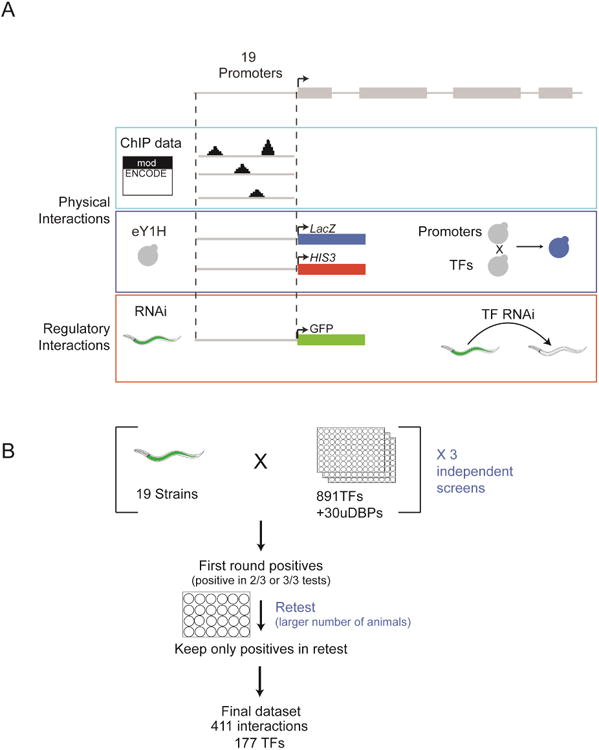
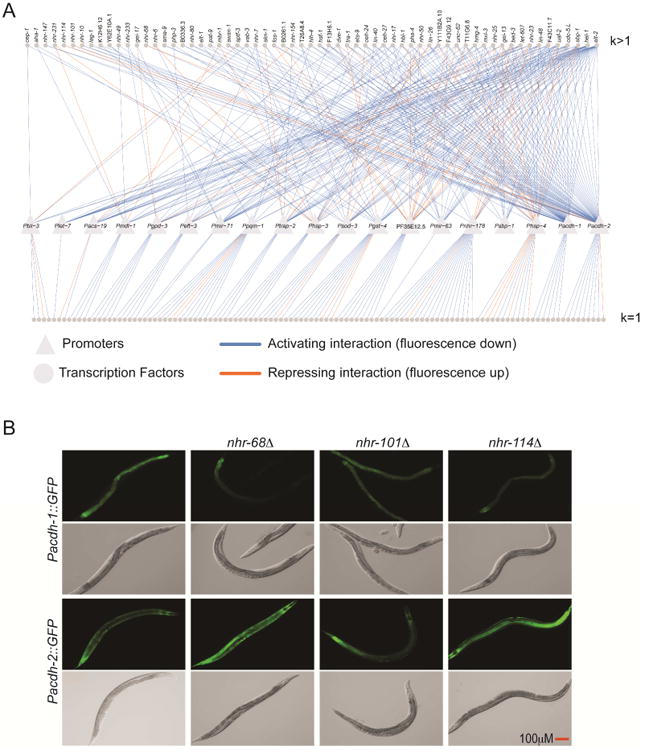
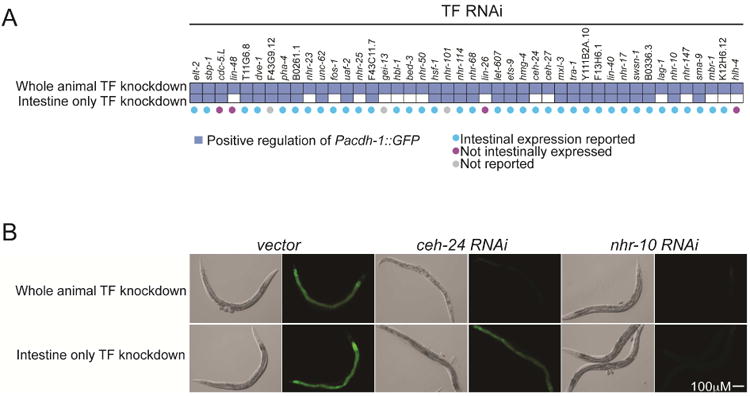
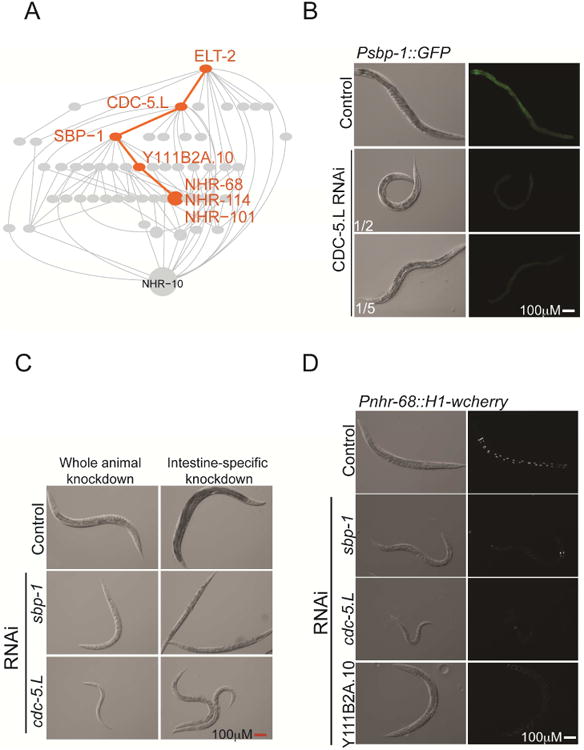
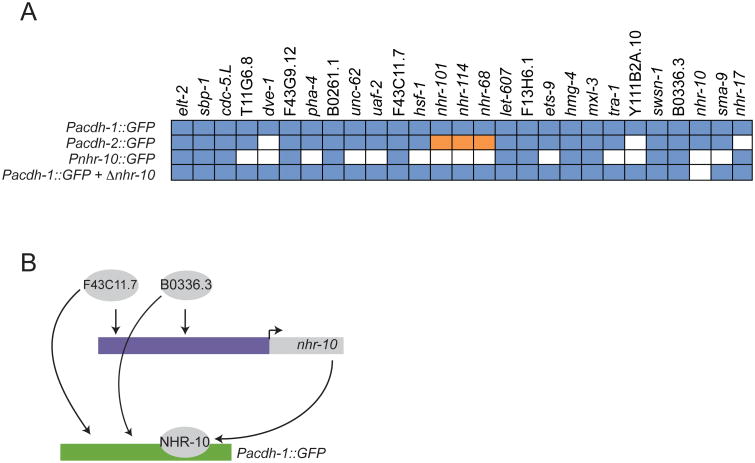
A wealth of physical interaction data between transcription factors (TFs) and DNA has been generated, but these interactions often do not have apparent regulatory consequences. Thus, equating physical interaction data with gene regulatory networks (GRNs) is problematic. Here, we comprehensively assay TF activity, rather than binding, to construct a network of gene regulatory interactions in the C. elegans intestine. By manually observing the in vivo tissue-specific knockdown of 921 TFs on a panel of 19 fluorescent transcriptional reporters, we identified a GRN of 411 interactions between 19 promoters and 177 TFs. This GRN shows only modest overlap with physical interactions, indicating that many regulatory interactions are indirect. We applied nested effects modeling to uncover information flow between TFs in the intestine that converges on a small set of physical TF-promoter interactions. We found numerous cell nonautonomous regulatory interactions, illustrating tissue-to-tissue communication. Altogether, our study illuminates the complexity of gene regulation in the context of a living animal.


Figures

Figure 1
Figure 1. Study Design
(A) 19 genes were selected for interaction mapping. The same promoters were used to identify regulatory and physical interactions. Physical interactions were curated from ModEncode data and obtained by eY1H screening. Regulatory interactions were obtained using fluorescent transcriptional reporters and knocking down individual TFs by RNAi followed by examining changes in fluorescent reporter protein levels in the intestine. (B) Outline of RNAi screen. Each screen was performed in triplicate. Interactions that were recovered in at least 2 out of 3 screens were retested with a larger number of animals. See also Figure S1.
Figure 2
Figure 2. A TF-Activity-Based C. elegans GRN
(A) GRN depicting regulatory interactions identified by TF RNAi. Triangles indicate the 19 target promoters. Circles indicate the TFs regulating these promoters in the intestine. k indicates the out-degree, or the number of promoters regulated by each TF in the intestine. Blue edges are activating interactions (intestinal GFP down upon TF RNAi) and orange edges are repressive interactions (intestinal GFP up upon TF RNAi). TFs regulating a single target gene (bottom row) are not labeled. (B) Validation of regulatory interactions. Changes in GFP expression in Pacdh-1∷GFP and Pacdh-2∷GFP animals following knockdown of a family of closely related NHRs was validated by crossing nhr-68, nhr-101 or nhr-114 deletion mutations into Pacdh-1∷GFP or Pacdh-2∷GFP strains. Based on the RNAi screen, we expected loss-of-function mutations in each of the three TFs to decrease GFP expression driven by Pacdh-1 and increase expression driven by Pacdh-2, in the intestine.
Figure 3
Figure 3. Identifying Cell-Autonomous Regulatory Interactions
(A) Matrix indicates effects of whole animal (top row) and intestine-specific knockdown (bottom row) on GFP expression in Pacdh-1∷GFP transgenic animals. Reported expression of TFs knocked down is indicated below matrix. ‘Not reported’ indicates that TF expression was not reported in large-scale intestine-specific expression profiling and a transcriptional reporter for TF expression has not been described. (B) GFP expression in Pacdh-1∷GFP animals is shown following knockdown of the indicated TFs (vector indicates negative control) either in the whole animal (top row) or by intestine-specific knockdown (bottom row). As an example, nhr-10 RNAi effects are cell autonomous, whereas ceh-24 RNAi affects Pacdh-1∷GFP through a non-cell autonomous mechanism. Matching differential interference contrast (DIC) images are shown to the left of fluorescent images.
Figure 4
Figure 4. A Hierarchical TF Model of Information Flow in the C. elegans intestine
(A) Overlap between regulatory and physical interactions. Green indicates TFpromoter interactions that are both physical and regulatory. Physical interactions were obtained from Y1H screens performed here and reported elsewhere and from ChIP experiments from the modENCODE project. Top bars represent overlap in all tested interactions. Bottom bars represent interactions involving only TFs that produced positive interactions in both assays. P-values (hypergeometric) are shown. (B) Cartoon depicting the principle of nested effects modeling followed by transitive reduction. Example interaction data is shown with the resulting predicted model. Note that the model includes only TFs and not the target genes. Targets of TF3 are nested within the targets of TF2, whose targets are in turn nested within the targets of TF1, resulting in the model shown. (C) Hierarchical TF model generated by nested effects modeling using regulatory interactions identified by RNAi. Larger nodes represent super-nodes that include more than one TF. (D) Removal of all regulatory interactions involving any individual promoter does not greatly affect the hierarchical TF model. Interactions recovered for each individual target were removed and the hierarchical TF model was recalculated by nested effects modeling. The fraction of edges maintained in these models, relative to the complete model is shown. (E) TF pairs connected by an edge in the hierarchical TF model exhibit greater co-expression across a large panel of expression profiling experiments than unconnected TF pairs (p<0.003, rank-sum test). See also Figure S2. (F) Fraction of TFs in leaves or central nodes (non-leaves) in network displaying lethal phenotypes.
Figure 5
Figure 5. Validation of the Hierarchical TF Model
(A) A path (highlighted in orange) in the predicted hierarchical TF model (grey) was selected for validation. (B) CDC-5.L activates the sbp-1 promoter. Fractions indicate dilution of bacteria producing double stranded cdc-5.L RNA with bacteria producing vector alone (to circumvent lethality). DIC images are shown to the left of fluorescent images. (C) Systemic knockdown of cdc-5.L causes dramatic effects on growth and development (left) whereas intestine-specific cdc-5.L knockdown results in a less severe phenotype that phenocopies sbp-1, consistent with cdc-5.L functioning in the intestine to regulate SBP-1 but also playing roles outside of the intestine. (D) Knockdown of TFs in a Pnhr-68 reporter strain that expresses nuclear cherry fluorescent protein. Matching DIC photos are shown to the left of fluorescent images.
Figure 6
Figure 6. NHR-10 is Involved in Feed-Forward Loops
(A) Matrix indicating the TFs that regulate acdh-1, acdh-2 and nhr-10 promoters. Regulation of Pacdh-1∷GFP in the absence of NHR-10 is shown at the bottom. (B) Examples of feedforward loops involving NHR-10. See also Figure S3.
Figure 7
Figure 7. Integrating Regulatory and Physical interactions
(A) Cartoon depicting a hypothetical cellular pathway (left), the regulatory interactions it would confer (middle), and the resulting predicted hierarchy with terminal nodes (right). (B) Paths leading to physical interactions displayed by promoter. Only promoters for which we identified interactions that were both physical and regulatory in the Intestinal Hierarchical TF model are shown. Color indicates target gene, colored lines indicate regulatory paths in the model that include TFs that physically interact with the target promoter. All TFs connected by a colored line act as regulators of the indicated (by color) target genes. TFs that represent the last node in a regulatory path to the target gene (terminal nodes) are boxed. Not all paths leading to the NHR-10 super-node are colored for visual clarity (some red and orange lines have been removed).

References

    1. Araya CL, Kawli T, Kundaje A, Jiang L, Wu B, Vafeados D, Terrell R, Weissdepp P, Gevirtzman L, Mace D, et al. Regulatory analysis of the C. elegans genome with spatiotemporal resolution. Nature. 2014;512:400–405. - PMC - PubMed
    1. Arda HE, Taubert S, Conine C, Tsuda B, Van Gilst MR, Sequerra R, Doucette-Stam L, Yamamoto KR, Walhout AJM. Functional modularity of nuclear hormone receptors in a C. elegans gene regulatory network. Molecular Systems Biology. 2010;6:367. - PMC - PubMed
    1. Bernstein BE, Birney E, Dunham I, Green ED, Gunter C, Snyder M. An integrated encyclopedia of DNA elements in the human genome. Nature. 2012;489:57–74. - PMC - PubMed
    1. Blazie SM, Babb C, Wilky H, Rawls A, Park JG, Mangone M. Comparative RNA-Seq analysis reveals pervasive tissue-specific alternative polyadenylation in Caenorhabditis elegans intestine and muscles. BMC Biol. 2015;13:4. - PMC - PubMed
    1. Deplancke B, Mukhopadhyay A, Ao W, Elewa AM, Grove CA, Martinez NJ, Sequerra R, Doucette-Stam L, Reece-Hoyes JS, Hope IA, et al. A gene-centered C. elegans protein-DNA interaction network. Cell. 2006;125:1193–1205. - PubMed

LinkOut - more resources