

Multi-Parametric Evaluation of Chronic Kidney Disease by MRI: A Preliminary Cross-Sectional Study
- PMID: 26430736
- PMCID: PMC4591972
- DOI: 10.1371/journal.pone.0139661
Multi-Parametric Evaluation of Chronic Kidney Disease by MRI: A Preliminary Cross-Sectional Study
Abstract
Background: The current clinical classification of chronic kidney disease (CKD) is not perfect and may be overestimating both the prevalence and the risk for progressive disease. Novel markers are being sought to identify those at risk of progression. This preliminary study evaluates the feasibility of magnetic resonance imaging based markers to identify early changes in CKD.
Methods: Fifty-nine subjects (22 healthy, 7 anemics with no renal disease, 30 subjects with CKD) participated. Data using 3D volume imaging, blood oxygenation level dependent (BOLD) and Diffusion MRI was acquired. BOLD MRI acquisition was repeated after 20 mg of iv furosemide.
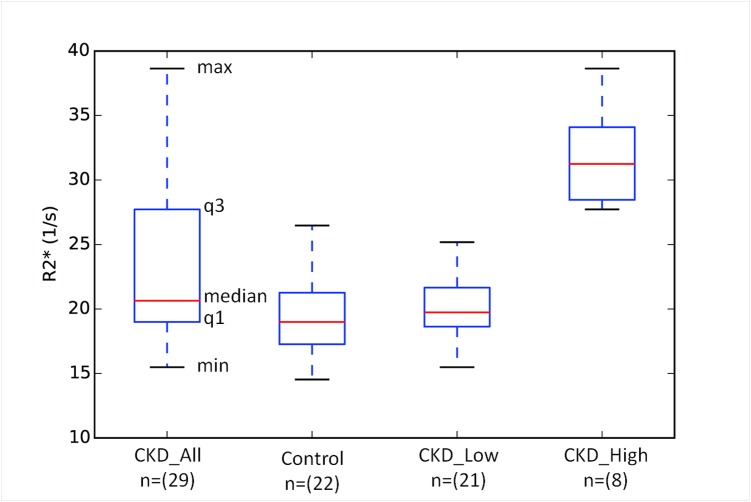
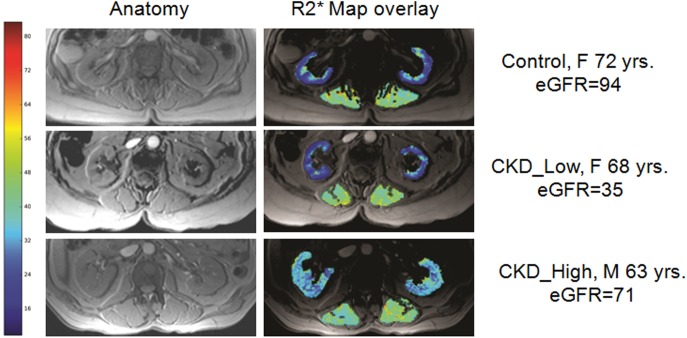
Results: Compared to healthy subjects, those with CKD have lower renal parenchymal volumes (329.6±66.4 vs. 257.1±87.0 ml, p<0.005), higher cortical R2* values (19.7±3.2 vs. 23.2±6.3 s(-1), p = 0.013) (suggesting higher levels of hypoxia) and lower response to furosemide on medullary R2* (6.9±3.3 vs. 3.1±7.5 s(-1), p = 0.02). All three parameters showed significant correlation with estimated glomerular filtration rate (eGFR). When the groups were matched for age and sex, cortical R2* and kidney volume still showed significant differences between CKD and healthy controls. The most interesting observation is that a small number of subjects (8 of 29) contributed to the increase in mean value observed in CKD. The difference in cortical R2* between these subjects compared to the rest were highly significant and had a large effect size (Cohen's d = 3.5). While highly suggestive, future studies may be necessary to verify if such higher levels of hypoxia are indicative of progressive disease. Diffusion MRI showed no differences between CKD and healthy controls.
Conclusions: These data demonstrate that BOLD MRI can be used to identify enhanced hypoxia associated with CKD and the preliminary observations are consistent with the chronic hypoxia model for disease progression in CKD. Longitudinal studies are warranted to further verify these findings and assess their predictive value.
Conflict of interest statement
Figures
References
-
- National Kidney Foundation (2002) K/DOQI clinical practice guidelines for chronic kidney disease: evaluation, classification, and stratification. Am J Kidney Dis 39: S1–266. - PubMed
Publication types
MeSH terms
Grants and funding
LinkOut - more resources
Full Text Sources
Other Literature Sources
Medical
Research Materials
Miscellaneous
