

Modeling Linkage Disequilibrium Increases Accuracy of Polygenic Risk Scores
- PMID: 26430803
- PMCID: PMC4596916
- DOI: 10.1016/j.ajhg.2015.09.001
Modeling Linkage Disequilibrium Increases Accuracy of Polygenic Risk Scores
Abstract
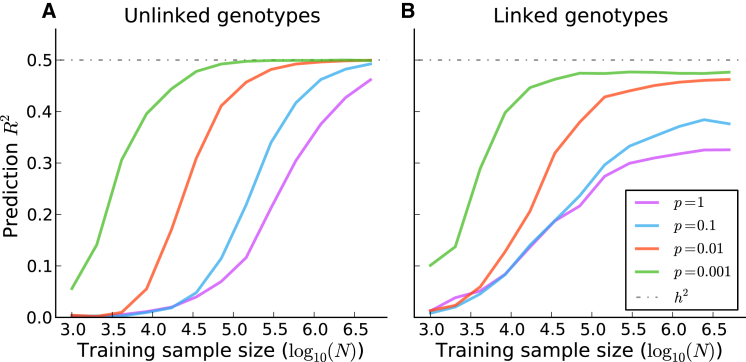
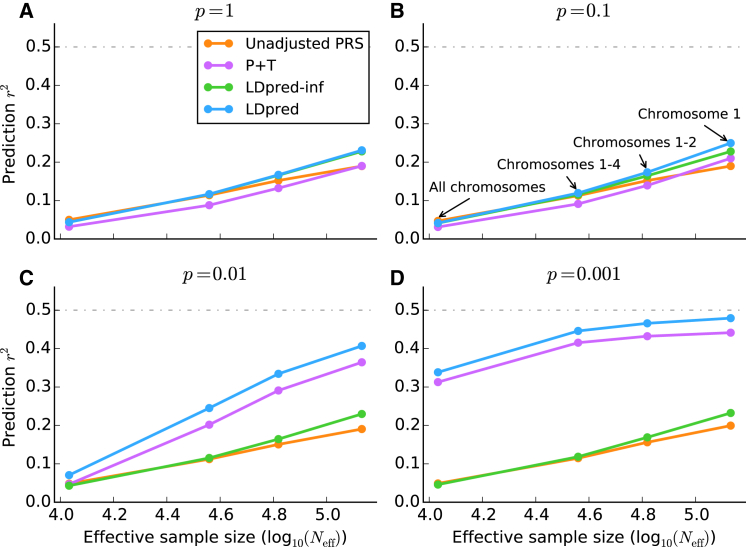
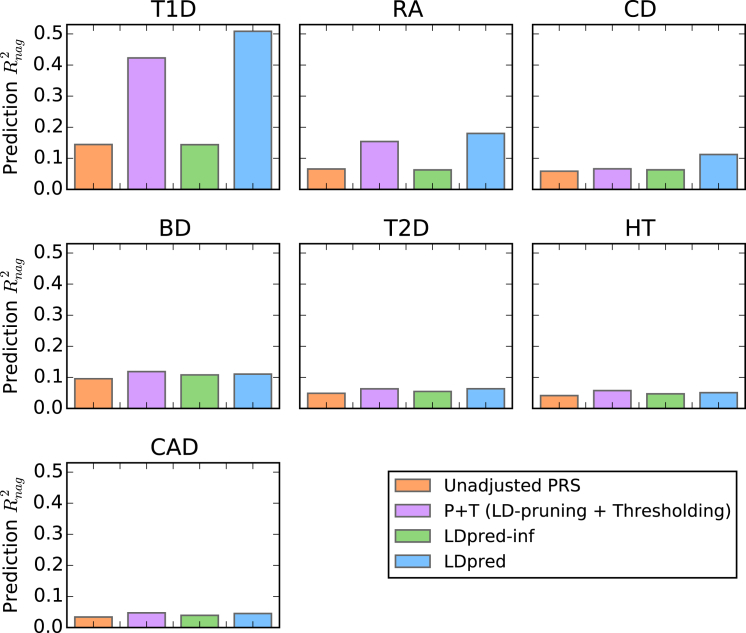
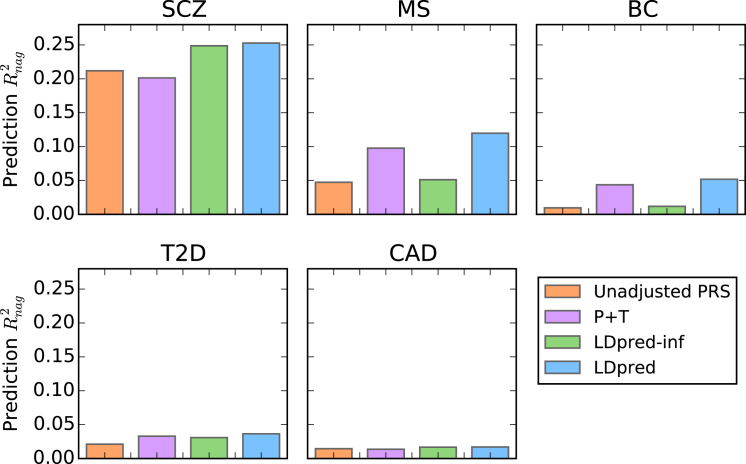
Polygenic risk scores have shown great promise in predicting complex disease risk and will become more accurate as training sample sizes increase. The standard approach for calculating risk scores involves linkage disequilibrium (LD)-based marker pruning and applying a p value threshold to association statistics, but this discards information and can reduce predictive accuracy. We introduce LDpred, a method that infers the posterior mean effect size of each marker by using a prior on effect sizes and LD information from an external reference panel. Theory and simulations show that LDpred outperforms the approach of pruning followed by thresholding, particularly at large sample sizes. Accordingly, predicted R(2) increased from 20.1% to 25.3% in a large schizophrenia dataset and from 9.8% to 12.0% in a large multiple sclerosis dataset. A similar relative improvement in accuracy was observed for three additional large disease datasets and for non-European schizophrenia samples. The advantage of LDpred over existing methods will grow as sample sizes increase.
Copyright © 2015 The American Society of Human Genetics. Published by Elsevier Inc. All rights reserved.
Figures
References
-
- Pharoah P.D., Antoniou A.C., Easton D.F., Ponder B.A. Polygenes, risk prediction, and targeted prevention of breast cancer. N. Engl. J. Med. 2008;358:2796–2803. - PubMed
-
- Evans D.M., Visscher P.M., Wray N.R. Harnessing the information contained within genome-wide association studies to improve individual prediction of complex disease risk. Hum. Mol. Genet. 2009;18:3525–3531. - PubMed
-
- Speliotes E.K., Willer C.J., Berndt S.I., Monda K.L., Thorleifsson G., Jackson A.U., Lango Allen H., Lindgren C.M., Luan J., Mägi R., MAGIC. Procardis Consortium Association analyses of 249,796 individuals reveal 18 new loci associated with body mass index. Nat. Genet. 2010;42:937–948. - PMC - PubMed
Publication types
MeSH terms
Grants and funding
- R35 CA197449/CA/NCI NIH HHS/United States
- R03 CA173785/CA/NCI NIH HHS/United States
- P01 GM099568/GM/NIGMS NIH HHS/United States
- MR/L023784/1/MRC_/Medical Research Council/United Kingdom
- U19 CA148065-01/CA/NCI NIH HHS/United States
- R01 MH085548/MH/NIMH NIH HHS/United States
- R01 GM105857/GM/NIGMS NIH HHS/United States
- G0801418/MRC_/Medical Research Council/United Kingdom
- K25 HL121295/HL/NHLBI NIH HHS/United States
- T32 ES007142/ES/NIEHS NIH HHS/United States
- 104036/WT_/Wellcome Trust/United Kingdom
- U19 CA148065/CA/NCI NIH HHS/United States
- P01 CA134294/CA/NCI NIH HHS/United States
- MR/L023784/2/MRC_/Medical Research Council/United Kingdom
- MR/L010305/1/MRC_/Medical Research Council/United Kingdom
LinkOut - more resources
Full Text Sources
Other Literature Sources
Medical
Research Materials
