. 2015 Oct 1;60(1):105-17.
doi: 10.1016/j.molcel.2015.09.005.

SRSF1-Regulated Alternative Splicing in Breast Cancer

Affiliations

SRSF1-Regulated Alternative Splicing in Breast Cancer

Olga Anczuków et al. Mol Cell. .

Abstract

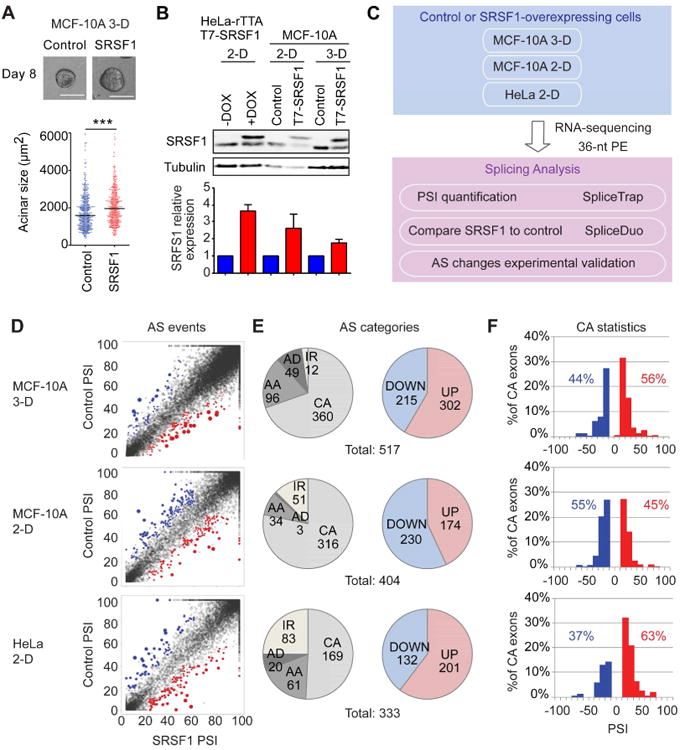
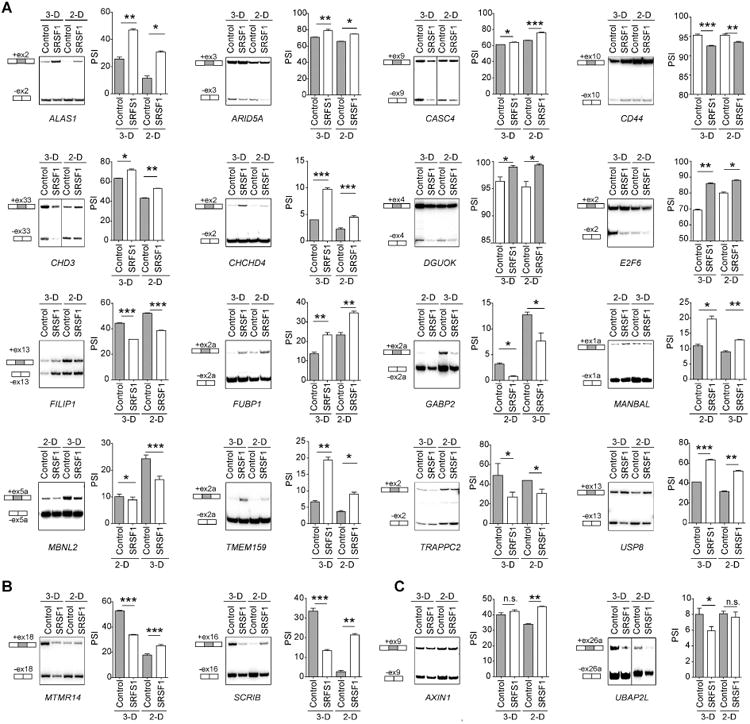
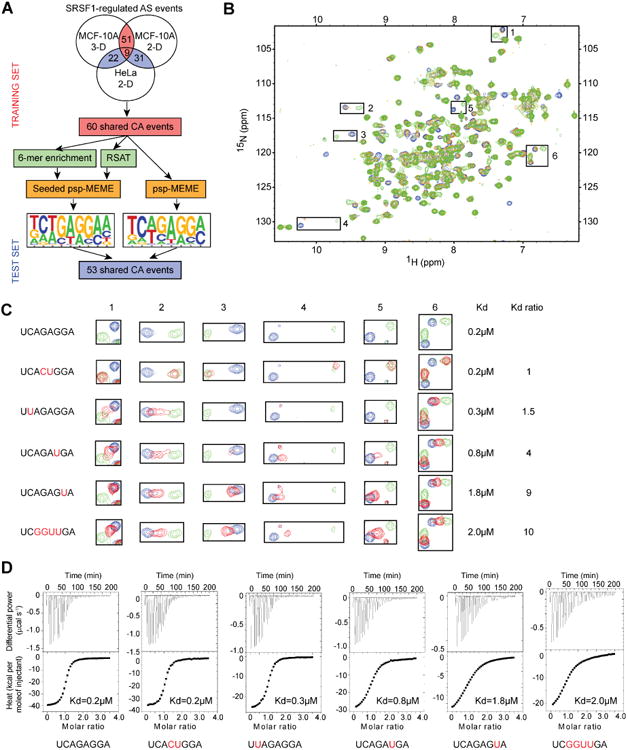
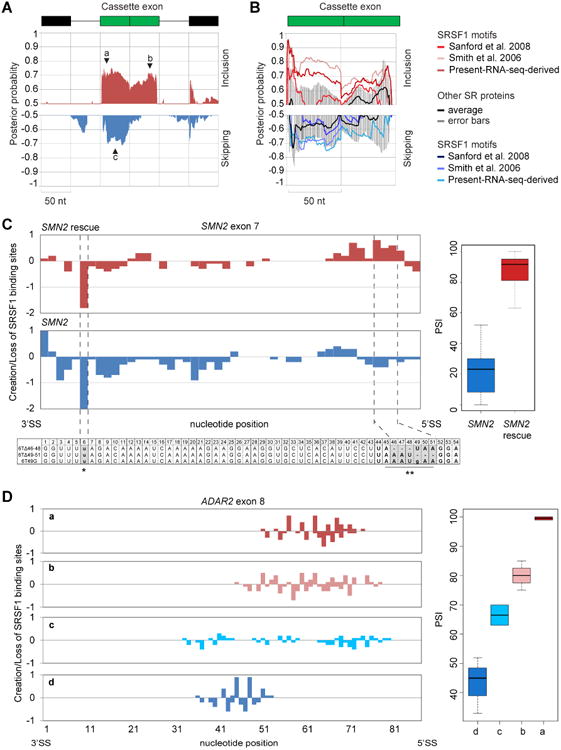
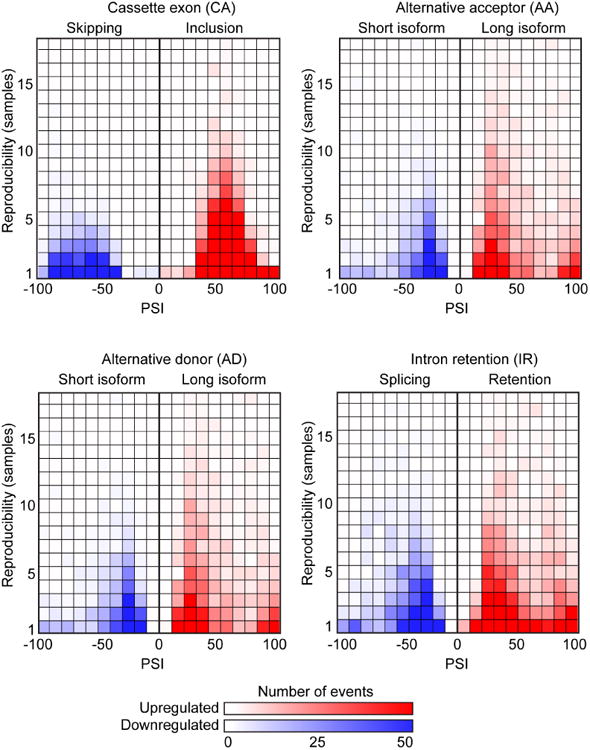
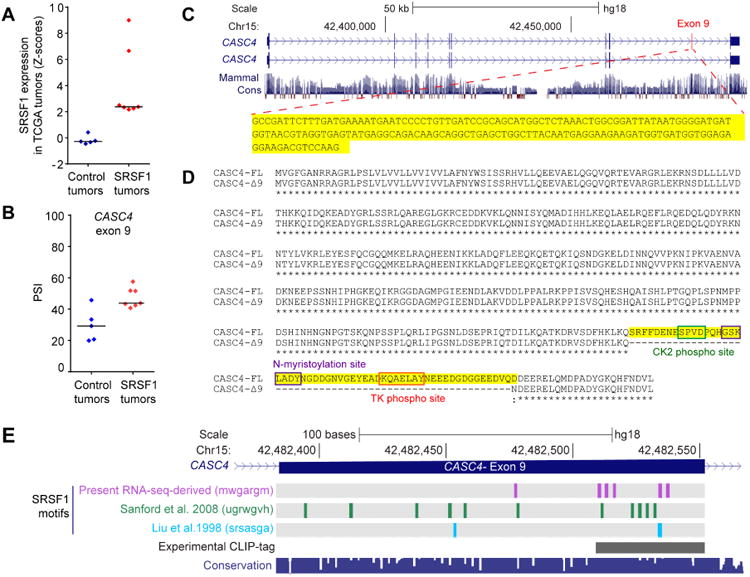
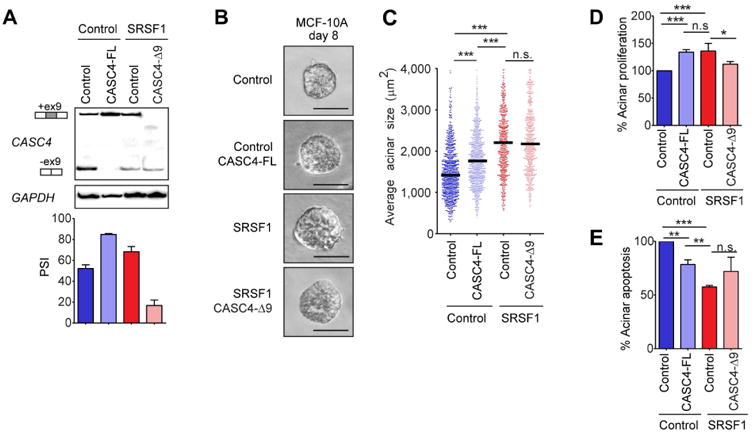
Splicing factor SRSF1 is upregulated in human breast tumors, and its overexpression promotes transformation of mammary cells. Using RNA-seq, we identified SRSF1-regulated alternative splicing (AS) targets in organotypic three-dimensional MCF-10A cell cultures that mimic a context relevant to breast cancer. We identified and validated hundreds of endogenous SRSF1-regulated AS events. De novo discovery of the SRSF1 binding motif reconciled discrepancies in previous motif analyses. Using a Bayesian model, we determined positional effects of SRSF1 binding on cassette exons: binding close to the 5' splice site generally promoted exon inclusion, whereas binding near the 3' splice site promoted either exon skipping or inclusion. Finally, we identified SRSF1-regulated AS events deregulated in human tumors; overexpressing one such isoform, exon-9-included CASC4, increased acinar size and proliferation, and decreased apoptosis, partially recapitulating SRSF1's oncogenic effects. Thus, we uncovered SRSF1 positive and negative regulatory mechanisms, and oncogenic AS events that represent potential targets for therapeutics development.


Figures

Figure 1
Figure 1. Identification of SRSF1-regulated splicing events by RNA-seq
(A) Acinar morphology and size of control or SRSF1-OE 3-D-grown MCF-10A cells. Scale bar: 100 μm. The dot plot shows the size distribution and median size. (>100 acini per experiment; Mann-Whitney test *** P<0.0005). (B) Western blot analysis of SRSF1 protein levels in inducible HeLa cells with or without doxycycline (DOX), as well as in control or SRSF1-OE 2-D or 3-D grown MCF-10A cells. Normalization relative to tubulin loading control (n=3). Error bars, s.d. (C) RNA-seq experiment and data-analysis flow-chart. (D) PSI profiles of the AS events identified in control and SRSF1-OE cells. The colored dots represent significantly upregulated (red) or downregulated (blue) AS events in SRSF1-OE compared to control cells. (E) Number of AS events in each category: CA-Cassette exons, AA-Alternative Acceptors (3′ SS), AD-Alternative Donors 5′ SS), IR-ntron Retention; DOWN/UP-AS event downregulated/upregulated in SRSF1-OE cells. (F) Skipped (blue) and included (red) SRSF1-regulated CA-exons plotted by PSI.
Figure 2
Figure 2. SRSF1-regulated CA-exons in 2-D or 3-D MCF-10A cells
Representative RT-PCR validations of SRSF1-regulated CA events altered in: (A) the same direction in 2-D and 3-D; (B) in opposite directions in 2-D and 3-D; (C) in 2-D or 3-D but not both. Total RNA was analyzed by radioactive RT-PCR using primers in the upstream and downstream exons, followed by native PAGE and autoradiography. The structure of each isoform is indicated (not to scale). CA- exons are shaded. The percent spliced in (PSI) was quantified for each condition (n≥3; t-test *** P<0.0005, ** P<0.005, * P<0.05). Error bars, s.e.m). See Figures S1-S2 for additional validations.
Figure 3
Figure 3. SRSF1-motif discovery and in vitro validation
(A) Flowchart of the SRSF1-motif discovery from the RNA-seq data. (B-D) Study of the interactions between SRSF1 RRM1+2 with WT and mutated versions of 5′-UCAGAGGA-3′ RNA. (B) Superimposition of 1H-15N HSQC spectra representing NMR titration of the 15N-labeled GB1-SRSF1 RRM1+2 protein with increasing amounts of unlabeled 5′-UCAGAGGA-3′ RNA. The peaks corresponding to the free and RNA-bound protein states (at RNA:protein ratios of 0.3:1 and 1:1) are colored blue, orange and green, respectively. The largest chemical shift perturbations observed upon RNA binding are indicated by black squares. (C) Close view of the chemical shift perturbations boxed in (B). The Kd determined by ITC in panel D and Kd ratios are indicated on the left side of the panel for each RNA sequence tested. (D) ITC data of GB1-SRSF1 RRM1+2 with WT and variants of the 5′-UCAGAGGA-3′ RNA. The estimated Kd values are shown.
Figure 4
Figure 4. SRSF1 regulatory maps and mutational analysis
(A) Position-dependent binding probabilities of SRSF1 along included (red) or skipped (blue) CA-exons and surrounding sequences. The x axis represents the nucleotide position relative to the CA (green box), upstream and downstream exons (black boxes). The line represents 100-nt of the surrounding introns. The y axis shows the median probabilities of nine different regulatory maps derived using three different SRSF1 motifs across three independent datasets (see Figure S4 for individual dataset plots). Black triangles indicate the position of the peaks with the highest posterior probability for exon inclusion or skipping. (B) Binding probabilities of SR proteins were averaged together (SRSF2, SRSF3, SRSF5, SRSF6 and SRSF7) (black line), plotted with the corresponding standard deviations (grey bars) and compared to SRSF1's binding profiles derived with three different SRFS1 motifs (red and blue lines) in the present RNA-seq dataset. (C-D) Correlation between creation or loss of SRSF1 motifs and exon inclusion in SMN2 exon 7 (C) and ADAR2 exon 8 (D). SRSF1 motif creation (positive scores) or loss (negative scores) were scored for mutations promoting high (red) or low (blue) exon inclusion (PSI), at each nucleotide position (left panel) and plotted along with their corresponding PSI levels (right panel).
Figure 5
Figure 5. Splicing changes in SRSF1-OE human breast tumors from TCGA
PSI in SRSF1-OE tumors is indicated for CA, AA, AD and IR events, divided into upregulated (red boxes) or downregulated (blue boxes) AS events. The shading of boxes is proportional to the number of events detected in each category. Each vertical axis indicates the number of tumors in which the AS event is detected.
Figure 6
Figure 6. SRSF1 regulates CASC4 alternative splicing in human breast tumors
(A) SRSF1 expression levels in human breast tumors from the control and SRFS1-OE groups. (B) PSI scores of SRSF1-regulated CASC4 exon 9 in tumors from (A). (C) Structure of the CASC4 human gene and sequence of exon 9. (D) Sequence of CASC4 protein isoforms. The amino acids encoded by the exon 9 are highlighted in yellow. Post-translational modification sites predicted by Prosite are indicated. (E) Position of SRSF1 motifs and CLIP tags (Sanford et al. 2008, Pandit et al. 2013) in CASC4 exon 9. The 100 Vertebrate Multiz Alignment & Conservation track is shown below.
Figure 7
Figure 7. The CASC4-FL isoform partially recapitulates the SRSF1-mediated acinar phenotype
(A) RT-PCR analysis of CASC4 isoforms in control MCF-10A cells overexpressing the control (empty vector) or CASC4-FL cDNA, as well as in SRSF1-OE MCF-10A cells together with the control (empty vector) or CASC4-Δ9 cDNA. PSI was quantified for each condition (n=3). Error bars, s.d. (B) Phase-contrast pictures of control and SRSF1-OE day-8 acini, expressing the control, CASC4-FL or CASC4-Δ9 constructs. Scale bar: 50 μm. (C) Acinar size distribution and median size (n=3, >100 acini per experiment; Mann-Whitney test *** P<0.0005). (D,E). The percent of day-8 acini positive for the proliferation marker ki67 (D) or the apoptosis marker cleaved caspase-3 (E) is plotted, normalized to control acini (n≥3, >30 acini per experiment; Fisher test *** P<0.0005, ** P<0.005, * P<0.05). Error bars, s.d.

Similar articles

Cited by

References

    1. Akerman M, Fregoso OI, Das S, Ruse C, Jensen MA, Pappin DJ, Zhang MQ, Krainer AR. Differential connectivity of splicing activators and repressors to the human spliceosome. Genome Biol. 2015;16:119. - PMC - PubMed
    1. Anczuków O, Rosenberg AZ, Akerman M, Das S, Zhan L, Karni R, Muthuswamy SK, Krainer AR. The splicing factor SRSF1 regulates apoptosis and proliferation to promote mammary epithelial cell transformation. Nat Struct Mol Biol. 2012;19:220–228. - PMC - PubMed
    1. Anders S, Huber W. Differential expression analysis for sequence count data. Genome Biol. 2010;11:R106. - PMC - PubMed
    1. Bissell MJ, Kenny PA, Radisky DC. Microenvironmental regulators of tissue structure and function also regulate tumor induction and progression: the role of extracellular matrix and its degrading enzymes. Cold Spring Harbor Symp Quant Biol. 2005;70:343–356. - PMC - PubMed
    1. Black DL. Mechanisms of alternative pre-messenger RNA splicing. Annu Rev Biochem. 2003;72:291–336. - PubMed

Publication types

Substances

Associated data