. 2015 Oct 2;10(10):e0139750.
doi: 10.1371/journal.pone.0139750. eCollection 2015.

Physiological Roles of Calpain 1 Associated to Multiprotein NMDA Receptor Complex

Affiliations

Physiological Roles of Calpain 1 Associated to Multiprotein NMDA Receptor Complex

Monica Averna et al. PLoS One. .

Abstract

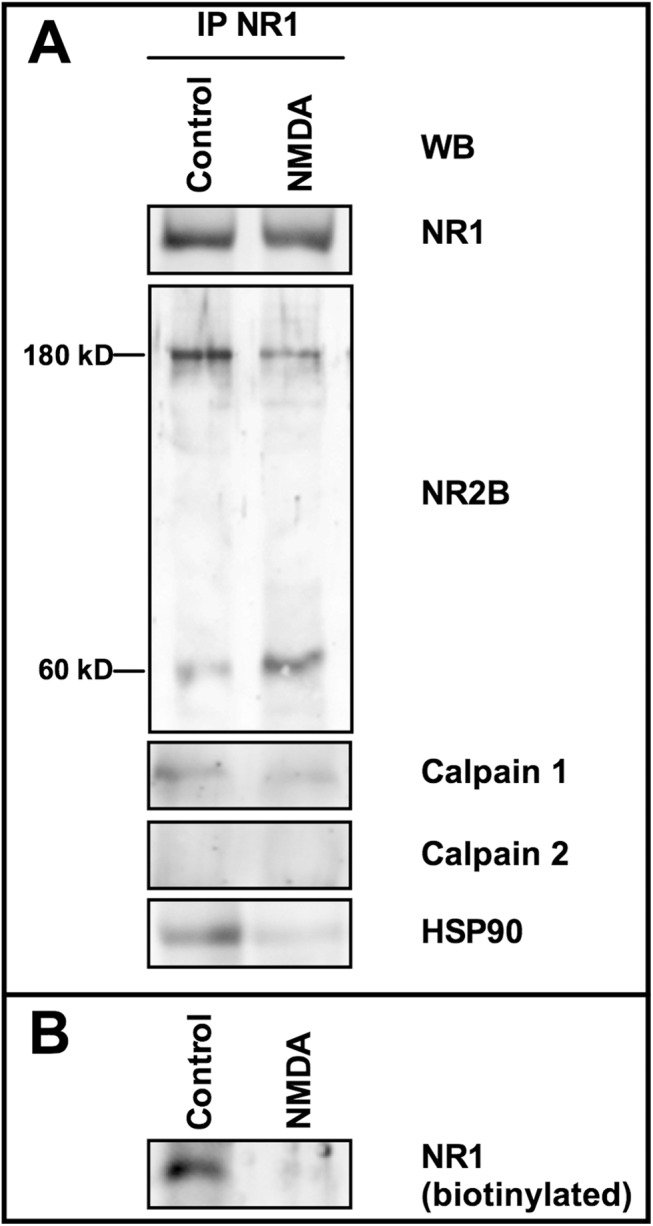
We have recently demonstrated that in resting conditions calpain 1, but not calpain 2, is specifically associated to the N-Methyl-D-Aspartate receptor (NMDAR) multiprotein complex. We are here reporting that in SKNBE neuroblastoma cells or in freshly isolated nerve terminals from adult rat hippocampus, the proteolytic activity of calpain 1 resident at the NMDAR is very low under basal conditions and greatly increases following NMDAR stimulation. Since the protease resides at the NMDAR in saturating amounts, variations in Ca2+ influx promote an increase in calpain 1 activity without affecting the amount of the protease originally associated to NMDAR. In all the conditions examined, resident calpain 1 specifically cleaves NR2B at the C-terminal region, leading to its internalization together with NR1 subunit. While in basal conditions intracellular membranes include small amounts of NMDAR containing the calpain-digested NR2B, upon NMDAR stimulation nearly all the receptor molecules are internalized. We here propose that resident calpain 1 is involved in NMDAR turnover, and following an increase in Ca2+ influx, the activated protease, by promoting the removal of NMDAR from the plasma membranes, can decrease Ca2+ entrance through this channel. Due to the absence of calpastatin in such cluster, the activity of resident calpain 1 may be under the control of HSP90, whose levels are directly related to the activation of this protease. Observations of different HSP90/calpain 1 ratios in different ultrasynaptic compartments support this conclusion.


Conflict of interest statement

Competing Interests: The authors have declared that no competing interests exist.

Figures

Fig 1
Fig 1. NMDAR cluster and calpain activity in SKNBE cells.
(A) SKNBE cells were lysed to perform immunoprecipitation with 1 μg of anti-NR1 antibody. The immunoprecipitated material (IP NR-1) was analyzed by immunoblotting (WB) to detect the indicated proteins. Each immunoblot is representative of four different experiments. (B) SKNBE cells (2 × 10⁵) were incubated in 100 μL of isotonic HEPES buffer containing 50 μM t-Boc-Leu-Met-CMAC fluorogenic calpain substrate (see Methods). Cells were then washed and suspended in 100 μL of HEPES buffer containing 10 μM glycine and 1 mM CaCl2. Calpain activity was measured in the absence (Control) or presence (NMDA) of 100 μM NMDA. Calpain activity was also measured in cells pre-incubated for 30 minutes with 1 μM Calpain inhibitor 2 (CI-2). The values reported are the arithmetical mean ± SEM of four different experiments, and p values were calculated according to t-test. (C) Calcium Green™-loaded cells were exposed to the indicated stimuli. Data are means ± SEM from two independent experiments in duplicate.
Fig 2
Fig 2. Calpain activity in NR1-immunoprecipitates from SKNBE cells.
(A) SKNBE cells (105) untreated (Control) or treated with 100 μM NMDA and 10 μM glycine for 2 hours (NMDA) were lysed to perform immunoprecipitation with 1 μg of anti-NR1 antibody. The immunoprecipitated material was suspended in 100 μL of HEPES buffer and, after addition of 5 or 1000 μM CaCl2, incubated at 37°C for 10 min in the presence of 50 μM t-Boc-Leu-Met-CMAC fluorogenic calpain substrate. Calpain activity was measured as described in Methods and the values are reported as difference between the fluorescence monitored at the indicated calcium concentration minus the one monitored in 1 mM EDTA. The values reported are the arithmetical mean ± SEM of four different experiments. (B) Calpain activity was assayed in NR1-immunoprecipitates from 105 SKNBE cells treated as in (A) (Membranes). Intracellular calpain activity was also measured in 105 SKNBE cells treated with 100 μM NMDA and 10 μM glycine for 2 hours (Intact cells).
Fig 3
Fig 3. Effect of calpain inhibition on NR2B protein levels in SKNBE cells.
(A) SKNBE cells were incubated for 24 hours in the absence or presence of 1 μM Calpain inhibitor 2 (CI-2), and lysed to perform immunoprecipitation with 1 μg of anti-NR1 antibody. The immunoprecipitated material (IP NR-1) was analyzed by immunoblotting for NR2B (WB NR2B). (B and C) The protein bands detected in (A) were quantified as described in Methods. Each value represents the arithmetical mean ± SEM of four different experiments. * p < 0.01 vs control (- CI-2), according to t-test.
Fig 4
Fig 4. Effect of calpain inhibition on intracellular localization of NMDAR.
(A and B) SKNBE cells untreated (Control, solid line) or treated with 1 μM CI-2 (+CI-2, dashed line) for 24 hours were fixed and NR2B localization was determined by confocal microscopy (see Methods). NR2B signal (green fluorescence) was continuously monitored during cell scanning by using Laser Pix software, as previously reported [54]. Each scanning trail is representative of 20 cells analyzed. (C) Aliquots (100 μL) of cell membranes were collected from the two fractions layered at 10% and 30% sucrose interface (see Methods) and assayed for 5′-nucleotidase activity, in order to determine the fraction containing the plasma membranes (PM) and the one containing internal membranes (IM). The same samples were analyzed by immunoblotting to detect the indicated proteins. (D) The protein bands detected in (C) were quantified as described in Methods. Each value represents the arithmetical mean ± SEM of three different experiments.
Fig 5
Fig 5. NMDAR translocation in SKNBE cells following activation of resident calpain 1.
(A and B) SKNBE cells were incubated for 2 hours with 100 μM NMDA and 10 μM glicine in the absence (NMDA) or presence (NMDA+CI-2) of 1 μM CI-2, or left untreated (Control). The cells were then fixed and NR1 subunit localization (green fluorescence) was determined by confocal microscopy. Confocal microscopy micrographs are representative of four different experiments. Alternatively, after the indicated treatments, cells were then lysed to perform immunoprecipitation with 1 μg of anti-NR1 antibody and the immunoprecipitated material (IP NR1) was analyzed by immunoblotting (WB) to detect the indicated proteins. (C) The protein bands detected in (B) were quantified as described in Methods. Each value represents the arithmetical mean ± SEM of three different experiments. * p < 0.01 vs control and NMDA+CI-2; ** p < 0.01 vs control and p < 0.05 vs NMDA+CI-2, according to ANOVA followed by post-hoc Tukey’s test. (D) Cell surface expression of NR1 and NR2B subunits was also evaluated by biotinylation assay (see Methods) after incubation of SKNBE cells in the absence (Control) or presence (NMDA) of 100 μM NMDA for 2 hours. NR1 and NR2B subunits were detected by immunoblotting on a fraction (30 μL) of eluted (Biotinylated) or unbound (Not Biotinylated) proteins. (E) The protein bands detected in (D) were quantified as described in Methods. Each value represents the arithmetical mean ± SEM of three different experiments. * p < 0.001 and ** p < 0.05 vs the relevant protein in biotinylated material following cell stimulation, according to t-test.
Fig 6
Fig 6. NMDAR cluster modifications in rat hippocampal synaptosomes following calpain activation.
(A) Rat hippocampal synaptosomes were incubated at 37°C for 12 min with (NMDA) or without (Control) 100 μM NMDA in HEPES buffer containing 1 μM glycine and 1 mM CaCl2. Synaptosomes were lysed and immunoprecipitation was carried out with 1 μg of anti-NR1 antibody. The immunoprecipitated material (IP NR1) was analyzed by immunoblotting (WB) to detect the indicated proteins. (B) Surface localization of NR1 subunit was also evaluated by biotinylation assay in rat hippocampal synaptosomes treated as in (A). NR1 was detected on a fraction (30 μL) of eluted proteins (biotinylated) by immunoblotting. Each immunoblot is representative of four different experiments.
Fig 7
Fig 7. HSP90 levels and 180 kD NR2B degradation in rat hippocampal synaptosomes.
(A) The immunoreactive bands (corresponding to HSP90, NR1 subunit, and Calpain 1) obtained by immunoprecipitation from SKNBE cells (see Fig 1A and relevant legend) and rat hippocampal synaptosomes (see Fig 6A and relevant legend) were quantified and the indicated protein ratio were calculated. The values reported are the arithmetical mean ± SEM of four different experiments. * p < 0.05, according to ANOVA followed by post-hoc Tukey’s test. (B) Quantification of the immunoreactive bands corresponding to 180 kD NR2B subunit immunoprecipitated from the indicated samples incubated for 2 hours at different concentrations of NMDA. (C) Quantification of the immunoreactive bands corresponding to 180 kD NR2B subunit immunoprecipitated from the indicated samples incubated with 100 μM NMDA at different times. The values reported are the arithmetical mean ± SEM of three different experiments.
Fig 8
Fig 8. NMDAR cluster modifications in ultrasynaptic fractions from rat hippocampal synaptosomes.
Rat hippocampal synaptosomes were incubated at 37°C for 12 min with (NMDA) or without (Control) 100 μM NMDA in HEPES buffer containing 1 μM glycine and 1 mM CaCl2. Synaptosomes were then lysed and ultrasynaptic fractionation was carried out as described in Methods. (A) Aliquots (20 μg according to Lowry assay) of each fraction were submitted to 10% SDS-PAGE followed by immunoblot for the indicated markers. Lane 1, non synaptic fraction; lane 2, presynaptic fraction; lane 3, postsynaptic fraction. A representative immunoblot (of three) is shown. (B) Immunoprecipitation was carried out on each fraction by using anti-NR1 antibody. The immunoprecipitated material was analyzed by immunoblotting to detect the indicated proteins. Each immunoblot is representative of three different experiments.(C, D, and E) The protein bands detected in (B) were quantified as described in Methods. Each value represents the arithmetical mean ± SEM of three different experiments. ** p < 0.01 and * p < 0.05 vs control, according to t-test.

Similar articles

Cited by

References

    1. Ono Y, Sorimachi H. Calpains: an elaborate proteolytic system. Biochim Biophys Acta. 2012;1824: 224–236. 10.1016/j.bbapap.2011.08.005 - DOI - PubMed
    1. Doshi S, Lynch DR. Calpain and the glutamatergic synapse. Front Biosci (Schol Ed). 2009;1: 466–476. - PMC - PubMed
    1. Camins A, Verdaguer E, Folch J, Pallàs M. Involvement of calpain activation in neurodegenerative processes. C.N.S Drug Rev. 2006;12: 135–148. - PMC - PubMed
    1. Wu HY, Lynch DR. Calpain and synaptic function. Mol. Neurobiol. 2006;33: 215–236. - PubMed
    1. Suzuki K, Hata S, Kawabata Y, Sorimachi H. Structure, activation, and biology of calpain. Diabetes. 2004:53; 12–18. - PubMed

Publication types

LinkOut - more resources