

Envelope Interactions in Multi-Channel Amplitude Modulation Frequency Discrimination by Cochlear Implant Users
- PMID: 26431043
- PMCID: PMC4592255
- DOI: 10.1371/journal.pone.0139546
Envelope Interactions in Multi-Channel Amplitude Modulation Frequency Discrimination by Cochlear Implant Users
Abstract
Rationale: Previous cochlear implant (CI) studies have shown that single-channel amplitude modulation frequency discrimination (AMFD) can be improved when coherent modulation is delivered to additional channels. It is unclear whether the multi-channel advantage is due to increased loudness, multiple envelope representations, or to component channels with better temporal processing. Measuring envelope interference may shed light on how modulated channels can be combined.
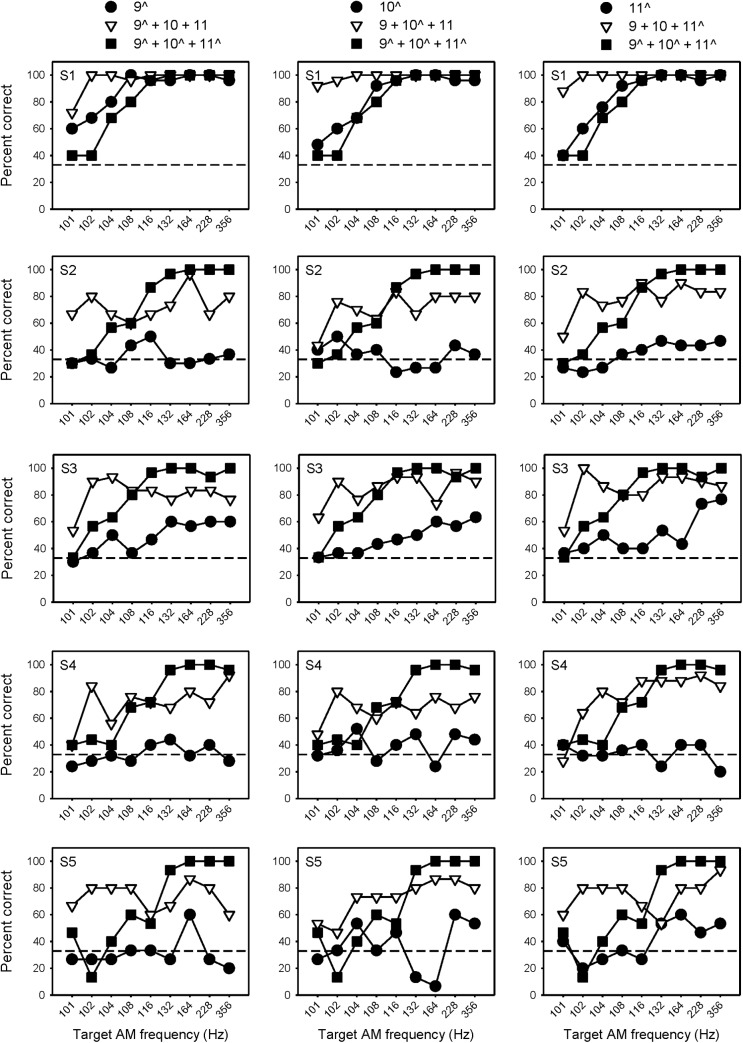
Methods: In this study, multi-channel AMFD was measured in CI subjects using a 3-alternative forced-choice, non-adaptive procedure ("which interval is different?"). For the reference stimulus, the reference AM (100 Hz) was delivered to all 3 channels. For the probe stimulus, the target AM (101, 102, 104, 108, 116, 132, 164, 228, or 256 Hz) was delivered to 1 of 3 channels, and the reference AM (100 Hz) delivered to the other 2 channels. The spacing between electrodes was varied to be wide or narrow to test different degrees of channel interaction.
Results: Results showed that CI subjects were highly sensitive to interactions between the reference and target envelopes. However, performance was non-monotonic as a function of target AM frequency. For the wide spacing, there was significantly less envelope interaction when the target AM was delivered to the basal channel. For the narrow spacing, there was no effect of target AM channel. The present data were also compared to a related previous study in which the target AM was delivered to a single channel or to all 3 channels. AMFD was much better with multiple than with single channels whether the target AM was delivered to 1 of 3 or to all 3 channels. For very small differences between the reference and target AM frequencies (2-4 Hz), there was often greater sensitivity when the target AM was delivered to 1 of 3 channels versus all 3 channels, especially for narrowly spaced electrodes.
Conclusions: Besides the increased loudness, the present results also suggest that multiple envelope representations may contribute to the multi-channel advantage observed in previous AMFD studies. The different patterns of results for the wide and narrow spacing suggest a peripheral contribution to multi-channel temporal processing. Because the effect of target AM frequency was non-monotonic in this study, adaptive procedures may not be suitable to measure AMFD thresholds with interfering envelopes. Envelope interactions among multiple channels may be quite complex, depending on the envelope information presented to each channel and the relative independence of the stimulated channels.
Conflict of interest statement
Figures


Similar articles
-
Modulation frequency discrimination with single and multiple channels in cochlear implant users.Hear Res. 2015 Jun;324:7-18. doi: 10.1016/j.heares.2015.02.007. Epub 2015 Mar 5. Hear Res. 2015. PMID: 25746914 Free PMC article.
-
Relationship Between Peripheral and Psychophysical Measures of Amplitude Modulation Detection in Cochlear Implant Users.Ear Hear. 2017 Sep/Oct;38(5):e268-e284. doi: 10.1097/AUD.0000000000000417. Ear Hear. 2017. PMID: 28207576 Free PMC article.
-
A method to dynamically control unwanted loudness cues when measuring amplitude modulation detection in cochlear implant users.J Neurosci Methods. 2014 Jan 30;222:207-12. doi: 10.1016/j.jneumeth.2013.10.016. Epub 2013 Nov 20. J Neurosci Methods. 2014. PMID: 24269251 Free PMC article.
-
Speech recognition and temporal amplitude modulation processing by Mandarin-speaking cochlear implant users.Ear Hear. 2008 Dec;29(6):957-70. doi: 10.1097/AUD.0b013e3181888f61. Ear Hear. 2008. PMID: 18818548 Free PMC article.
-
Frequency modulation detection with simultaneous amplitude modulation by cochlear implant users.J Acoust Soc Am. 2007 Aug;122(2):1046-54. doi: 10.1121/1.2751258. J Acoust Soc Am. 2007. PMID: 17672652
References
-
- Donaldson GS, Viemeister NF. Intensity discrimination and detection of amplitude modulation in electric hearing. J Acoust Soc Am; 2000; 108: 760–763. - PubMed
-
- Fu QJ. Temporal processing and speech recognition in cochlear implant users Neuroreport; 2002; 13: 1635–1640. - PubMed
-
- Chatterjee M, Oba SI. Noise improves modulation detection by cochlear implant listeners at moderate carrier levels. J Acoust Soc Am; 2005; 118: 993–1002. - PubMed
Publication types
MeSH terms
Grants and funding
LinkOut - more resources
Full Text Sources
Other Literature Sources
Medical
