. 2015 Oct 2;10(10):e0139225.
doi: 10.1371/journal.pone.0139225. eCollection 2015.

Understanding Host-Switching by Ecological Fitting

Affiliations

Understanding Host-Switching by Ecological Fitting

Sabrina B L Araujo et al. PLoS One. .

Abstract

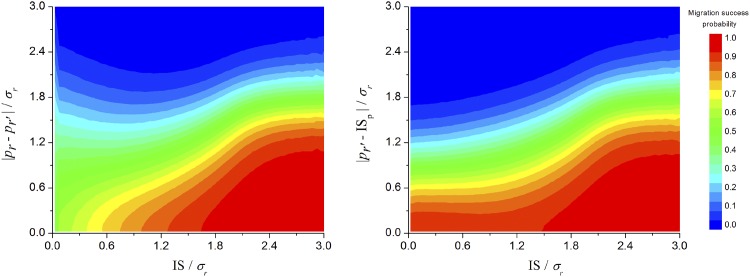
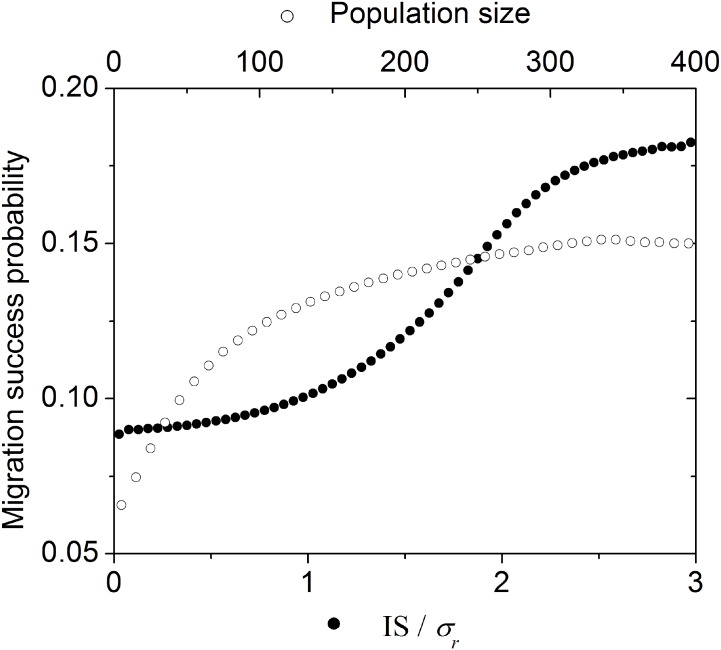
Despite the fact that parasites are highly specialized with respect to their hosts, empirical evidence demonstrates that host switching rather than co-speciation is the dominant factor influencing the diversification of host-parasite associations. Ecological fitting in sloppy fitness space has been proposed as a mechanism allowing ecological specialists to host-switch readily. That proposal is tested herein using an individual-based model of host switching. The model considers a parasite species exposed to multiple host resources. Through time host range expansion can occur readily without the prior evolution of novel genetic capacities. It also produces non-linear variation in the size of the fitness space. The capacity for host colonization is strongly influenced by propagule pressure early in the process and by the size of the fitness space later. The simulations suggest that co-adaptation may be initiated by the temporary loss of less fit phenotypes. Further, parasites can persist for extended periods in sub-optimal hosts, and thus may colonize distantly related hosts by a "stepping-stone" process.


Conflict of interest statement

Competing Interests: The authors have declared that no competing interests exist.

Figures

Fig 1
Fig 1. Flowchart of the model.
In each generation, every parasite has a chance to reproduce, disperse to a new host, and die due to the selection pressure imposed by its respective host. For simplicity, after each case of successful host-switch, the parasite population on the ancestral host is no longer modeled and the “new host” becomes the “original host”. The simulation stops when all individuals die.
Fig 2
Fig 2. Temporal evolution of the information space of the parasite population.
The black dots represent all different population phenotypes. The red line is the optimum phenotype value favored by the colonized resource (r). The green points represent the optimum phenotype favored by a new resource (r') offered at each new generation. When a new resource is successfully colonized, the source population isn’t plotted any more (the end of a red line means an extinction only for the last generation). Parameters used in this simulation are listed in Table 1.
Fig 3
Fig 3. Relation between the size of IS and the number of generations in a specific host just before a successful colonization.
Black and gray lines show the mean and the 95% confidence interval, respectively. This graph considers 109 repetitions of the parameter values listed in Table 1.
Fig 4
Fig 4. Midpoint of IS (a) and its maximum amplitude (b) in relation to the utilized resource as function of IS.
Black and gray lines show the mean and the confidence interval (of 95%), respectively. When the population is distant from the optimum (the superior confidence curve in both graphs), as the IS increases, the population evolves towards the optimum phenotype imposed by the host (a) and also loses its maximum amplitude (b) suggesting that the increasing of variation does not compensate co-adaptation (for IS/ σ r <1.5). However, as population becomes more co-adapted, the maximum amplitude of IS recuperates. These graphs consider 109 repetitions of the parameters values listed in Table 1.
Fig 5
Fig 5. Phase diagrams.
Each diagram shows the probability of successful colonization (color legend at right) as function of information space (IS) and (a) absolute distance between colonized resource and the new available one; (b) absolute distance between the new resource available and the midpoint of population phenotype distribution. This graph considers 109 repetitions of the parameters values listed in Table 1.
Fig 6
Fig 6. Effect of information space amplitude and population size on migration success probability.
This graph considers 109 repetitions of the parameters values listed in Table 1.

References

    1. Roquist F. Parsimony analysis of coevolving species associations In: Page RDM, editor. Tangled Trees: Phylogeny, Cospeciation, and Coevolution. Chicago: University of Chicago Press; 2003. pp. 22–64.
    1. Hoberg EP, Brooks DR. Structuring the biosphere: episodic host-switching, geographic colonization, and diversification in complex host-parasite systems. J Biogeogr. 2008;35: 1533–1550.
    1. Hoberg EP, Agosta SJ, Boeger WA, Brooks DR. An Integrated Parasitology: Revealing the Elephant Through Tradition and Invention. Trends Parasitol. 2015;31: 128–133. 10.1016/j.pt.2014.11.005 - DOI - PubMed
    1. Brooks DR, McLennan DA. Parascript: Parasites and the Language of Evolution. Smithsonian Inst. Univ. Press.; 1993.
    1. Brooks DR, McLennan DA. The nature of diversity: an evolutionary voyage of discovery. Chicago: The University of Chicago Press; 2002.

Publication types

LinkOut - more resources