. 2015 Oct 2;10(10):e0139588.
doi: 10.1371/journal.pone.0139588. eCollection 2015.

Exploration of Novel Inhibitors for Class I Histone Deacetylase Isoforms by QSAR Modeling and Molecular Dynamics Simulation Assays

Affiliations

Exploration of Novel Inhibitors for Class I Histone Deacetylase Isoforms by QSAR Modeling and Molecular Dynamics Simulation Assays

Zainab Noor et al. PLoS One. .

Erratum in

Abstract

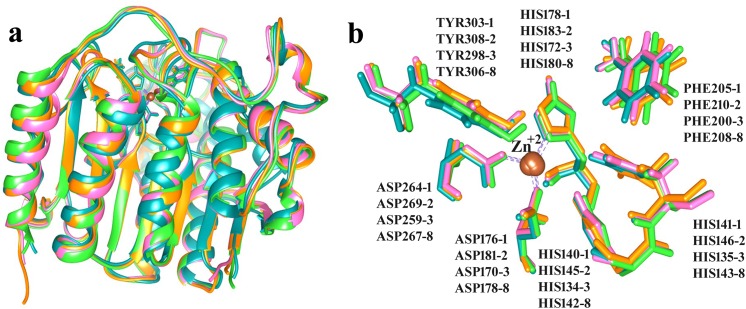
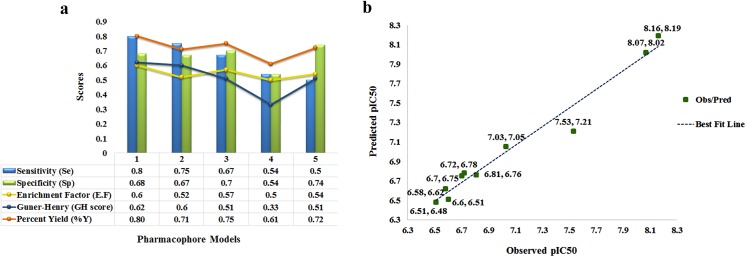
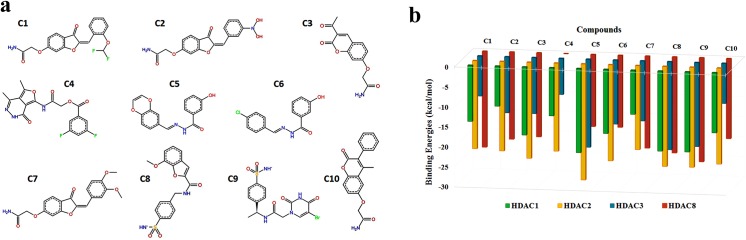
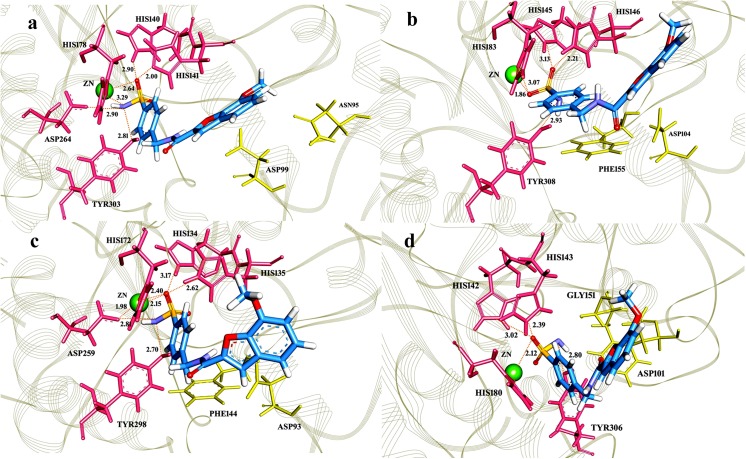
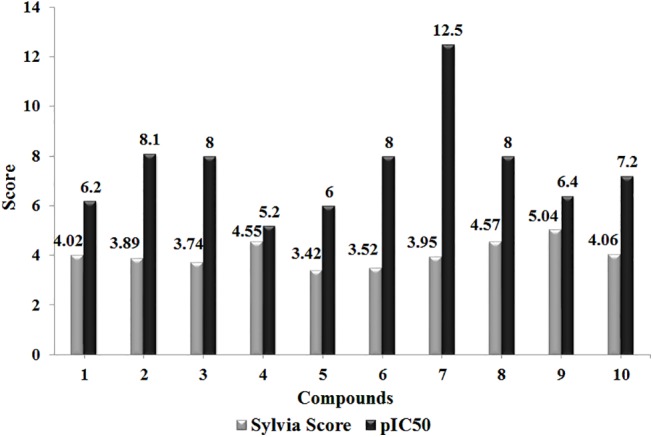
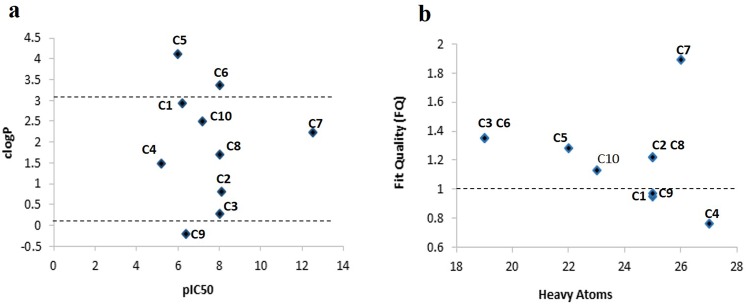
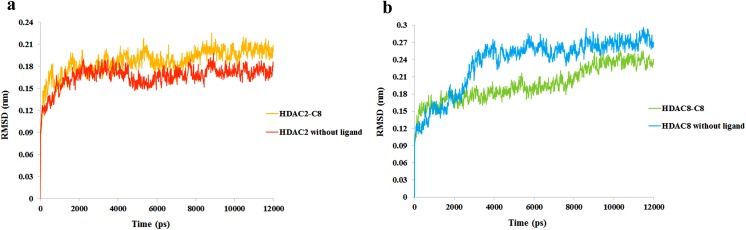
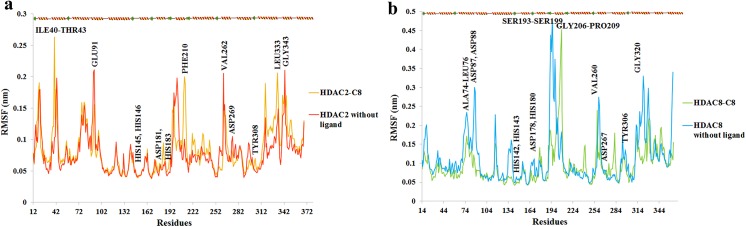
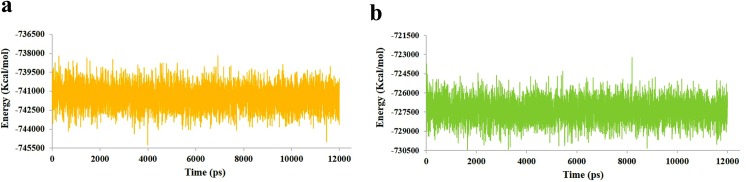
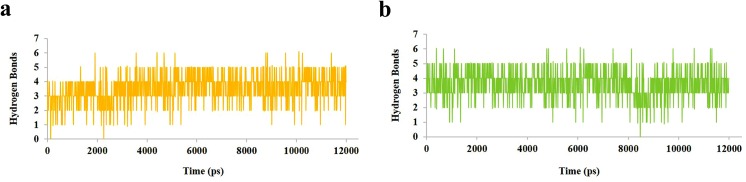
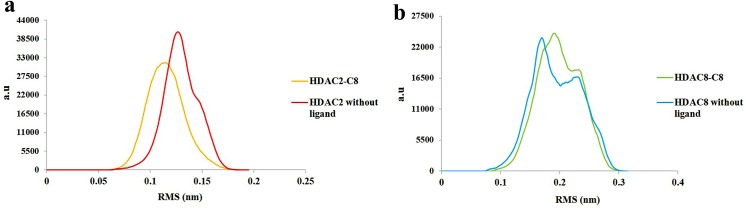
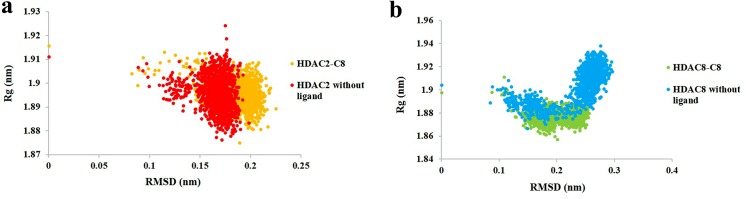
Histone deacetylases (HDAC) are metal-dependent enzymes and considered as important targets for cell functioning. Particularly, higher expression of class I HDACs is common in the onset of multiple malignancies which results in deregulation of many target genes involved in cell growth, differentiation and survival. Although substantial attempts have been made to control the irregular functioning of HDACs by employing various inhibitors with high sensitivity towards transformed cells, limited success has been achieved in epigenetic cancer therapy. Here in this study, we used ligand-based pharmacophore and 2-dimensional quantitative structure activity relationship (QSAR) modeling approaches for targeting class I HDAC isoforms. Pharmacophore models were generated by taking into account the known IC50 values and experimental energy scores with extensive validations. The QSAR model having an external R2 value of 0.93 was employed for virtual screening of compound libraries. 10 potential lead compounds (C1-C10) were short-listed having strong binding affinities for HDACs, out of which 2 compounds (C8 and C9) were able to interact with all members of class I HDACs. The potential binding modes of HDAC2 and HDAC8 to C8 were explored through molecular dynamics simulations. Overall, bioactivity and ligand efficiency (binding energy/non-hydrogen atoms) profiles suggested that proposed hits may be more effective inhibitors for cancer therapy.


Conflict of interest statement

Competing Interests: The authors have declared that no competing interests exist.

Figures

Fig 1
Fig 1. Zn+2 dependent class I HDACs.
(a) Structural superimposition of HDACs. (b) Binding sites of class 1 HDACs. HDAC1, 2, 3 and 8 are shown in orange, pink, green and blue, respectively. Zn+2 is shown in brown color.
Fig 2
Fig 2. Statistical validation of designed pharmacophore and QSAR models.
(a) Top five pharmacophore models labeled as Model (1–5). (b) Correlation analysis of QSAR regression model. Green dots depict the observed vs predicted IC50 values and correlation best fit dotted line is shown in blue.
Fig 3
Fig 3. 2D structures and binding energies of compounds C1-C10.
(a) 2D structures (b) Binding energy overview.
Fig 4
Fig 4. Binding pattern of compound C8 with class 1 HDACs.
C8 (7-methoxy-N-((4-sulfamoylphenyl)methyl)-1-benzofuran-2-carboxamide) was shown in blue, whereas hydrogen bonding and hydrophobic residues were shown in pink and yellow, respectively. (a) Hit C8 forms hydrogen bonds with HIS140, HIS148, HIS178, ASP264 and TYR303 of HDAC1; (b) HIS145, HIS146, HIS183 and TYR308 of HDAC2; (c) HIS134, HIS135, HIS172, ASP259 and (d)TYR298 of HDAC3 and HIS142, HIS143, HIS180 and TYR306 of HDAC8. C8 bonding with Zn+2 is shown in green color with an average distance of 2Å. Hydrophobic residues involved in interaction are (a) ASP99, GLY149, PHE150 and GLY301 in HDAC1; (b) PHE155, PHE210, ASP269 and GLY306 in HDAC2; (c) ASP93, PHE144, ASP170, PHE209 and GLY296 in HDAC3 and (d) PHE152, PHE208, MET274 and GLY304 in HDAC8.
Fig 5
Fig 5. Synthetic accessibility score and expected pIC50 values.
Fig 6
Fig 6. Ligand efficiency analysis of 10 selected compounds (C1-C10). (a) ClogP and (b) Fit Quality graph.
Fig 7
Fig 7. RMSD plot for 12 ns MD simulation.
(a) RMSD plot for HDAC2-C8 complex (yellow) and HDAC2 without ligand (red). (b) RMSD plot for HDAC8-C8 complex (green) and HDAC8 without ligand (blue).
Fig 8
Fig 8. RMSF plot for 12 ns MD simulation.
(a) RMSF plot for HDAC2-C8 complex (yellow) and HDAC2 without ligand (red). (b) RMSF plot for HDAC8-C8 complex (green) and HDAC8 without ligand (blue).
Fig 9
Fig 9. Energy plot for 12 ns MD simulation.
(a) Energy plot for HDAC2-C8 complex (yellow). (b) Energy plot for HDAC8-C8 complex (green).
Fig 10
Fig 10. Hydrogen bonds plot for 12 ns MD simulation.
(a) Hydrogen bonds for HDAC2-C8 complex (yellow). (b) Hydrogen bonds for HDAC8-C8 complex (green).
Fig 11
Fig 11. RMS distribution for 12 ns MD simulation.
(a) RMS distribution pattern for HDAC2-C8 complex (yellow) and HDAC2 without ligand (red). (b) RMS distribution for HDAC8-C8 complex (green) and HDAC8 without ligand (blue).
Fig 12
Fig 12. Radius of gyration (Rg) analysis for 12 ns MD simulation.
(a) Rg/RMSD plot for HDAC2-C8 complex (yellow) and HDAC2 without ligand (red). (b) Rg/RMSD for HDAC8-C8 complex (green) and HDAC8 without ligand (blue).
Fig 13
Fig 13. Disease association and inhibition mechanism of class I HDACs.
Over expression of HDACs has been perceived in numerous cancers. Binding of drug-like molecules to the catalytic cavity of HDACs eradicates these enzymes from transcription initiation site and stimulates the inclusion of HATs. Acetylation of histones by means of HATs reactivates the transcription of tumor suppressor genes. Expression of these genes controls the abnormal cell growth by cell cycle arrest and mitotic cell death or escalation of apoptosis and autophagy. Tumor suppressor genes enhance the sensitivity of chemotherapy and restrict the process of angiogenesis by decreasing VEGF.

References

    1. Legube G, Trouche D. Regulating histone acetyltransferases and deacetylases. EMBO Rep. 2003;4(10): 944–947. - PMC - PubMed
    1. Hayes JJ, Tullius TD, Wolffe AP. The structure of DNA in a nucleosome. Proc Natl Acad Sci. 1990;87(19): 7405–7409. - PMC - PubMed
    1. Arents G, Moudrianakis EN. Topography of the histone octamer surface: repeating structural motifs utilized in the docking of nucleosomal DNA. Proc Natl Acad Sci. 1993;90(22): 10489–10493. - PMC - PubMed
    1. Gregory PD, Wagner K, Hörz W. Histone acetylation and chromatin remodeling. Exp Cell Res. 2001;265(2): 195–202. - PubMed
    1. Lee DY, Hayes JJ, Pruss D, Wolffe AP. A positive role for histone acetylation in transcription factor access to nucleosomal DNA. Cell. 1993;72(1): 73–84. - PubMed

MeSH terms