

18F-EF5 PET Is Predictive of Response to Fractionated Radiotherapy in Preclinical Tumor Models
- PMID: 26431331
- PMCID: PMC4592127
- DOI: 10.1371/journal.pone.0139425
18F-EF5 PET Is Predictive of Response to Fractionated Radiotherapy in Preclinical Tumor Models
Abstract
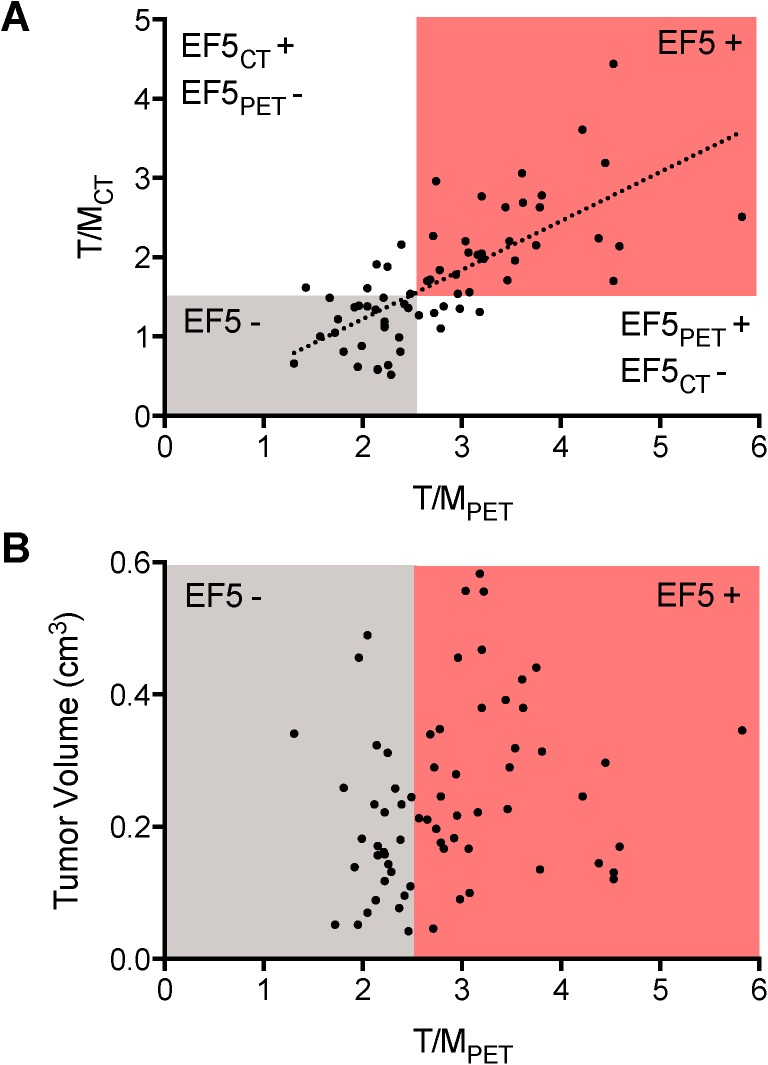
We evaluated the relationship between pre-treatment positron emission tomography (PET) using the hypoxic tracer 18F-[2-(2-nitro-1-H-imidazol-1-yl)-N-(2,2,3,3,3- pentafluoropropyl) acetamide] (18F-EF5) and the response of preclinical tumor models to a range of fractionated radiotherapies. Subcutaneous HT29, A549 and RKO tumors grown in nude mice were imaged using 18F-EF5 positron emission tomography (PET) in order to characterize the extent and heterogeneity of hypoxia in these systems. Based on these results, 80 A549 tumors were subsequently grown and imaged using 18F-EF5 PET, and then treated with one, two, or four fraction radiation treatments to a total dose of 10-40 Gy. Response was monitored by serial caliper measurements of tumor volume. Longitudinal post-treatment 18F-EF5 PET imaging was performed on a subset of tumors. Terminal histologic analysis was performed to validate 18F-EF5 PET measures of hypoxia. EF5-positive tumors responded more poorly to low dose single fraction irradiation relative to EF5-negative tumors, however both groups responded similarly to larger single fraction doses. Irradiated tumors exhibited reduced 18F-EF5 uptake one month after treatment compared to control tumors. These findings indicate that pre- treatment 18F-EF5 PET can predict the response of tumors to single fraction radiation treatment. However, increasing the number of fractions delivered abrogates the difference in response between tumors with high and low EF5 uptake pre-treatment, in agreement with traditional radiobiology.
Conflict of interest statement
Figures


Similar articles
-
18F-EF5 PET imaging as an early response biomarker for the hypoxia-activated prodrug SN30000 combined with radiation treatment in a non-small cell lung cancer xenograft model.J Nucl Med. 2013 Aug;54(8):1339-46. doi: 10.2967/jnumed.112.116293. Epub 2013 Jun 5. J Nucl Med. 2013. PMID: 23740105 Free PMC article.
-
Comparison of the Hypoxia PET Tracer (18)F-EF5 to Immunohistochemical Marker EF5 in 3 Different Human Tumor Xenograft Models.J Nucl Med. 2014 Jul;55(7):1192-7. doi: 10.2967/jnumed.114.137448. Epub 2014 May 22. J Nucl Med. 2014. PMID: 24854792 Free PMC article.
-
Noninvasive imaging of tumor hypoxia in rats using the 2-nitroimidazole 18F-EF5.Eur J Nucl Med Mol Imaging. 2003 Feb;30(2):259-66. doi: 10.1007/s00259-002-1037-5. Epub 2002 Nov 23. Eur J Nucl Med Mol Imaging. 2003. PMID: 12552344
-
2-(2-Nitro-1H-imidazol-1-yl)-N-(2,2,3,3,3-[18F]pentafluoropropyl)-acetamide.2005 Nov 8 [updated 2005 Dec 31]. In: Molecular Imaging and Contrast Agent Database (MICAD) [Internet]. Bethesda (MD): National Center for Biotechnology Information (US); 2004–2013. 2005 Nov 8 [updated 2005 Dec 31]. In: Molecular Imaging and Contrast Agent Database (MICAD) [Internet]. Bethesda (MD): National Center for Biotechnology Information (US); 2004–2013. PMID: 20641211 Free Books & Documents. Review.
-
Longitudinal PET imaging of tumor hypoxia during the course of radiotherapy.Eur J Nucl Med Mol Imaging. 2018 Nov;45(12):2201-2217. doi: 10.1007/s00259-018-4116-y. Epub 2018 Aug 20. Eur J Nucl Med Mol Imaging. 2018. PMID: 30128659 Review.
Cited by
-
Synthesis of a 2-nitroimidazole derivative N-(4-[18F]fluorobenzyl)-2-(2-nitro-1H-imidazol-1-yl)-acetamide ([18 F]FBNA) as PET radiotracer for imaging tumor hypoxia.EJNMMI Radiopharm Chem. 2022 Jun 13;7(1):13. doi: 10.1186/s41181-022-00165-0. EJNMMI Radiopharm Chem. 2022. PMID: 35697954 Free PMC article.
-
Functional Imaging of Hypoxia: PET and MRI.Cancers (Basel). 2023 Jun 25;15(13):3336. doi: 10.3390/cancers15133336. Cancers (Basel). 2023. PMID: 37444446 Free PMC article. Review.
-
Rationale for Combining Radiotherapy and Immune Checkpoint Inhibition for Patients With Hypoxic Tumors.Front Immunol. 2019 Mar 12;10:407. doi: 10.3389/fimmu.2019.00407. eCollection 2019. Front Immunol. 2019. PMID: 30930892 Free PMC article. Review.
-
In vivo bioluminescence tomography-guided system for pancreatic cancer radiotherapy research.Biomed Opt Express. 2024 Jul 9;15(8):4525-4539. doi: 10.1364/BOE.523916. eCollection 2024 Aug 1. Biomed Opt Express. 2024. PMID: 39347008 Free PMC article.
-
Hypoxia imaging with 18F-FAZA PET/CT predicts radiotherapy response in esophageal adenocarcinoma xenografts.Radiat Oncol. 2018 Mar 7;13(1):39. doi: 10.1186/s13014-018-0984-3. Radiat Oncol. 2018. PMID: 29514673 Free PMC article.
References
-
- Brown JM, Wilson WR (2004) Exploiting tumor hypoxia in cancer treatment. Nature Reviews Cancer 4: 437–447. - PubMed
-
- Hall EJ, Giaccia AJ (2006) Radiobiology for the radiologist Philadelphia, PA: Lippincott Williams & Wilkins; ix, 546 p.
-
- Kallman RF (1972) The phenomenon of reoxygenation and its implications for fractionated radiotherapy. Radiology 105: 135–142. - PubMed
-
- Ziemer LS, Evans SM, Kachur AV, Shuman AL, Cardi CA, Jenkins WT, et al. (2003) Noninvasive imaging of tumor hypoxia in rats using the 2-nitroimidazole 18F-EF5. European Journal of Nuclear Medicine 30: 259–266. - PubMed
Publication types
MeSH terms
Substances
Grants and funding
LinkOut - more resources
Full Text Sources
Other Literature Sources
