. 2015 Oct 20;6(32):33165-77.
doi: 10.18632/oncotarget.5320.

Vesicular stomatitis virus expressing interferon-β is oncolytic and promotes antitumor immune responses in a syngeneic murine model of non-small cell lung cancer

Affiliations

Vesicular stomatitis virus expressing interferon-β is oncolytic and promotes antitumor immune responses in a syngeneic murine model of non-small cell lung cancer

Manish R Patel et al. Oncotarget. .

Abstract

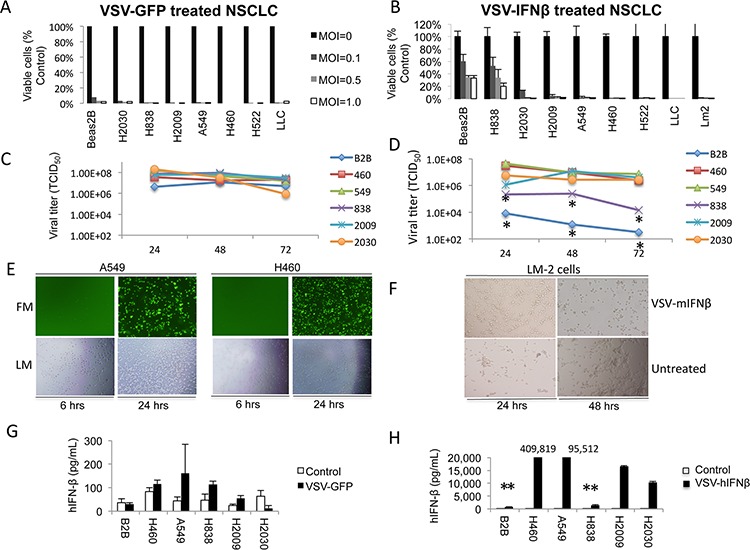
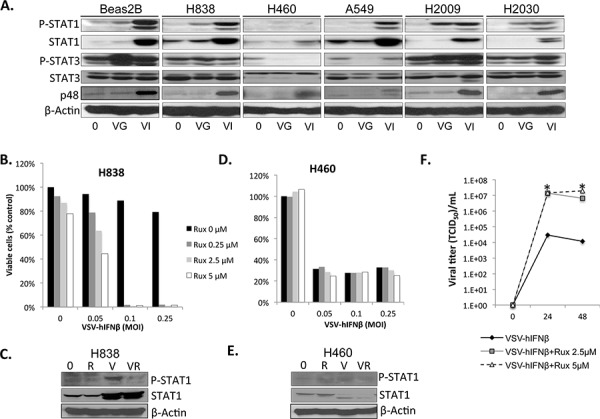
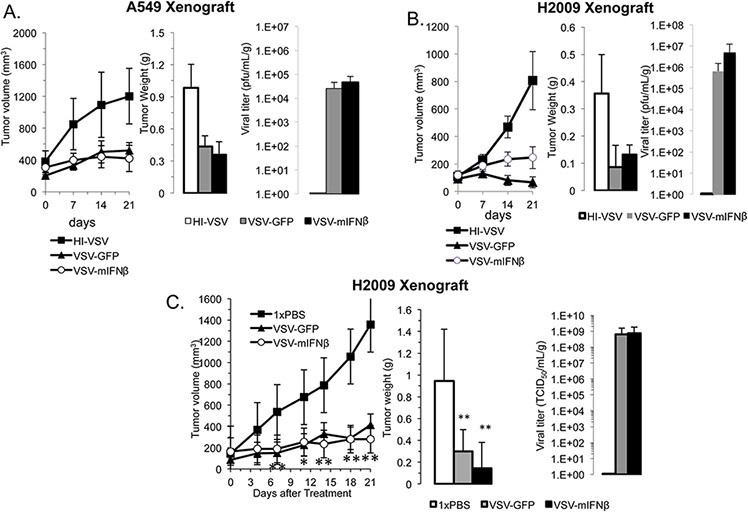
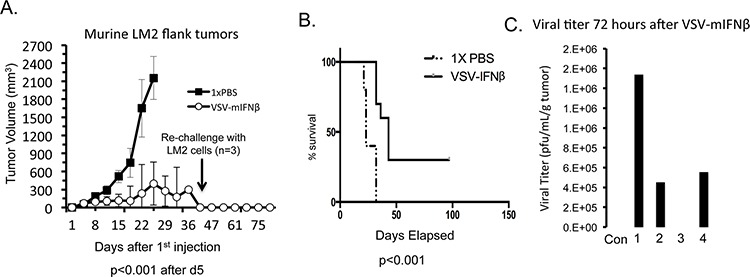
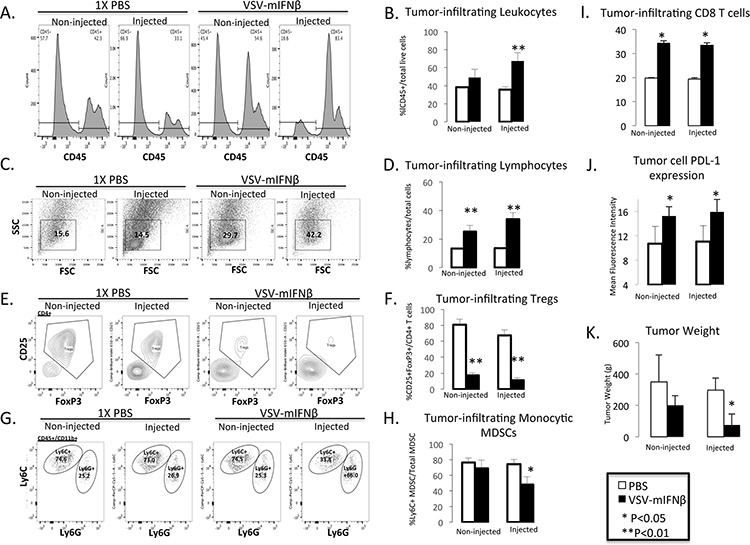
Vesicular stomatitis virus (VSV) is a potent oncolytic virus for many tumors. VSV that produces interferon-β (VSV-IFNβ) is now in early clinical testing for solid tumors. Here, the preclinical activity of VSV and VSV-IFNβ against non-small cell lung cancer (NSCLC) is reported. NSCLC cell lines were treated in vitro with VSV expressing green fluorescence protein (VSV-GFP) and VSV-IFNβ. VSV-GFP and VSV-IFNβ were active against NSCLC cells. JAK/STAT inhibition with ruxolitinib re-sensitized resistant H838 cells to VSV-IFNβ mediated oncolysis. Intratumoral injections of VSV-GFP and VSV-IFNβ reduced tumor growth and weight in H2009 nude mouse xenografts (p < 0.01). A similar trend was observed in A549 xenografts. Syngeneic LM2 lung tumors grown in flanks of A/J mice were injected with VSV-IFNβ intratumorally. Treatment of LM2 tumors with VSV-IFNβ resulted in tumor regression, prolonged survival (p < 0.0001), and cure of 30% of mice. Intratumoral injection of VSV-IFNβ resulted in decreased tumor-infiltrating regulatory T cells (Treg) and increased CD8+ T cells. Tumor cell expression of PDL-1 was increased after VSV-IFNβ treatment. VSV-IFNβ has potent antitumor effects and promotes systemic antitumor immunity. These data support further clinical investigation of VSV-IFNβ for NSCLC.

Keywords: NSCLC; Treg; VSV; interferon-β; oncolytic virus.


Conflict of interest statement

CONFLICTS OF INTEREST

The authors have no relevant conflicts of interest to disclose.

Figures

Figure 1
Figure 1. VSV-GFP and VSV-hIFNβ are cytotoxic to NSCLC cells
A. Human NSCLC cell lines and Beas2B cells (control) were infected with VSV-GFP at the indicated MOI. Cell viability was determined after 72 hours by trypan blue exclusion. B. Human and murine NSCLC cell lines and Beas2B cells were infected with VSV-hIFNβ and VSV-mIFNβ, respectively, at the indicated MOI. LLC and LM2 are murine NSCLC lines; all other lines are human NSCLC. Cell viability was determined after 72 hours by trypan blue exclusion. C and D. Viral titer was determined by collecting supernatant from NSCLC cell lines and Beas2B cells treated in vitro with an MOI of 0.1. Supernatant was collected daily after infection with either VSV-GFP (C) or VSV-hIFNβ (D) * indicates statistically significant result comparing Beas2B and H838 to the rest of the NSCLC cell lines. E. Representative fluorescence and light micrographs of NSCLC cells infected with VSV-GFP at 6 and 24 hours. F. Light micrographs showing cytopathic effect of VSV-mIFNβ against murine LM2 cells after infection. G and H. Production of human IFNβ was determined by collecting supernatant from NSCLC cell lines and Beas2B cells treated in vitro with an MOI of 0.1. Supernatant was collected at 48 hours after infection with either VSV-GFP (G) or VSV-hIFNβ (H) and tested for the presence of hIFNβ by ELISA, and ** signifies p < 0.0001 comparing Beas2B and H838 to the other NSCLC cell lines. Numbers above the bar graphs indicate the hIFNβ level in the supernatant (in pg/mL). Error bars indicate standard deviation.
Figure 2
Figure 2. NSCLC cells are defective in IFN response to viral infection
NSCLC cells were infected with VSV-GFP and VSV-hIFNβ, and cell lysates were prepared after 24 hours of infection at an MOI of 0.1. A. Signaling proteins in the IFN response were assayed by immunoblot. β-actin was used as a loading control. 0, untreated; VG, VSV-GFP; VI, VSV-hIFNβ. B–E. H838 cells and H460 cells grown in 96-well plates were treated with VSV-hIFNβ alone at indicated MOI or in combination with ruxolitinib at indicated doses. Viable cells were assayed 72 hours after treatment (B and D). Western blots for p-STAT1 were done in H838 cells and H460 cells (C and E) to demonstrate inhibition of p-STAT1 in H838 cells after ruxolitinib treatment. 0 = untreated, R = ruxolitinib 250 nM V = VSV-hIFNβ MOI 0.1, VR = combination VSV-hIFNβ and ruxolitinib. F. Supernatants from cells treated in parallel to B) were collected and assayed for viral titer at 24 and 48 hours post-infection. Data are expressed as TCID50/mL. * denotes p < 0.01 compared to VSV-hIFNβ alone.
Figure 3
Figure 3. Western blot of PKR/eIF2α and ER stress pathway
NSCLC cells were infected with VSV-GFP and VSV-hIFNβ at an MOI of 0.1. Lysates were prepared 24 hours following infection and assayed by immunoblot. A. Immunoblot of PKR and eIF2 pathway. B. Immunoblot of ER stress proteins. 0, untreated; VG, VSV-GFP; VI, VSV-hIFNβ. β-Actin was used as a loading control. The β-Actin in A) was from the same lysates as the immunoblots in B).
Figure 4
Figure 4. VSV has antitumor efficacy in human xenografts
Nude mice bearing A549 A. and H2009 B. xenografts were treated with 6.6 × 10⁸ TCID50 heat-inactivated VSV (HI-VSV), VSV-GFP, or VSV-mIFNβ by intratumoral injection on days 0, 7, and 14. One week after the last injection (day 21), mice were sacrificed and tumors resected (n = 5 per group). Tumor volumes were measured with calipers in two dimensions (A and B, left). Tumors were weighed after sacrifice (A and B, middle). Viral titer was determined from resected tumors on day 21 (A and B, right). C. H2009 xenografts were treated with 1× PBS, 5 × 10⁸ TCID50 VSV-GFP or VSV-mIFNβ given on days 0, 2, and 4 followed by observation until day 21. Tumor volume was measured by calipers twice weekly (left). All mice were sacrificed on day 21, and resected tumors were weighed (middle) and assayed for viral titer on day 21 (right). Error bars indicate standard error of the mean (SEM), * indicates p-value < 0.05, ** indicates p-value < 0.001.
Figure 5
Figure 5. VSV-mIFNβ treatment of LM2 in immune competent A/J mice
A. Mice (n = 10) were treated with intratumoral injections of 1× PBS or VSV-mIFNβ at a dose of 1.5 × 10¹⁰ TCID50 every other day for 3 doses. Estimate of tumor volume based on 2-dimensional measurements are shown. At day 45, 3 mice had no visible tumors and were re-challenged with 1 × 10⁶ LM2 cells injected in the flank. After 30 days, no tumors grew in these mice. B. Kaplan-Meier curve of survival of mice as defined as the date mice were sacrificed either because there tumors were larger than 1.5 cm3 or they had ulcerated tumor requiring sacrifice in accordance with ethical standards. Data were analyzed with log rank test and curves were significantly different (p < 0.001). C. A separate group of 5 mice were similarly treated with 1.5 × 10¹⁰ TCID50 VSV-mIFNβ and were sacrificed 72 hours later. Viral titers from resected tumors were determined using plaque assay. Four mice were treated with VSV-mIFNβ and one mouse was given PBS (Con). Error bars indicate standard deviation.
Figure 6
Figure 6. Flow cytometric analysis of tumor infiltrating leukocytes in injected and contralateral non-injected tumors after treatment with VSV-mIFNβ or 1× PBS
A. Representative histograms of CD45+ leukocytes. B. Pooled data from n = 5 mice of total tumor infiltrating leukocytes. C. Representative scatter plot of lymphocyte population from VSV-mIFNβ-treated and control mice. FSC = Forward Scatter, SSC = Side scatter D. Pooled data from n = 5 mice of the total tumor infiltrating lymphocyte population. E. Representative Tumor infiltrating CD4+CD25+FoxP3+ Treg cells. F. Pooled data from n = 5 mice of the percentage of tumor infiltrating Treg cells. G. Representative histograms of tumor infiltrating monocytic MDSC (CD11b+Ly6ChiLy6G-) and polymorphonuclear MDSC (CD11b+Ly6CintLy6G+) cells. H. Pooled data of percentage of tumor infiltrating monocytic MDSC. I. Pooled data of percentage of tumor infiltrating CD8+ T cells. J. Pooled data of PDL-1 expression in CD45- tumor cells. Data are expressed as the Mean fluorescence intensity (PDL-1 expression/Isotype IgG). For each of the bar graphs, error bars indicate standard deviation. * denotes p < 0.05, ** denotes p < 0.001 comparing VSV-mIFNβ treated mice to PBS-treated mice. K. Tumor weights at the time of sacrifice 10 days after 1st VSV-mIFNβ injection. Error bars indicate standard deviation.

Similar articles

Cited by

References

    1. Patel MR, Kratzke RA. Oncolytic virus therapy for cancer: the first wave of translational clinical trials. Transl Res. 2013;161:355–364. - PubMed
    1. Russell SJ, Peng KW, Bell JC. Oncolytic virotherapy. Nat Biotechnol. 2012;30:658–670. - PMC - PubMed
    1. Li Q, Wei YQ, Wen YJ, Zhao X, Tian L, Yang L, Mao YQ, Kan B, Wu Y, Ding ZY, Deng HX, Li J, Luo Y, et al. Induction of apoptosis and tumor regression by vesicular stomatitis virus in the presence of gemcitabine in lung cancer. Int J Cancer. 2004;112:143–149. - PubMed
    1. Barber GN. Vesicular stomatitis virus as an oncolytic vector. Viral Immunol. 2004;17:516–527. - PubMed
    1. Willmon CL, Saloura V, Fridlender ZG, Wongthida P, Diaz RM, Thompson J, Kottke T, Federspiel M, Barber G, Albelda SM, Vile RG. Expression of IFN-beta enhances both efficacy and safety of oncolytic vesicular stomatitis virus for therapy of mesothelioma. Cancer research. 2009;69:7713–7720. - PMC - PubMed

Publication types

MeSH terms

Substances