. 2015 Nov 3;6(34):36319-37.
doi: 10.18632/oncotarget.5415.

Inhibition of testicular embryonal carcinoma cell tumorigenicity by peroxisome proliferator-activated receptor-β/δ- and retinoic acid receptor-dependent mechanisms

Affiliations

Inhibition of testicular embryonal carcinoma cell tumorigenicity by peroxisome proliferator-activated receptor-β/δ- and retinoic acid receptor-dependent mechanisms

Pei-Li Yao et al. Oncotarget. .

Abstract

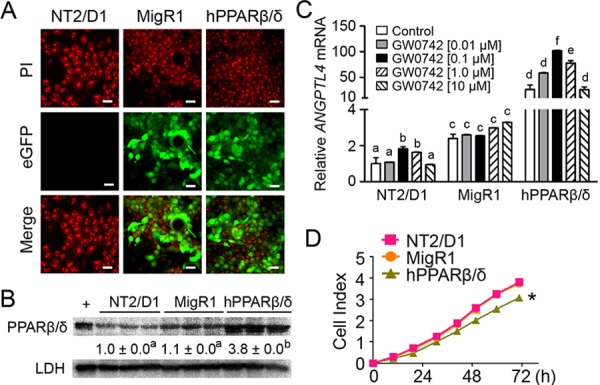
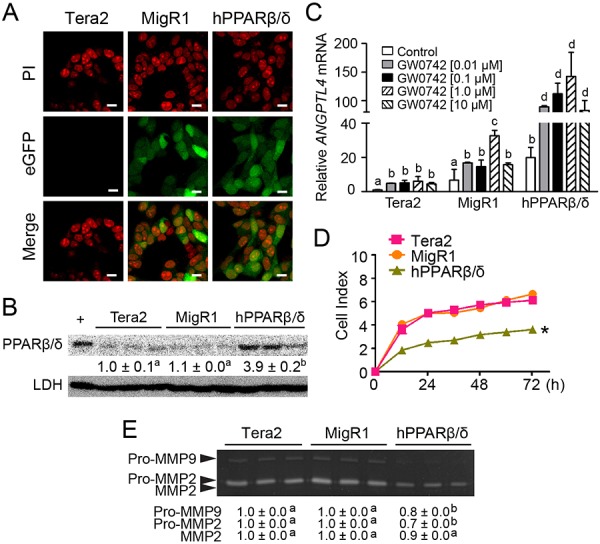
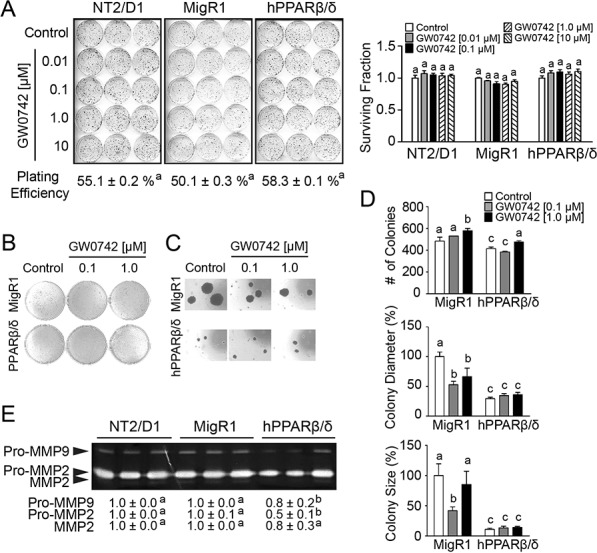
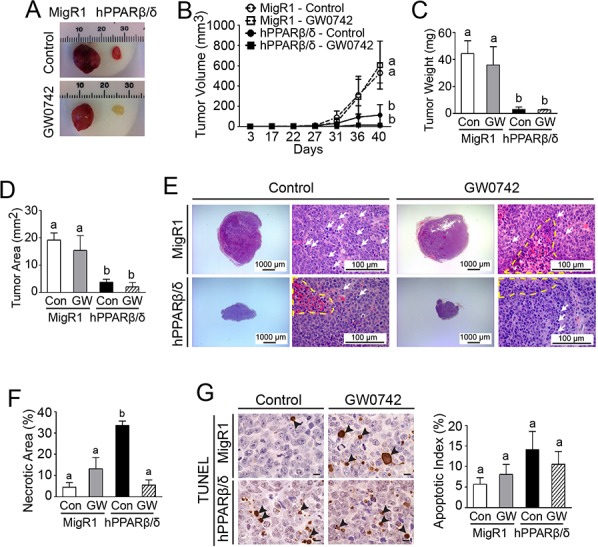
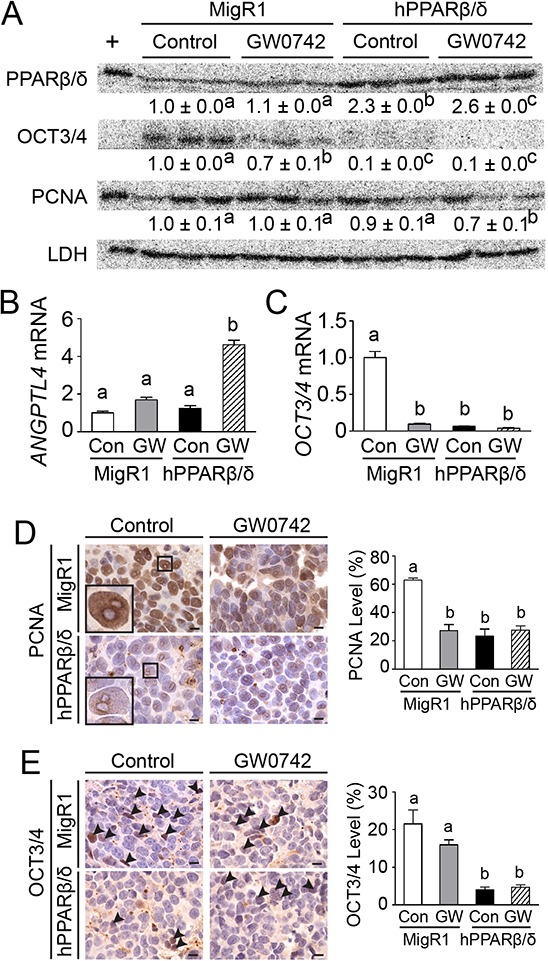
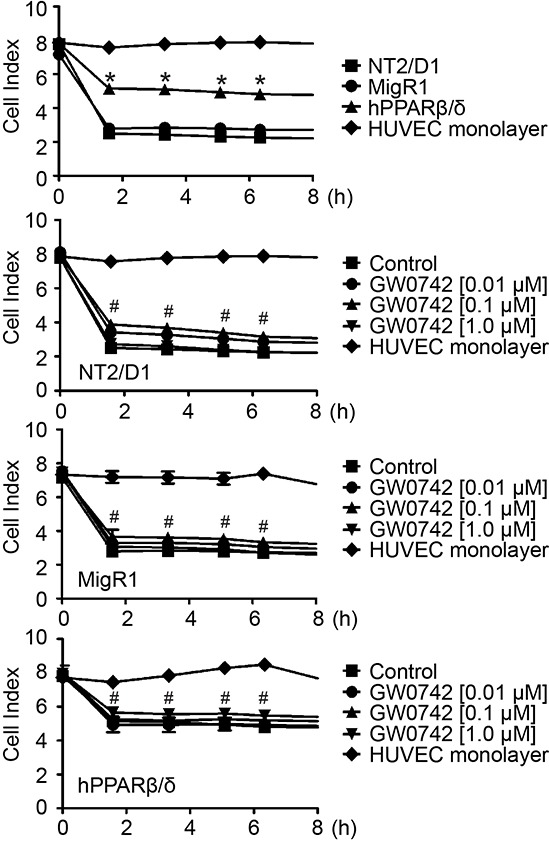
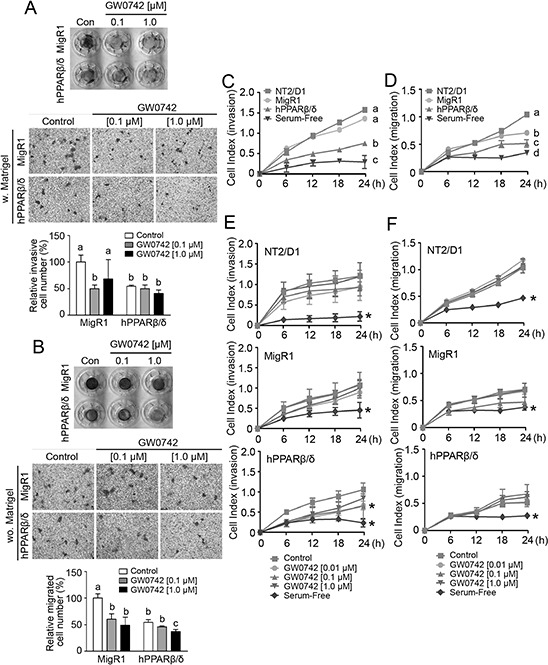
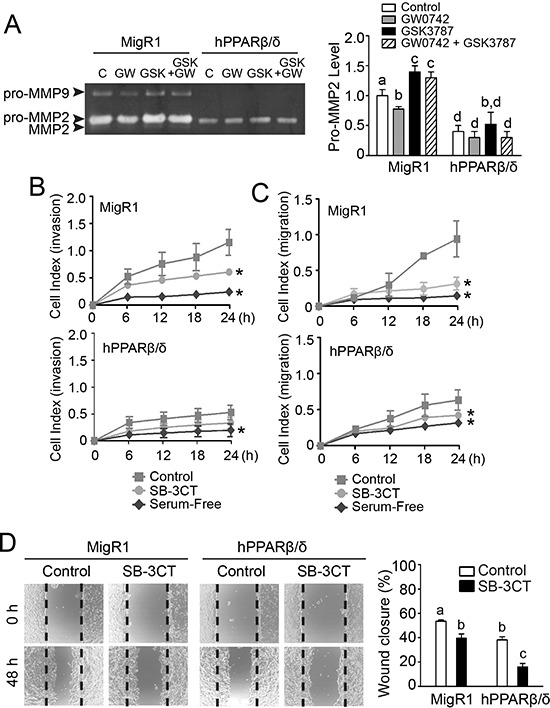
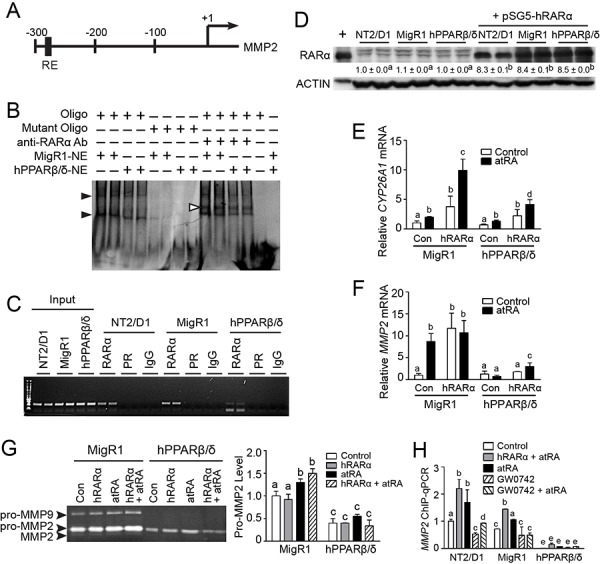
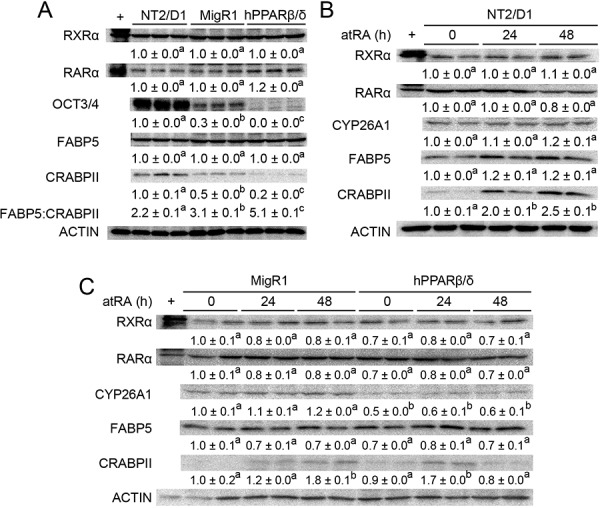
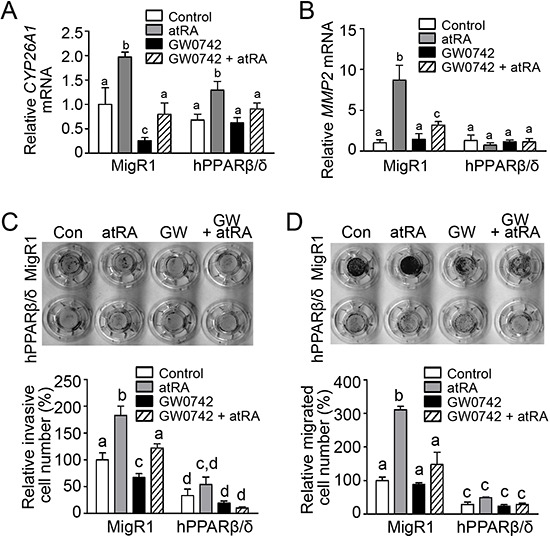
Peroxisome proliferator-activated receptor-β/δ (PPARβ/δ) has important physiological functions in control of cell growth, lipid and glucose homeostasis, differentiation and inflammation. To investigate the role of PPARβ/δ in cancer, stable human testicular embryonal carcinoma cell lines were developed that constitutively express PPARβ/δ. Expression of PPARβ/δ caused enhanced activation of the receptor, and this significantly decreased proliferation, migration, invasion, anchorage-independent growth, and also reduced tumor mass and volume of ectopic xenografts derived from NT2/D1 cells compared to controls. The changes observed in xenografts were associated with decreased PPARβ/δ-dependent expression of proliferating cell nuclear antigen and octamer-binding transcription factor-3/4, suggesting suppressed tumor proliferation and induction of differentiation. Inhibition of migration and invasion was mediated by PPARβ/δ competing with formation of the retinoic acid receptor (RAR)/retinoid X receptor (RXR) complex, resulting in attenuation of RARα-dependent matrix metalloproteinase-2 expression and activity. These results demonstrate that PPARβ/δ mediates attenuation of human testicular embryonal carcinoma cell progression through a novel RAR-dependent mechanism and suggest that activation of PPARβ/δ inhibits RAR/RXR dimerization and represents a new therapeutic strategy.

Keywords: matrix metalloproteinase-2; peroxisome proliferator-activated receptor-β/δ; retinoic acid receptor; testicular embryonal carcinoma; tumorigenicity.


Conflict of interest statement

CONFLICTS OF INTEREST

All authors have no perceived conflicts of interest to disclose.

Figures

Figure 1
Figure 1. PPARβ/δ inhibits proliferation of human testicular embryonal carcinoma NT2/D1 cells
A. Representative photomicrographs of NT2/D1, NT2/D1-MigR1 (MigR1, vector control) and NT2/D1-hPPARβ/δ (hPPARβ/δ) cells showing positive eGFP signals in MigR1 and hPPARβ/δ cells. PI staining indicates nuclei. Magnification = 600X. Bar = 10 μm. B. Quantitative western blot analysis of PPARβ/δ expression in NT2/D1, MigR1 and hPPARβ/δ cells. +, positive control (cell lysate from COS1 cells transfected with human PPARβ/δ expression vector). Relative PPARβ/δ expression was normalized to LDH. C. Relative ANGPTL4 mRNA expression as compared to NT2/D1 cells with or without the PPARβ/δ agonist GW0742. D. Real-time proliferation of NT2/D1, MigR1 and hPPARβ/δ cells. Values represent mean ± S.E.M. Values with different superscript letters are significantly different at p ≤ 0.05. *Significantly different than control, p ≤ 0.05.
Figure 2
Figure 2. Characterization of human testicular embryonal carcinoma cell line Tera2 over-expressing PPARβ/δ
A. Representative photomicrographs of Tera2, MigR1 and hPPARβ/δ cells showing positive eGFP signals in MigR1 and hPPARβ/δ cells. PI staining indicates cell nuclei. Magnification = 600X. Bar = 10 μm. B. Quantitative western blot analysis of PPARβ/δ expression in Tera2, MigR1 and hPPARβ/δ cells. +, positive control (cell lysate from COS1 cells transfected with human PPARβ/δ expression vector). Relative PPARβ/δ expression was normalized to LDH. C. Cells were treated with the PPARβ/δ agonist GW0742 for 24 hours. ANGPTL4 mRNA expression was determined by qPCR and compared to the parent cell line. D. Real-time proliferation was examined in Tera2, MigR1 and hPPARβ/δ cells. E. Activities of MMP2 and MMP9 in Tera2, MigR1 and hPPARβ/δ cells were determined by zymography. Values represent mean ± S.E.M. Values with different superscript letters are significantly different at p ≤ 0.05. *Significantly different than control, p ≤ 0.05.
Figure 3
Figure 3. PPARβ/δ inhibits MMP activities and anchorage-independent clonogenicity of human testicular embryonal carcinoma NT2/D1 cells
A. Left panel, anchorage-dependent clonogenicity of NT2/D1, MigR1 or hPPARβ/δ cells treated with or without GW0742. Right panel, plating efficiency and survival fraction of anchorage-dependent clonogenicity assay. B. Anchorage-independent clonogenicity of MigR1 and hPPARβ/δ cells with or without GW0742. C. Representative photomicrographs of colonies on soft agar (Magnification = 200X). D. Quantification of colonies, diameter of the colonies, and the size of the colonies on soft agar. E. Activities of MMP2 and MMP9 in NT2/D1, MigR1 and hPPARβ/δ cells. Values represent the mean ± S.E.M. Values with different superscript letters are significantly different at p ≤ 0.05. *Significantly different than control, p ≤ 0.05.
Figure 4
Figure 4. PPARβ/δ attenuates tumor growth in testicular cancer xenografts by inducing necrosis
A. Representative photomicrographs of xenografts derived from NT2/D1-MigR1 (MigR1) and NT2/D1-hPPARβ/δ (hPPARβ/δ) cells. B. Average tumor volumes over time. C. Average tumor weight at the end of the study. D. Average tumor area in paraffin-embedded tumor sections. E. Representative photomicrographs of H&E-stained xenografts. The nuclei of tumor cells were large, pleomorphic and round to spindle, and mitotic figures (white arrows) were frequently observed. Necrotic areas are marked with a yellow dashed line. Magnification = 12.5X (left) and 400X (right). F. Average percentage of necrotic area normalized by total tumor area in tumor sections. G. Apoptosis in xenograft tumors was determined by TUNEL assay. Left panel, apoptotic tumor cells were indicated by arrowheads. Magnification = 1000X. Bar = 10 μm. Right panel, quantification of apoptotic index in tumor sections. Control = (Con); GW0742-treated (2.5 mg/kg/day) = (GW). Values represent the mean ± S.E.M. Values with different superscript letters are significantly different at p ≤ 0.05.
Figure 5
Figure 5. PPARβ/δ induces differentiation and inhibits proliferation in testicular cancer xenografts
A. the expression of PPARβ/δ, OCT3/4 and PCNA of tumors were determined by quantitative western blot analysis. +, positive control (cell lysate from COS1 cells transfected with human PPARβ/δ expression vector). Relative expression of target protein was normalized to LDH. B. ANGPTL4 and C. OCT3/4 mRNA expression in xenografts. D, E. Left panel, representative photomicrographs of xenografts showing the expression of PCNA and OCT3/4 (arrowheads), respectively, assessed by immunohistochemistry. Magnification = 1000X. Bar = 10 μm. D, E. Right panel, quantification of PCNA and OCT3/4 in xenografts. Control = (Con); GW0742-treated (2.5 mg/kg/day) = (GW). Values represent the mean ± S.E.M. Values with different superscript letters are significantly different at p ≤ 0.05.
Figure 6
Figure 6. Over-expression of PPARβ/δ decreases testicular cancer cell invasion of a HUVEC monolayer
Testicular cancer cell-endothelial cell interaction was detected in real-time using an xCELLigence system. NT2/D1 cell lines were seeded on top of HUVEC monolayer, and cell index was recorded up to 8 hours. Over-expression of PPARβ/δ increased the cell index, indicating a suppression of cell invasion through the HUVEC monolayer. No changes in cell index were observed among NT2/D1 cell lines following GW0742 treatment. Values represent mean ± S.E.M. *Significantly different than NT2/D1 cell control, p ≤ 0.05. #Significantly different than the HUVEC negative control, p ≤ 0.05.
Figure 7
Figure 7. PPARβ/δ inhibits invasion and migration of NT2/D1 cells
A. Upper panel, representative photographs of transwell inserts in invasion assay. A. Middle panel, representative photomicrographs of invasive cells on the lower surface of the transwell inserts. Magnification = 200X. A. Lower panel, quantification of invasive cells normalized to NT2/D1-MigR1 (MigR1) control group. B. Upper panel, representative photographs of transwell inserts in migration assay. B. Middle panel, representative photomicrographs of migrated cells on the lower surface of the transwell inserts. Magnification = 200X. B. Lower panel, quantification of migrated cells normalized to MigR1 control group. w: with matrigel; wo: without matrigel. C, D. Real-time invasion or migration, respectively, in NT2/D1, MigR1 and NT2/D1-hPPARβ/δ (hPPARβ/δ) cells. E, F. Real-time invasion and migration, respectively, of NT2/D1, MigR1 and hPPARβ/δ cells with or without GW0742. Serum-free cells were the negative control. Values represent the mean ± S.E.M. Values with different superscript letters are significantly different at p ≤ 0.05. *Significantly different than control, p ≤ 0.05.
Figure 8
Figure 8. PPARβ/δ-dependent attenuation of MMP2-mediated invasion and migration of NT2/D1 cells
A. Left panel, activities of MMP2 and MMP9 in NT2/D1-MigR1 (MigR1) and NT2/D1-hPPARβ/δ (hPPARβ/δ) cells treated with vehicle control (C) GW0742 (GW), and/or GSK3787 (GSK). Right panel, relative activity of pro-MMP2. B, C. Real-time invasion or migration of MigR1 and hPPARβ/δ cells in response to SB-3CT. D. Left panel, representative photomicrographs of wound-healing migration assay in MigR1 and hPPARβ/δ cells in response to SB-3CT treatment and, right panel, the average percentage of wound closure after 48 h. Values represent the mean ± S.E.M. Values with different superscript letters are significantly different at p ≤ 0.05. *Significantly different than control, p ≤ 0.05.
Figure 9
Figure 9. PPARβ/δ suppresses MMP2 activity by interfering with RAR signaling
A. A putative RAR RE in the human MMP2 promoter. +1 represented the transcriptional start site. B. Representative EMSA of nuclear extracts from NT2/D1-MigR1 (MigR1) and NT2/D1-hPPARβ/δ (hPPARβ/δ) cells were incubated with either double-stranded oligonucleotides (oligo) encoding the RAR RE MMP2 promoter or mutated oligonucleotides (mutant oligo). Black arrowheads indicated the presence of oligonucleotide-protein complexes. White arrowheads indicated the super shift of oligonucleotide-protein-anti-RAR-antibody complexes. C. Representative photomicrograph of the ChIP assay for RAR occupancy on the MMP2 promoter. D. RARα protein expression in NT2/D1, MigR1 and hPPARβ/δ cells transiently transfected with pSG5-RARα plasmid. E, F. CYP26A1 and MMP2 mRNA expression in MigR1 and hPPARβ/δ cells or cells transiently over-expressing RARα after atRA treatment, respectively. G. Left panel, activities of MMP2 and MMP9 in MigR1 and hPPARβ/δ cells transiently over-expressing RAR after atRA treatment, right panel, relative activity of pro-MMP2 in MigR1 and hPPARβ/δ cells. H. ChIP-qPCR showing effect of PPARβ/δ on RARα occupancy on MMP2 promoter in cells over-expressing PPARβ/δ or RARα following atRA and/or GW0742 treatment. Values represent mean ± S.E.M. Values with different superscript letters are significantly different at p ≤ 0.05.
Figure 10
Figure 10. PPARβ/δ interferes with atRA-stimulated signaling in NT2/D1 cells
A. Quantitative western blot analysis of RXRα, RARα, OCT3/4, FABP5 and CRABPII expression in NT2/D1, NT2/D1-MigR1 (MigR1) and NT2/D1-hPPARβ/δ (hPPARβ/δ) cells. B, C. Quantitative western blot analysis of RXRα, RARα, CYP26A1, FABP5 and CRABPII expression in NT2/D1, MigR1 and hPPARβ/δ cells in response to atRA treatment. Values represent mean ± S.E.M. Values with different superscript letters are significantly different at p ≤ 0.05.
Figure 11
Figure 11. PPARβ/δ interferes with atRA-mediated invasion and migration in NT2/D1 cells
A, B. CYP26A1 and MMP2 mRNA expression in MigR1 and hPPARβ/δ cells following atRA treatment were determined by qPCR, respectively. C, D. Upper panel, representative photographs of transwell inserts in invasion or migration assay, respectively, in MigR1 or hPPARβ/δ cells in response to atRA and/or GW0742 treatment, and lower panel, quantification of invasive or migrated cells, respectively, normalized to MigR1 control group. Values represent mean ± S.E.M. Values with different superscript letters are significantly different at p ≤ 0.05.

Similar articles

Cited by

References

    1. Holmes L, Jr., Escalante C, Garrison O, Foldi BX, Ogungbade GO, Essien EJ, Ward D. Testicular cancer incidence trends in the USA (1975-2004): plateau or shifting racial paradigm? Public Health. 2008;122:862–872. - PMC - PubMed
    1. Osswald M, Harlan LC, Penson D, Stevens JL, Clegg LX. Treatment of a population based sample of men diagnosed with testicular cancer in the United States. Urologic oncology. 2009;27:604–610. - PMC - PubMed
    1. Voutsadakis IA. The chemosensitivity of testicular germ cell tumors. Cellular oncology. 2014;37:79–94. - PubMed
    1. Boublikova L, Buchler T, Stary J, Abrahamova J, Trka J. Molecular biology of testicular germ cell tumors: unique features awaiting clinical application. Critical reviews in oncology/hematology. 2014;89:366–385. - PubMed
    1. Bahrami A, Ro JY, Ayala AG. An overview of testicular germ cell tumors. Archives of pathology & laboratory medicine. 2007;131:1267–1280. - PubMed

Publication types