

Improving the Health Forecasting Alert System for Cold Weather and Heat-Waves In England: A Proof-of-Concept Using Temperature-Mortality Relationships
- PMID: 26431427
- PMCID: PMC4592211
- DOI: 10.1371/journal.pone.0137804
Improving the Health Forecasting Alert System for Cold Weather and Heat-Waves In England: A Proof-of-Concept Using Temperature-Mortality Relationships
Abstract
Objectives: In this study a prototype of a new health forecasting alert system is developed, which is aligned to the approach used in the Met Office's (MO) National Severe Weather Warning Service (NSWWS). This is in order to improve information available to responders in the health and social care system by linking temperatures more directly to risks of mortality, and developing a system more coherent with other weather alerts. The prototype is compared to the current system in the Cold Weather and Heatwave plans via a case-study approach to verify its potential advantages and shortcomings.
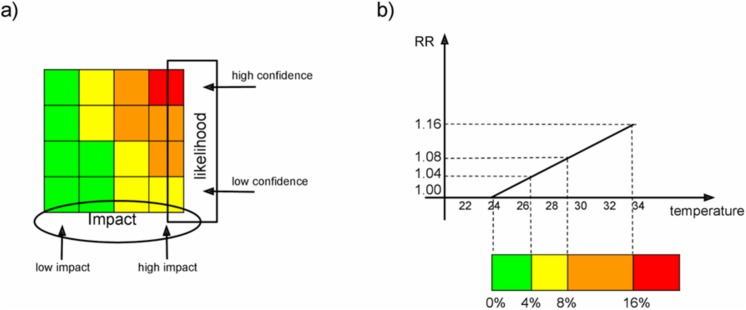
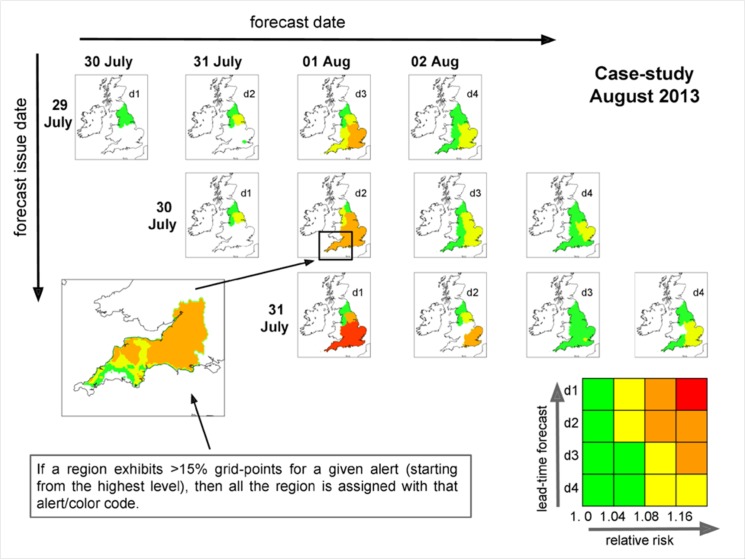
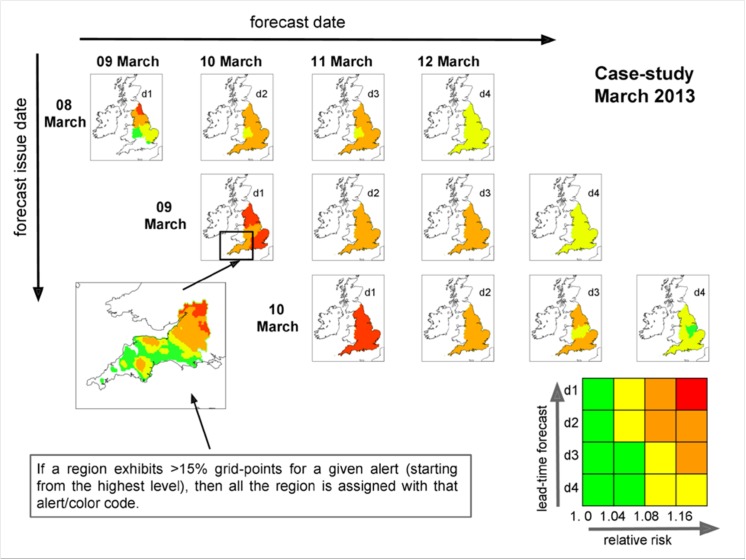
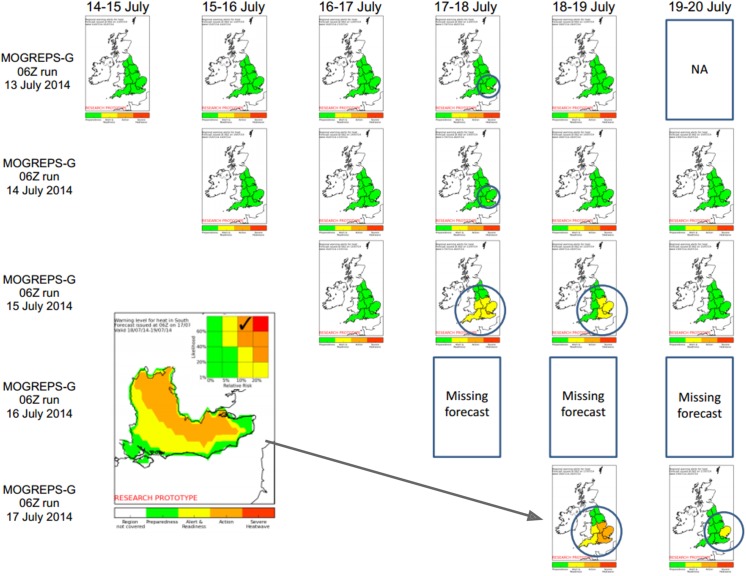
Method: The prototype health forecasting alert system introduces an "impact vs likelihood matrix" for the health impacts of hot and cold temperatures which is similar to those used operationally for other weather hazards as part of the NSWWS. The impact axis of this matrix is based on existing epidemiological evidence, which shows an increasing relative risk of death at extremes of outdoor temperature beyond a threshold which can be identified epidemiologically. The likelihood axis is based on a probability measure associated with the temperature forecast. The new method is tested for two case studies (one during summer 2013, one during winter 2013), and compared to the performance of the current alert system.
Conclusions: The prototype shows some clear improvements over the current alert system. It allows for a much greater degree of flexibility, provides more detailed regional information about the health risks associated with periods of extreme temperatures, and is more coherent with other weather alerts which may make it easier for front line responders to use. It will require validation and engagement with stakeholders before it can be considered for use.
Conflict of interest statement
Figures
Similar articles
-
Forecast skill assessment of an operational continental heat-cold-health forecasting system: New avenues for health early warning systems.Sci Adv. 2024 Nov 15;10(46):eado5286. doi: 10.1126/sciadv.ado5286. Epub 2024 Nov 13. Sci Adv. 2024. PMID: 39536112 Free PMC article.
-
Public health vulnerability to wintertime weather: time-series regression and episode analyses of national mortality and morbidity databases to inform the Cold Weather Plan for England.Public Health. 2016 Aug;137:26-34. doi: 10.1016/j.puhe.2015.12.015. Epub 2016 Feb 9. Public Health. 2016. PMID: 26869382
-
Exploratory analysis of seasonal mortality in England and Wales, 1998 to 2007.Health Stat Q. 2010 Winter;(48):58-80. doi: 10.1057/hsq.2010.21. Health Stat Q. 2010. PMID: 21131987
-
Is There a Need to Integrate Human Thermal Models with Weather Forecasts to Predict Thermal Stress?Int J Environ Res Public Health. 2019 Nov 19;16(22):4586. doi: 10.3390/ijerph16224586. Int J Environ Res Public Health. 2019. PMID: 31752444 Free PMC article. Review.
-
The potential impacts of climate variability and change on temperature-related morbidity and mortality in the United States.Environ Health Perspect. 2001 May;109 Suppl 2(Suppl 2):185-9. doi: 10.1289/ehp.109-1240665. Environ Health Perspect. 2001. PMID: 11359685 Free PMC article. Review.
Cited by
-
Adversity of prolonged extreme cold exposure among adult clients diagnosed with coronary artery diseases: a primer for recommending community health nursing intervention.Nurs Open. 2017 Dec 23;5(1):62-69. doi: 10.1002/nop2.111. eCollection 2018 Jan. Nurs Open. 2017. PMID: 29344396 Free PMC article.
-
Perceptions regarding utilization of meteorological information in healthcare in Korea: a qualitative study.Ann Occup Environ Med. 2018 Feb 1;30:8. doi: 10.1186/s40557-018-0214-3. eCollection 2018. Ann Occup Environ Med. 2018. PMID: 29435339 Free PMC article.
-
Health effects of milder winters: a review of evidence from the United Kingdom.Environ Health. 2017 Dec 5;16(Suppl 1):109. doi: 10.1186/s12940-017-0323-4. Environ Health. 2017. PMID: 29219101 Free PMC article. Review.
-
Effective interventions on health effects of Chinese rural elderly under heat exposure.Front Environ Sci Eng. 2022;16(5):66. doi: 10.1007/s11783-022-1545-4. Epub 2022 May 25. Front Environ Sci Eng. 2022. PMID: 35693986 Free PMC article.
-
A heat-health watch and warning system with extended season and evolving thresholds.BMC Public Health. 2021 Jul 29;21(1):1479. doi: 10.1186/s12889-021-10982-8. BMC Public Health. 2021. PMID: 34325687 Free PMC article.
References
-
- Basu R. & Samet J.M. Relation between elevated ambient temperature and mortality: a review of the epidemiologic evidence. Epidemiol Rev 2002;24:190–202. - PubMed
Publication types
MeSH terms
LinkOut - more resources
Full Text Sources
Other Literature Sources
Miscellaneous
