

Nodal metastasis in cervical cancer occurs in clearly delineated fields of immune suppression in the pelvic lymph catchment area
- PMID: 26431490
- PMCID: PMC4741707
- DOI: 10.18632/oncotarget.5398
Nodal metastasis in cervical cancer occurs in clearly delineated fields of immune suppression in the pelvic lymph catchment area
Abstract
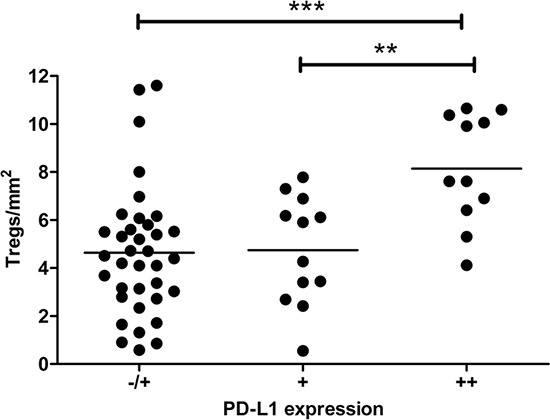
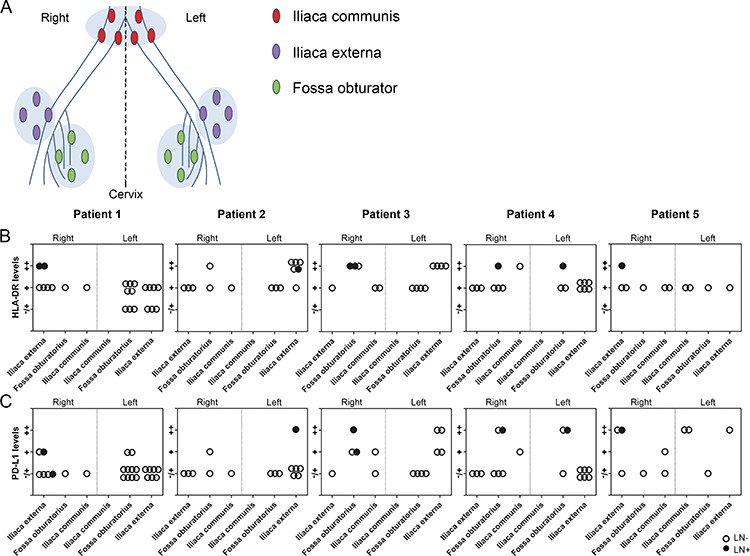
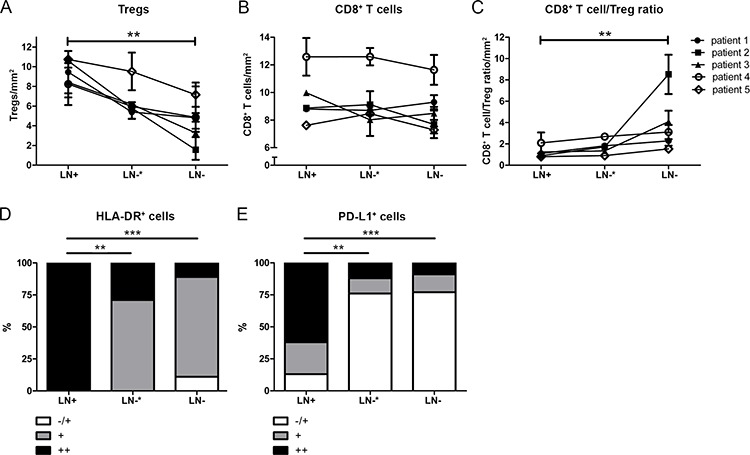
In cervical cancer, high frequencies of regulatory T cells (Tregs) and immunosuppressive PD-L1+CD14+ antigen-presenting cells dominate the microenvironment of tumor-positive lymph nodes (LN+). It is unknown whether this is restricted to LN+ or precedes metastasis, emanating from the primary tumor and spreading through tumor-draining lymph nodes (TDLNs). To investigate immunosuppression in the lymphatic basin of cervical tumors, all dissected TDLNs of five cervical cancer patients (in total 9 LN+ and 74 tumor-negative lymph nodes (LN-)) were analyzed for FoxP3+ Tregs, CD8+ T cells, HLA-DR+- and PD-L1+ myeloid cells by immunohistochemistry.Tregs and PD-L1+ cells were found to form an immunosuppressive cordon around metastatic tumor cells. Importantly, whereas high HLA-DR+- and PD-L1+ cell rates were strongly associated with LN+, elevated Treg levels and decreased CD8+ T cell/Treg ratios were found similar in LN+ and adjacent LN-, as compared to LN- at more distant anatomical localizations. These data suggest that delineated fields of Treg-associated immune suppression in anatomically co-localized TDLNs enable metastasis by creating metastatic niches. This may be of importance for decision-making regarding (surgical) intervention in cervical cancer. Future efforts should include the implementation of immunotherapeutic regimens to overcome this immune suppression, establish loco-regional control and halt systemic tumor spread.
Keywords: Immune response; Immunity; Immunology and Microbiology Section; PD-L1-myeloid cells; cervical cancer; metastatic niche; tregs; tumor-draining lymph nodes.
Conflict of interest statement
None declared.
Figures


Similar articles
-
High and interrelated rates of PD-L1+CD14+ antigen-presenting cells and regulatory T cells mark the microenvironment of metastatic lymph nodes from patients with cervical cancer.Cancer Immunol Res. 2015 Jan;3(1):48-58. doi: 10.1158/2326-6066.CIR-14-0149. Epub 2014 Oct 31. Cancer Immunol Res. 2015. PMID: 25361854
-
Immune-checkpoint status in penile squamous cell carcinoma: a North American cohort.Hum Pathol. 2017 Jan;59:55-61. doi: 10.1016/j.humpath.2016.09.003. Epub 2016 Sep 20. Hum Pathol. 2017. PMID: 27663086
-
Metastatic tumour cells favour the generation of a tolerogenic milieu in tumour draining lymph node in patients with early cervical cancer.Cancer Immunol Immunother. 2009 Sep;58(9):1363-73. doi: 10.1007/s00262-008-0646-7. Epub 2009 Jan 27. Cancer Immunol Immunother. 2009. PMID: 19172271 Free PMC article.
-
Lymphatic system regulation of anti-cancer immunity and metastasis.Front Immunol. 2024 Aug 15;15:1449291. doi: 10.3389/fimmu.2024.1449291. eCollection 2024. Front Immunol. 2024. PMID: 39211044 Free PMC article. Review.
-
Immune microenvironment of tumor-draining lymph nodes: insights for immunotherapy.Front Immunol. 2025 Apr 11;16:1562797. doi: 10.3389/fimmu.2025.1562797. eCollection 2025. Front Immunol. 2025. PMID: 40292299 Free PMC article. Review.
Cited by
-
Impact of examined lymph node number on lymph node status and prognosis in FIGO stage IB-IIA cervical squamous cell carcinoma: A population-based study.Front Oncol. 2022 Sep 20;12:994105. doi: 10.3389/fonc.2022.994105. eCollection 2022. Front Oncol. 2022. PMID: 36203444 Free PMC article.
-
T- and NK-cell populations with regulatory phenotype and markers of apoptosis in circulating lymphocytes of patients with CIN3 or microcarcinoma of the cervix: evidence for potential mechanisms of immune suppression.Infect Agent Cancer. 2017 Oct 17;12:56. doi: 10.1186/s13027-017-0166-1. eCollection 2017. Infect Agent Cancer. 2017. PMID: 29075318 Free PMC article.
-
Potential role of radiation therapy in augmenting the activity of immunotherapy for gynecologic cancers.Cancer Manag Res. 2017 Oct 31;9:553-563. doi: 10.2147/CMAR.S116683. eCollection 2017. Cancer Manag Res. 2017. PMID: 29184441 Free PMC article. Review.
-
Immune Checkpoint Blockade in Gynecologic Cancers: State of Affairs.Cancers (Basel). 2020 Nov 9;12(11):3301. doi: 10.3390/cancers12113301. Cancers (Basel). 2020. PMID: 33182298 Free PMC article. Review.
-
A review of the research progress in T-lymphocyte immunity and cervical cancer.Transl Cancer Res. 2020 Mar;9(3):2026-2036. doi: 10.21037/tcr.2020.01.33. Transl Cancer Res. 2020. PMID: 35117549 Free PMC article. Review.
References
-
- Karim R, Jordanova ES, Piersma SJ, Kenter GG, Chen L, Boer JM, Melief CJ, van der Burg SH. Tumor-expressed B7-H1 and B7-DC in relation to PD-1+ T-cell infiltration and survival of patients with cervical carcinoma. Clin Cancer Res. 2009;15:6341–6347. - PubMed
-
- Munn DH, Mellor AL. The tumor-draining lymph node as an immune-privileged site. Immunol Rev. 2006;213:146–158. - PubMed
-
- Mellor AL, Munn DH. Creating immune privilege: active local suppression that benefits friends, but protects foes. Nat Rev Immunol. 2008;8:74–80. - PubMed
Publication types
MeSH terms
Substances
LinkOut - more resources
Full Text Sources
Other Literature Sources
Medical
Molecular Biology Databases
Research Materials
