. 2015 Oct 2;35(6):e00267.
doi: 10.1042/BSR20150194.

MELK-T1, a small-molecule inhibitor of protein kinase MELK, decreases DNA-damage tolerance in proliferating cancer cells

Affiliations

MELK-T1, a small-molecule inhibitor of protein kinase MELK, decreases DNA-damage tolerance in proliferating cancer cells

Lijs Beke et al. Biosci Rep. .

Erratum in

Abstract

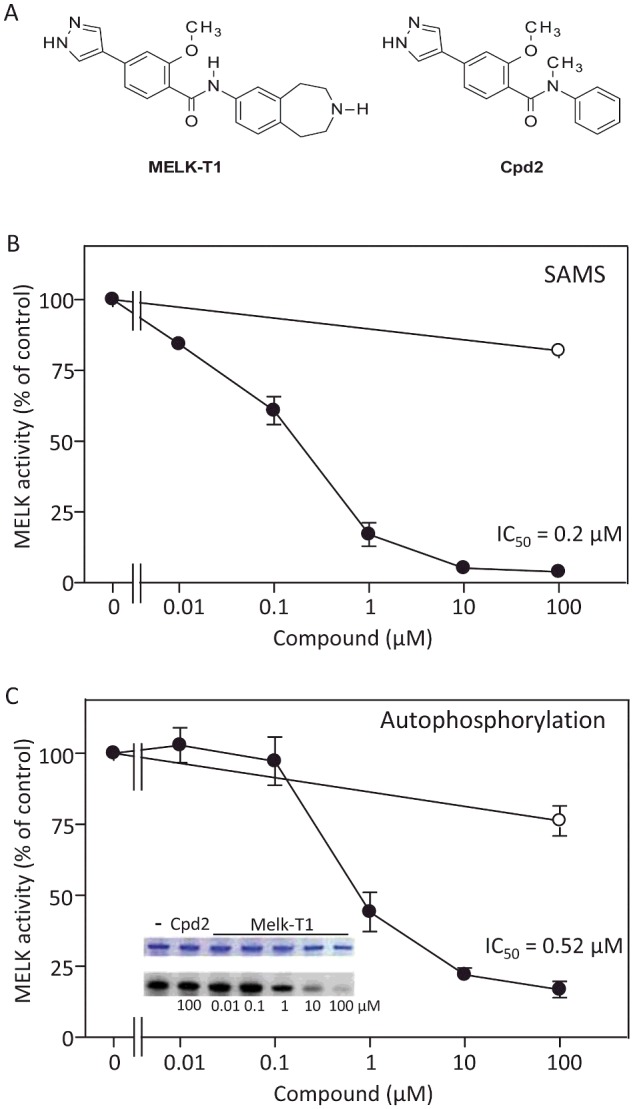
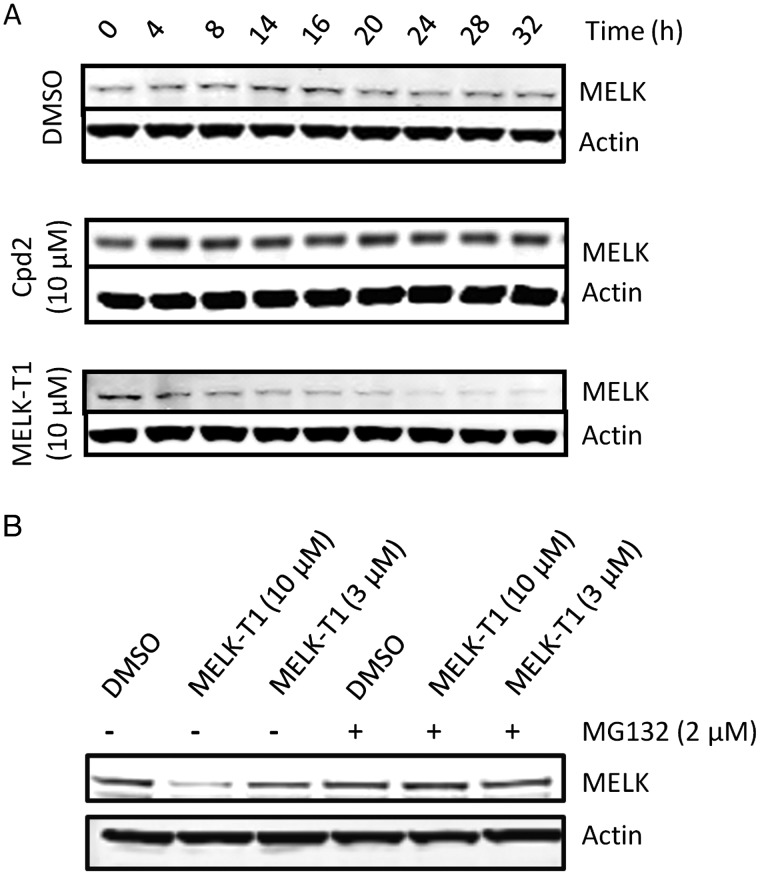
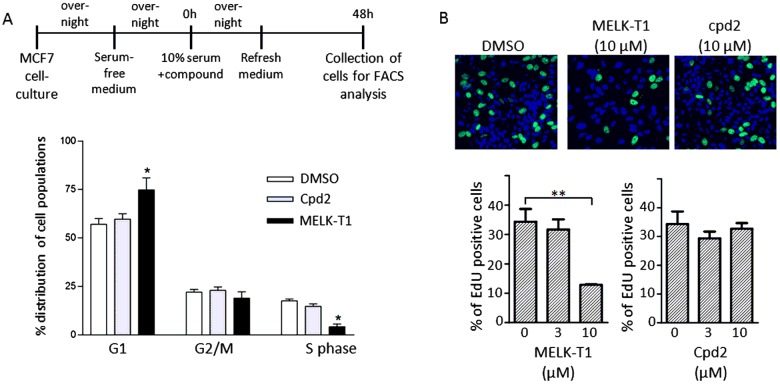
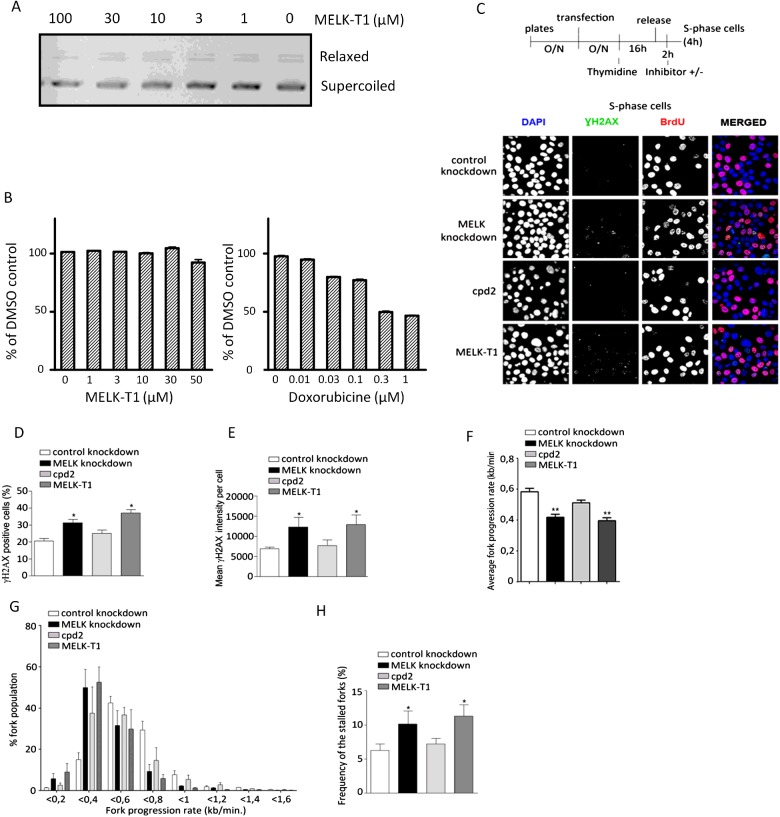
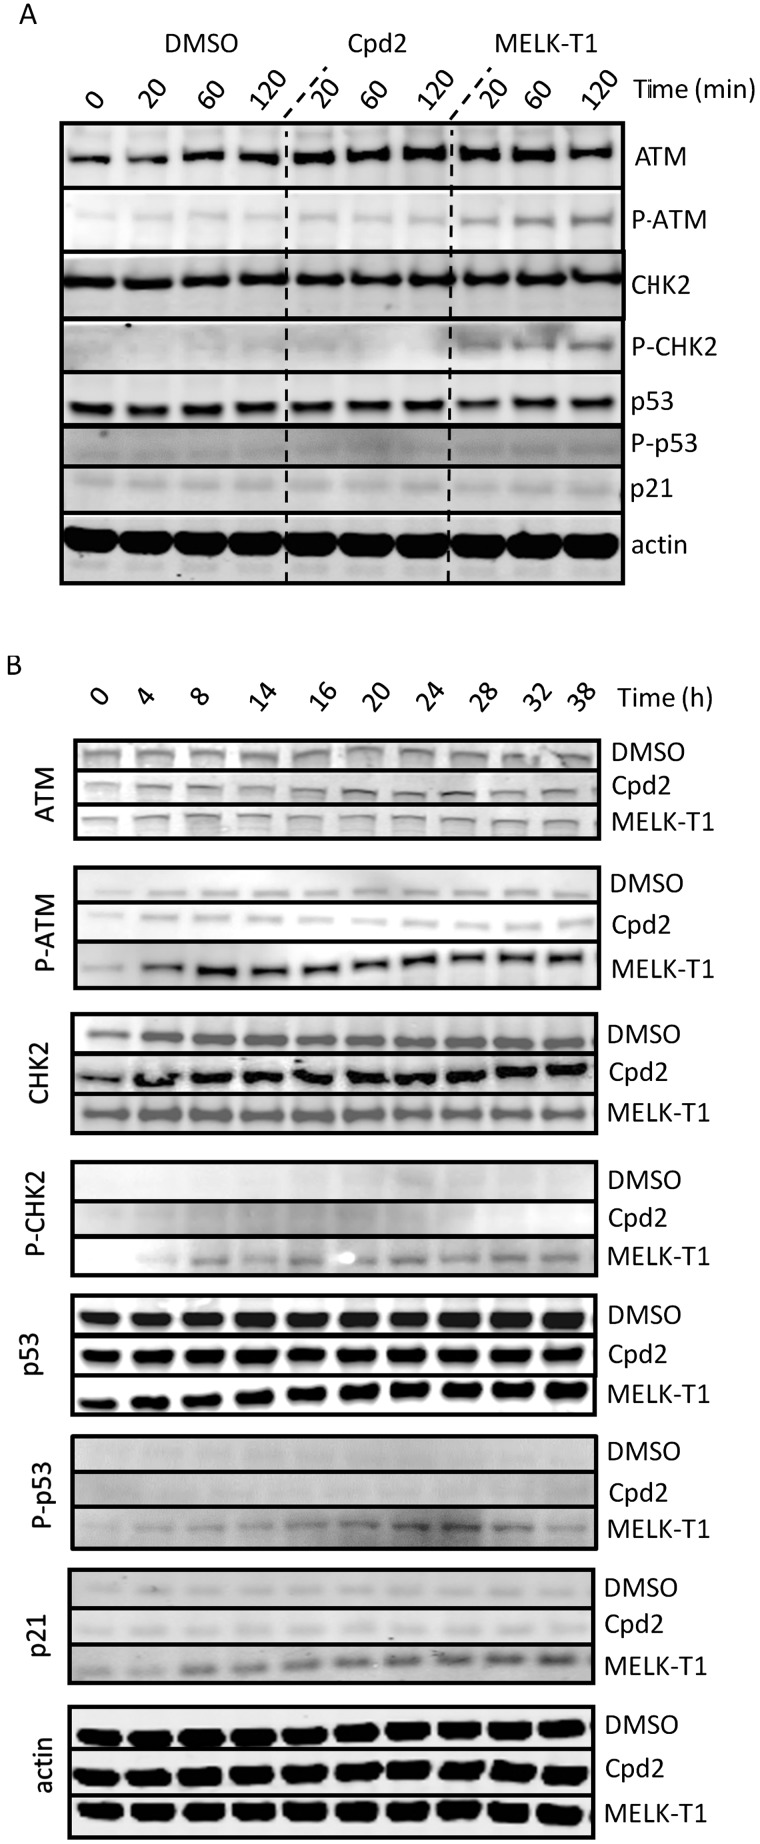
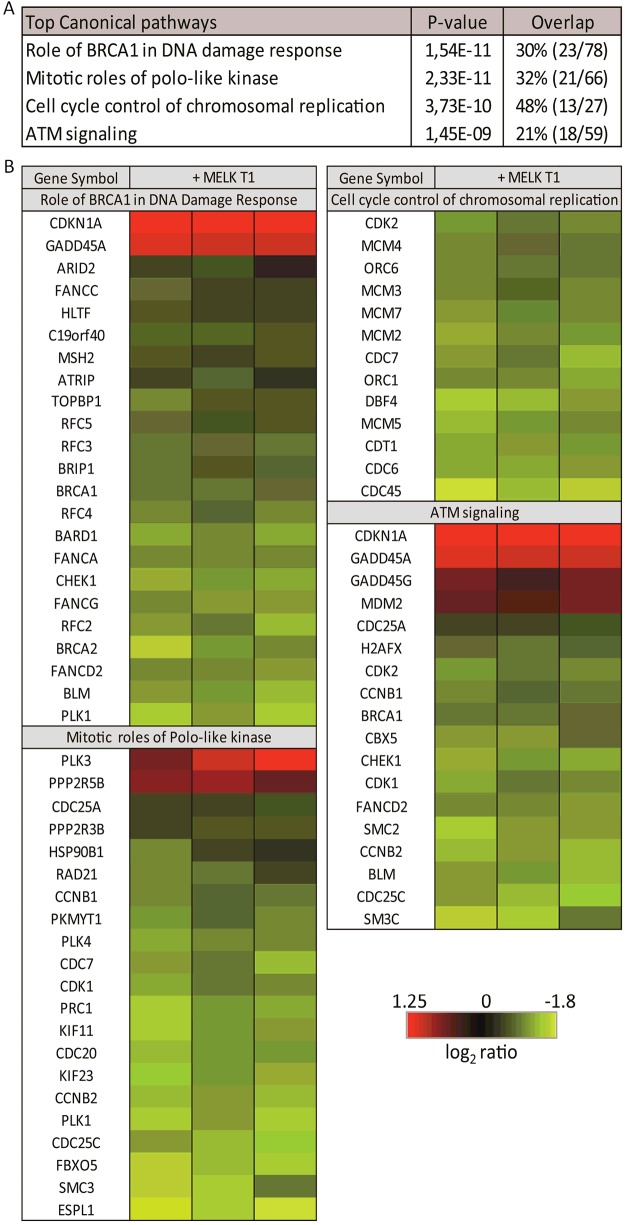
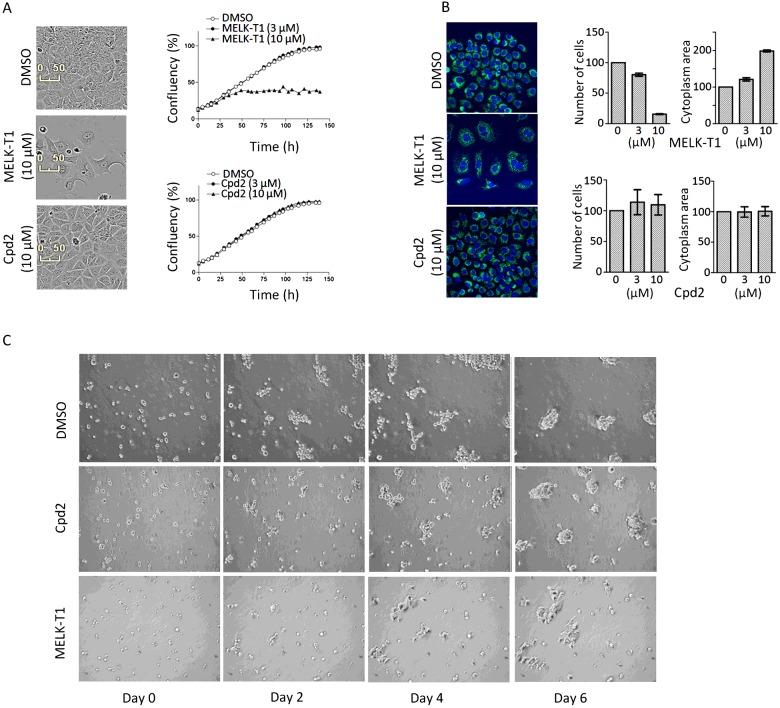
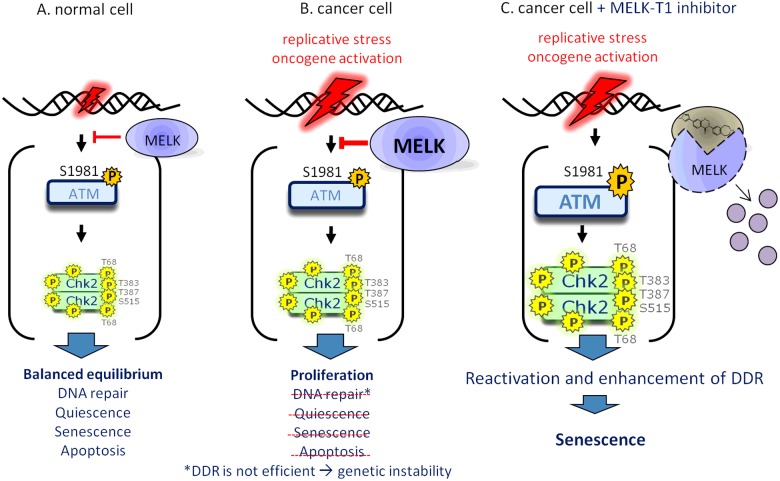
Maternal embryonic leucine zipper kinase (MELK), a serine/threonine protein kinase, has oncogenic properties and is overexpressed in many cancer cells. The oncogenic function of MELK is attributed to its capacity to disable critical cell-cycle checkpoints and reduce replication stress. Most functional studies have relied on the use of siRNA/shRNA-mediated gene silencing. In the present study, we have explored the biological function of MELK using MELK-T1, a novel and selective small-molecule inhibitor. Strikingly, MELK-T1 triggered a rapid and proteasome-dependent degradation of the MELK protein. Treatment of MCF-7 (Michigan Cancer Foundation-7) breast adenocarcinoma cells with MELK-T1 induced the accumulation of stalled replication forks and double-strand breaks that culminated in a replicative senescence phenotype. This phenotype correlated with a rapid and long-lasting ataxia telangiectasia-mutated (ATM) activation and phosphorylation of checkpoint kinase 2 (CHK2). Furthermore, MELK-T1 induced a strong phosphorylation of p53 (cellular tumour antigen p53), a prolonged up-regulation of p21 (cyclin-dependent kinase inhibitor 1) and a down-regulation of FOXM1 (Forkhead Box M1) target genes. Our data indicate that MELK is a key stimulator of proliferation by its ability to increase the threshold for DNA-damage tolerance (DDT). Thus, targeting MELK by the inhibition of both its catalytic activity and its protein stability might sensitize tumours to DNA-damaging agents or radiation therapy by lowering the DNA-damage threshold.

Keywords: chemical biology; deoxyribonucleic acid (DNA) damage response; maternal embryonic leucine zipper kinase (MELK) kinase; senescence; small molecule inhibitors.


Figures

Figure 1
Figure 1. Inhibition of MELK by MELK-T1
(A) Structures of MELK-T1 and Cpd2. (B) Dose-response curves of MELK-T1 (●) and Cpd2 (○) for the inhibition of EGFP–MELK in an in vitro kinase assay with SAMS peptide as substrate. The results from three independent experiments were expressed as mean ± S.E.M. (C) Inhibition of MELK autophosphorylation by MELK-T1. Dose-response curves of MELK-T1 (●) and Cpd2 (○) were calculated by measuring the corresponding band intensities obtained by autoradiography (inset shows representative autoradiogram and corresponding Coomassie stained gel). Band intensity values were normalized against the corresponding bands obtained from Coomassie stained gel. The results are expressed as mean ± S.E.M. (n=3).
Figure 2
Figure 2. MELK-T1 triggers the proteasome-mediated degradation of MELK protein
(A) Immunoblot analysis of MELK and actin levels in lysates of compound-treated MCF-7 cells for the indicated times. (B) Immunoblot of MELK and actin levels in lysates of MCF-7 cells that were pre-treated with 2 μM of the proteasome inhibitor MG132 for 1 h before addition of the indicated compound for 6 h. The blots are representative for three experiments.
Figure 3
Figure 3. MELK-T1 induces a delay in the progression of MCF-7 cells through S-phase
(A) Time-line showing the treatments and the incubation periods used for MCF-7 cell cultures. The histograms show the cell-phase distribution of MCF-7 cells that were treated as explained in the time-line. Results are expressed as percentage changes (mean ± S.E.M.; n=3), *P<0.05. (B) Representative immunohistochemistry images of MCF-7 cells treated with the indicated compounds for 96 h showing EdU incorporation (green) and Hoechst staining (blue). The percentage of positively stained EdU cells was normalized to the percentage of positively stained EdU cells of the DMSO control condition (0 μM). The results are expressed as mean ± S.D. (n=3), **P<0.01.
Figure 4
Figure 4. Effects of MELK-T1 on DNA structure and replication
(A) The agarose gel shows a DNA-mobility shift assay performed with the indicated concentrations of MELK-T1. (B) An in vitro DNA intercalation assay was performed taking doxorubicin, a known DNA intercalator, as a positive control. Fluorescence measurements of an ethidium bromide competition assay were performed with a concentration range of MELK-T1 and doxorubicin. The results (percentage of DMSO control) are expressed as mean ± S.D. (n=3). (C) Schematic of the procedure used to synchronize MCF-7 cells in S-phase. The cells were incubated with BrdU (30 μg/ml) for 45 min before fixation. O/N, overnight. Representative images from confocal microscopy showing γH2A.X, BrdU and DAPI staining in cells treated as illustrated in the time-line. (D) Quantification of the number of γH2A.X positive cells (percentage of total). At least 300 cells were counted in each condition. Cells with five or more foci were considered γH2A.X positive. The results are expressed as mean ± S.E.M. (n=3). *P<0.05. (E) Comparison of the average γH2A.X raw signal intensity from at least 500 cells for the indicated conditions. The results from three independent experiments were expressed as mean ± S.E.M. *P<0.05. (F) Fork-progression rate was quantified as described previously [25] under the indicated conditions and expressed as kb/min. At least 500 fibres were counted from each condition in three independent experiments. The results are expressed as mean ± S.E.M. **P<0.001. (G) Distribution of the fork rates among the fibre populations in the indicated conditions. The results are expressed as mean ± S.E.M. (n=3). (H) Quantification of stalled forks (ratio of stalled forks/number of ongoing forks × 100). At least 70 replication units were counted for each condition in three independent experiments. The results are expressed as mean ± S.E.M. *P<0.05.
Figure 5
Figure 5. MELK inhibition induces an early and delayed ATM-mediated DDR response
Immunoblot analysis with the indicated antibodies of lysates from compound-treated MCF-7 cells for a short period (A) or a long period (B). P-ATM=ATM phosphorylated on Ser1981, P-CHK2=CHK2 phosphorylated on Thr68, P-p53=p53 phosphorylated on Ser15. The blots are representative for three experiments.
Figure 6
Figure 6. MELK function modulates the expression of genes involved in DNA-damage signalling
(A) Table representing IPA analysis results of the top canonical pathways affected 48 h after MELK-T1 treatment. ‘Overlap’ demonstrates the percentage of differentially expressed genes in each pathway. (B) Heat-map representation of the significant differentially expressed genes in the top canonical pathways as shown in (A).
Figure 7
Figure 7. MELK-T1 induces a growth arrest and a senescent phenotype
(A) Representative phase-contrast images obtained by live content imaging of compound-treated MCF-7 cells over a time course of 140 h and growth curves based on confluency measurements of the phase-contrast images. (B) Representative immunohistochemistry images of compound-treated MCF-7 cells for 96 h showing vimentin (green) and Hoechst staining (blue). The left graph shows the number of cells based on nuclear count of the obtained immunohistochemistry images and normalized to the DMSO control (0 μM). In the right graph, the average cytoplasmic area was quantified and normalized to the DMSO control (0 μM). The results are expressed as mean ± S.D. (n=3). (C) Representative phase-contrast images of a sandwich assay of compound-pre-treated MCF-7 cells followed over a time period of 8 days.
Figure 8
Figure 8. MELK-T1 shows a broad activity range in the Oncolead cell-line panel
Z-scores of the incubation with MELK-T1 for 96 h are represented for the indicated cell lines (left) and their tissue origin (right).
Figure 9
Figure 9. Model of how MELK increases the DDT barrier
(A) Normal differentiated cells have a low expression level of MELK. In the event of DNA damage, the ATM-mediated DDR is switched on to maintain cell homoeostasis by a balanced equilibrium between repair, in the case of manageable damage and proliferation arrest or cell death, in the case of irreparable DNA damage. (B) In cancer cells MELK is overexpressed and keeps the ATM-mediated DDR in check, rendering the cell unable to respond. This co-incides with an accumulation of stalled replication forks, formation of DSBs and therefore genetic instability. (C) Inhibition and degradation of MELK by MELK-T1 in cancer cells lowers the threshold for DDT and reactivates/enhances the DDR. This sensitizes cancer cells to their inherent DNA damage and replication stress and results in growth arrest and senescence.

Similar articles

Cited by

References

    1. Ben-Yehoyada M., Gautier J., Dupré A. The DNA damage response during an unperturbed S-phase. DNA Repair. 2007;6:914–922. doi: 10.1016/j.dnarep.2007.02.005. - DOI - PubMed
    1. Ghosal G., Chen J. DNA damage tolerance: a double-edged sword guarding the genome. Transl. Cancer Res. 2013;2:107–129. - PMC - PubMed
    1. Bartek J., Lukas J. DNA damage checkpoints: from initiation to recovery or adaptation. Curr. Opin. Cell Biol. 2007;19:238–245. doi: 10.1016/j.ceb.2007.02.009. - DOI - PubMed
    1. Bartkova J., Horejsí Z., Koed K., Krämer A., Tort F., Zieger K., Guldberg P., Sehested M., Nesland J.M., Lukas C., et al. DNA damage response as a candidate anti-cancer barrier in early human tumorigenesis. Nature. 2005;434:864–870. doi: 10.1038/nature03482. - DOI - PubMed
    1. Lizcano J.M., Göransson O., Toth R., Deak M., Morrice N.A., Boudeau J., Hawley S.A., Udd L., Mäkelä T.P., Hardie D.G., Alessi D.R. LKB1 is a master kinase that activates 13 kinases of the AMPK subfamily, including MARK/PAR-1. EMBO J. 2004;23:833–843. doi: 10.1038/sj.emboj.7600110. - DOI - PMC - PubMed

MeSH terms