

Facultative control of matrix production optimizes competitive fitness in Pseudomonas aeruginosa PA14 biofilm models
- PMID: 26431965
- PMCID: PMC4644639
- DOI: 10.1128/AEM.02628-15
Facultative control of matrix production optimizes competitive fitness in Pseudomonas aeruginosa PA14 biofilm models
Abstract
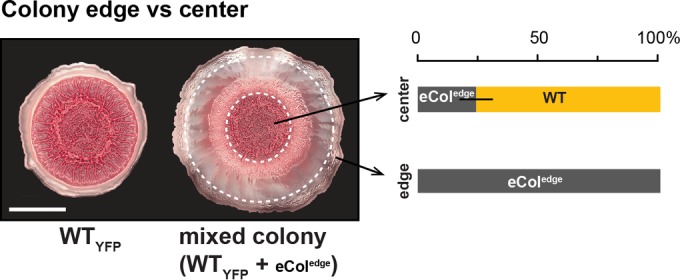
As biofilms grow, resident cells inevitably face the challenge of resource limitation. In the opportunistic pathogen Pseudomonas aeruginosa PA14, electron acceptor availability affects matrix production and, as a result, biofilm morphogenesis. The secreted matrix polysaccharide Pel is required for pellicle formation and for colony wrinkling, two activities that promote access to O2. We examined the exploitability and evolvability of Pel production at the air-liquid interface (during pellicle formation) and on solid surfaces (during colony formation). Although Pel contributes to the developmental response to electron acceptor limitation in both biofilm formation regimes, we found variation in the exploitability of its production and necessity for competitive fitness between the two systems. The wild type showed a competitive advantage against a non-Pel-producing mutant in pellicles but no advantage in colonies. Adaptation to the pellicle environment selected for mutants with a competitive advantage against the wild type in pellicles but also caused a severe disadvantage in colonies, even in wrinkled colony centers. Evolution in the colony center produced divergent phenotypes, while adaptation to the colony edge produced mutants with clear competitive advantages against the wild type in this O2-replete niche. In general, the structurally heterogeneous colony environment promoted more diversification than the more homogeneous pellicle. These results suggest that the role of Pel in community structure formation in response to electron acceptor limitation is unique to specific biofilm models and that the facultative control of Pel production is required for PA14 to maintain optimum benefit in different types of communities.
Copyright © 2015, American Society for Microbiology. All Rights Reserved.
Figures


Similar articles
-
The pel genes of the Pseudomonas aeruginosa PAK strain are involved at early and late stages of biofilm formation.Microbiology (Reading). 2005 Mar;151(Pt 3):985-997. doi: 10.1099/mic.0.27410-0. Microbiology (Reading). 2005. PMID: 15758243
-
Genes involved in matrix formation in Pseudomonas aeruginosa PA14 biofilms.Mol Microbiol. 2004 Feb;51(3):675-90. doi: 10.1046/j.1365-2958.2003.03877.x. Mol Microbiol. 2004. PMID: 14731271
-
Two genetic loci produce distinct carbohydrate-rich structural components of the Pseudomonas aeruginosa biofilm matrix.J Bacteriol. 2004 Jul;186(14):4457-65. doi: 10.1128/JB.186.14.4457-4465.2004. J Bacteriol. 2004. PMID: 15231777 Free PMC article.
-
Role of polysaccharides in Pseudomonas aeruginosa biofilm development.Curr Opin Microbiol. 2007 Dec;10(6):644-8. doi: 10.1016/j.mib.2007.09.010. Epub 2007 Nov 5. Curr Opin Microbiol. 2007. PMID: 17981495 Free PMC article. Review.
-
An update on Pseudomonas aeruginosa biofilm formation, tolerance, and dispersal.FEMS Immunol Med Microbiol. 2010 Aug;59(3):253-68. doi: 10.1111/j.1574-695X.2010.00690.x. Epub 2010 Apr 23. FEMS Immunol Med Microbiol. 2010. PMID: 20497222 Review.
Cited by
-
Interplay between biofilm microenvironment and pathogenicity of Pseudomonas aeruginosa in cystic fibrosis lung chronic infection.Biofilm. 2022 Oct 22;4:100089. doi: 10.1016/j.bioflm.2022.100089. eCollection 2022 Dec. Biofilm. 2022. PMID: 36324525 Free PMC article. Review.
-
Inhibiting bacterial cooperation is an evolutionarily robust anti-biofilm strategy.Nat Commun. 2020 Jan 9;11(1):107. doi: 10.1038/s41467-019-13660-x. Nat Commun. 2020. PMID: 31919364 Free PMC article.
-
Experimental challenges in determining the rheological properties of bacterial biofilms.Interface Focus. 2022 Oct 14;12(6):20220032. doi: 10.1098/rsfs.2022.0032. eCollection 2022 Dec 6. Interface Focus. 2022. PMID: 36330324 Free PMC article.
-
The Pseudomonas aeruginosa Complement of Lactate Dehydrogenases Enables Use of d- and l-Lactate and Metabolic Cross-Feeding.mBio. 2018 Sep 11;9(5):e00961-18. doi: 10.1128/mBio.00961-18. mBio. 2018. PMID: 30206167 Free PMC article.
-
Exopolysaccharide-Repressing Small Molecules with Antibiofilm and Antivirulence Activity against Pseudomonas aeruginosa.Antimicrob Agents Chemother. 2017 Apr 24;61(5):e01997-16. doi: 10.1128/AAC.01997-16. Print 2017 May. Antimicrob Agents Chemother. 2017. PMID: 28223377 Free PMC article.
References
-
- Recinos DA, Sekedat MD, Hernandez A, Cohen TS, Sakhtah H, Prince AS, Price-Whelan A, Dietrich LE. 2012. Redundant phenazine operons in Pseudomonas aeruginosa exhibit environment-dependent expression and differential roles in pathogenicity. Proc Natl Acad Sci U S A 109:19420–19425. doi:10.1073/pnas.1213901109. - DOI - PMC - PubMed
Publication types
MeSH terms
Substances
Grants and funding
LinkOut - more resources
Full Text Sources
Research Materials
