. 2016 Jan 1;124(Pt A):824-833.
doi: 10.1016/j.neuroimage.2015.09.049. Epub 2015 Oct 1.

Fiber ball imaging

Affiliations

Fiber ball imaging

Jens H Jensen et al. Neuroimage. .

Abstract

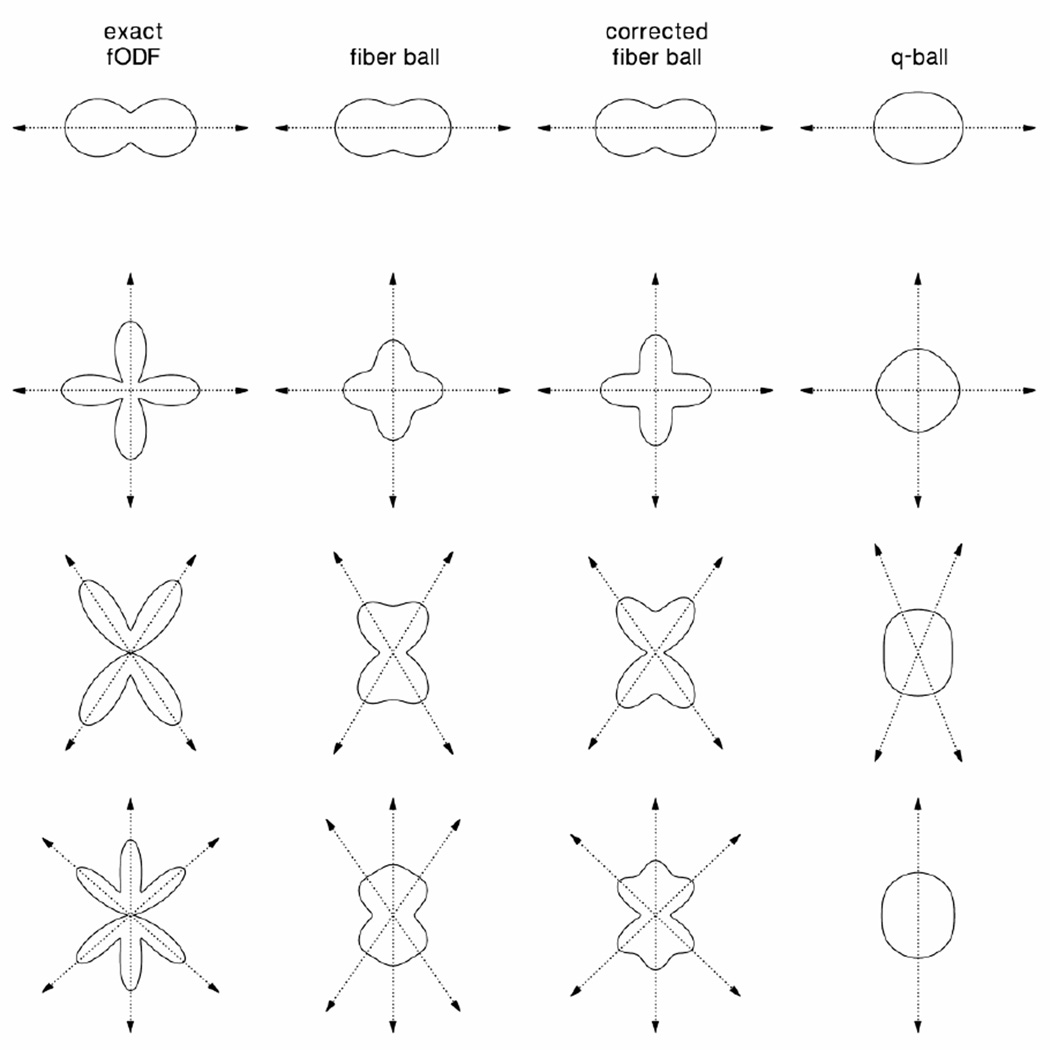
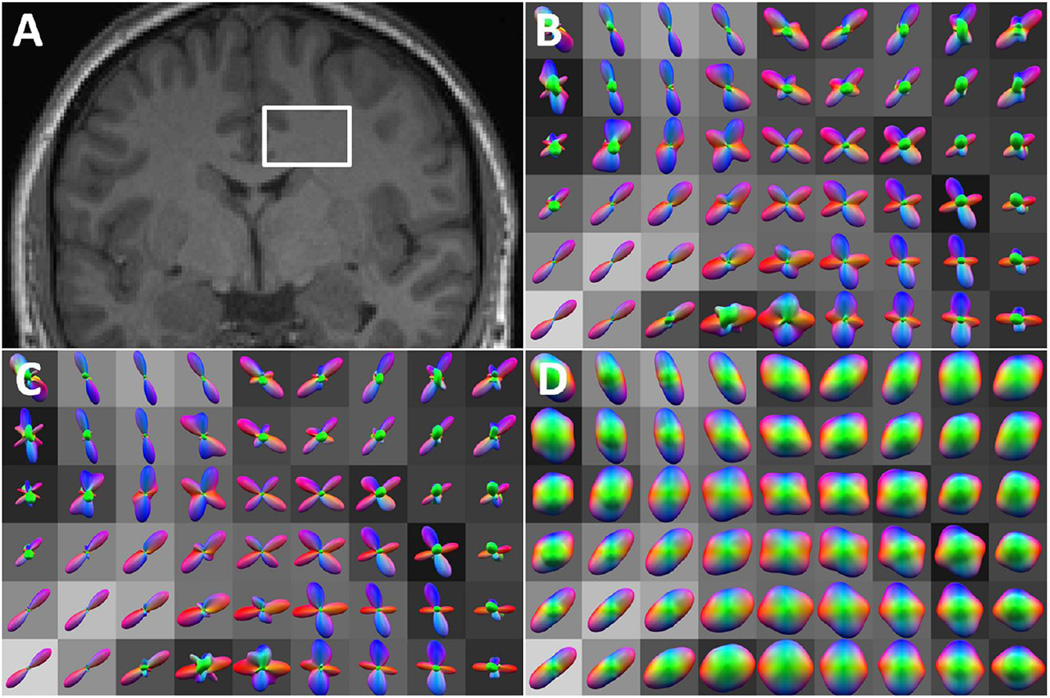
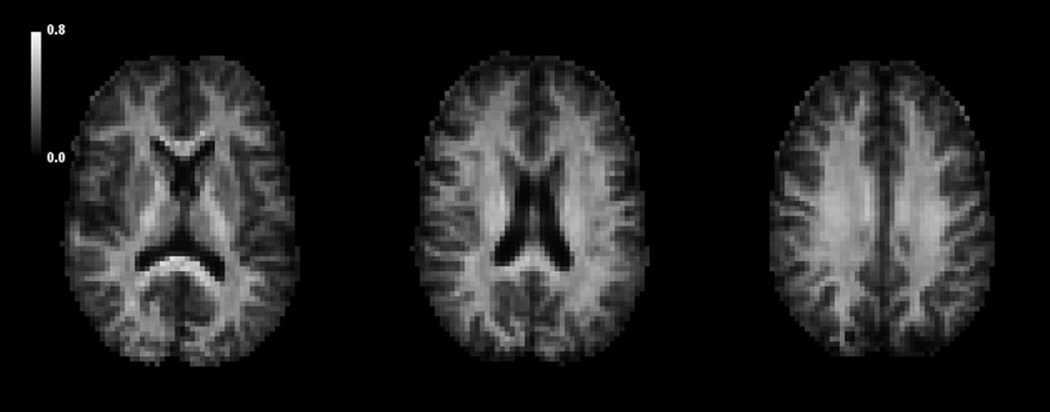
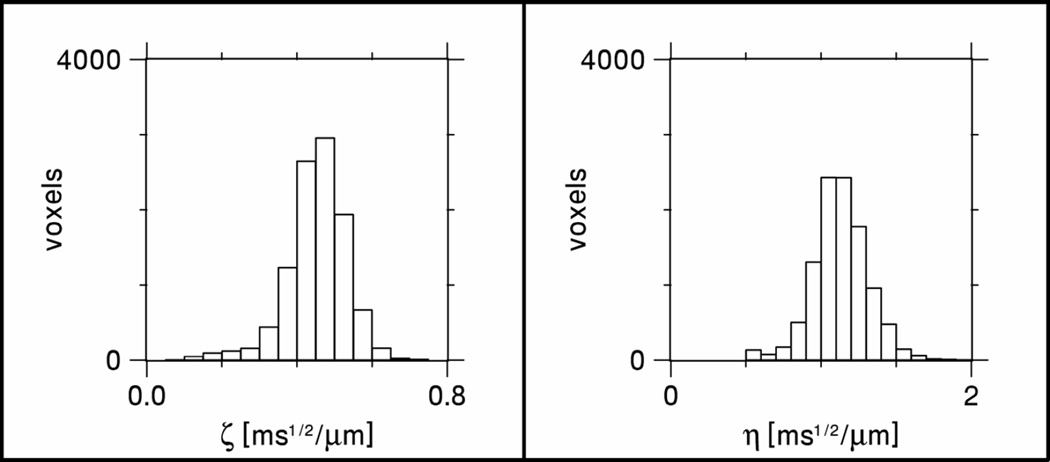
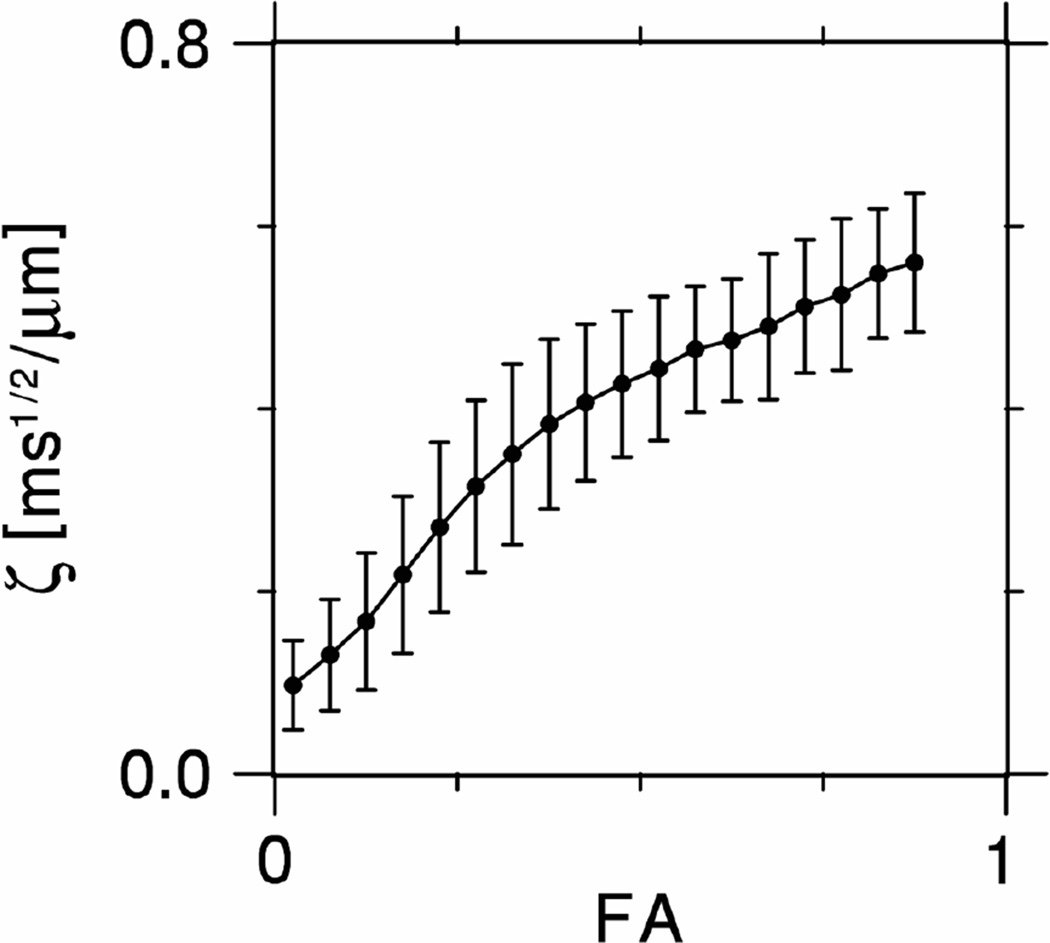
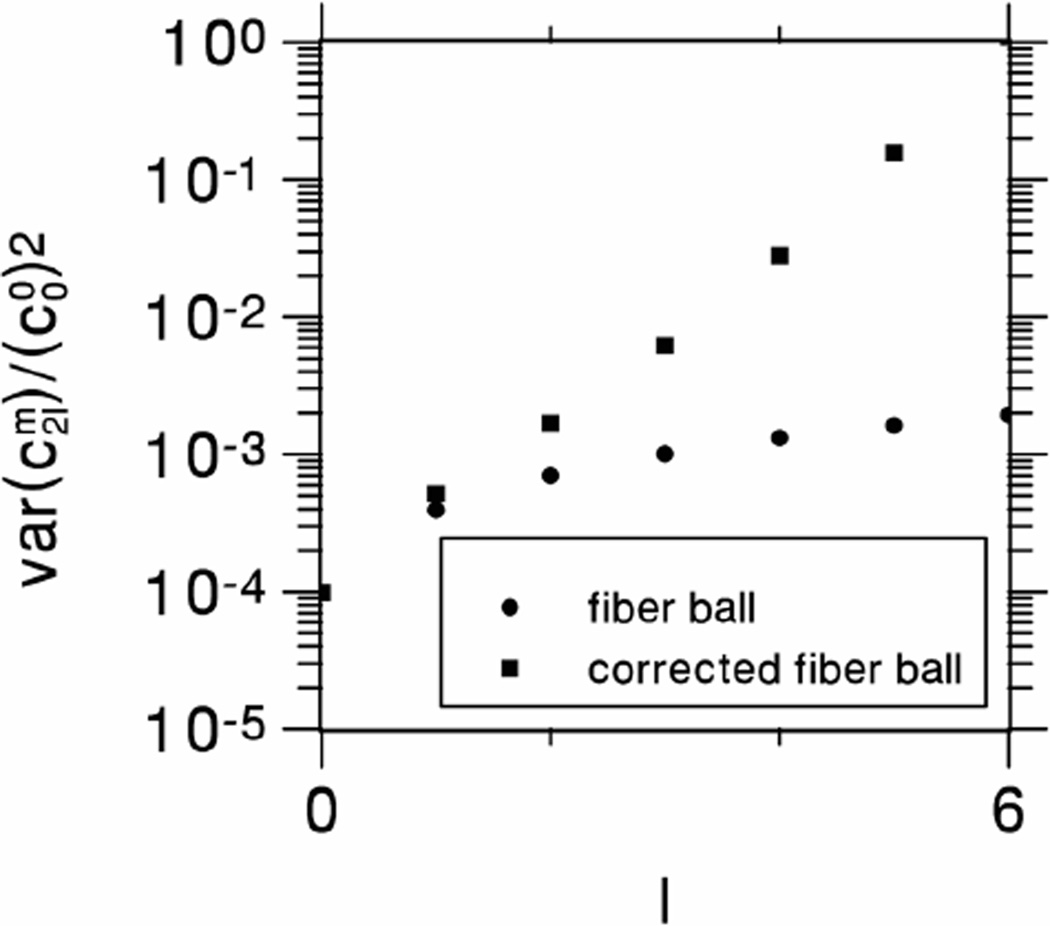
By modeling axons as thin cylinders, it is shown that the inverse Funk transform of the diffusion MRI (dMRI) signal intensity obtained on a spherical shell in q-space gives an estimate for a fiber orientation density function (fODF), where the accuracy improves with increasing b-value provided the signal-to-noise ratio is sufficient. The method is similar to q-ball imaging, except that the Funk transform of q-ball imaging is replaced by its inverse. We call this new approach fiber ball imaging. The fiber ball method is demonstrated for healthy human brain, and fODF estimates are compared to diffusion orientation distribution function (dODF) approximations obtained with q-ball imaging. The fODFs are seen to have sharper features than the dODFs, reflecting an enhancement of the higher degree angular frequencies. The inverse Funk transform of the dMRI signal intensity data provides a simple and direct method of estimating a fODF. In addition, fiber ball imaging leads to an estimate for the ratio of the fraction of MRI visible water confined to the intra-axonal space divided by the square root of the intra-axonal diffusivity. This technique may be useful for white matter fiber tractography, as well as other types of microstructural modeling of brain tissue.

Keywords: Brain; Diffusion MRI; Fiber orientation density function; Funk transform; High-angular-resolution diffusion imaging; Q-ball imaging.


Figures

Figure 1
Figure 1
The function g2l(bDa) defined by Eq. (18). The solid lines show the exact results for l = 0, 1, 2, 3, and 4, while the dotted lines show approximations derived from Eq. (19). For large bDa, g2l approaches unity, but the drop off as bDa is reduced is more rapid as l is increased. The approximation of Eq. (19) is quite accurate for bDa ≥ 1. For l = 0, this approximation is simply g0 = 1 and so coincides with the top of the plotting frame. The broken vertical line shows bDa =1.
Figure 2
Figure 2
Numerical simulations of exact fODFs, for four different examples, together with the corresponding fiber ball, corrected fiber ball, and q-ball approximations, all shown with solid curves. The dotted arrows indicate the directions of the peaks (local maxima) for each of the angular profiles. The fiber balls and q-balls all give smoothed approximations of the fODFs. The fiber balls were obtained from the inverse Funk transform of the dMRI signal, which was calculated from the exact fODF by using Eq. (17) with bDa = 5. The q-ball was found by applying a Funk transform to the same signal and is necessarily smoother than the fiber ball because of the intrinsic properties of the Funk transform. The corrected fiber ball was derived by using Eq. (23) with bD0 = 12 to partially compensate for the smoothing effects of a finite b-value. For the last example (bottom row), the q-ball only detects one of the three peak directions.
Figure 3
Figure 3
In vivo fiber balls and q-balls for a white matter region (centrum semiovale) with crossing fibers. A: selected region on anatomical MPRAGE image. B: fiber balls calculated with the inverse Funk transform of Eq. (9). C: corrected fiber balls calculated from Eqs. (15) and (23) with bD0 = 12. Note that the corrected fiber balls have somewhat sharper profiles than the uncorrected fiber balls. D: q-balls calculated with the Funk transform of Eq. (11). Fiber balls and q-balls were overlaid on the corresponding FA image, and the overall scalings were adjusted for visual clarity.
Figure 4
Figure 4
Axial maps of ζfa/Da for a single human subject as estimated with Eq. (14). White matter regions, in which fiber ball theory is expected to apply, have elevated values in comparison to gray matter regions. Gray matter also contains a substantial fiber component in the form of axons and dendrites, but it is less clear whether the assumptions underlying fiber ball imaging are accurately fulfilled. The scale bar is in units of ms1/2/µm.
Figure 5
Figure 5
Histograms for ζ and η in white matter. These distributions give mean values of ζ = 0.453 ± 0.081 ms1/2/µm and η = 1.129 ± 0.185 ms1/2/µm.
Figure 6
Figure 6
Plot of ζ as a function of FA for the whole brain, showing a monotonic increase. The error bars indicate standard deviations.
Figure 7
Figure 7
Relative variances of Eqs. (B.10) and (B.11) for the uncertainties in the fiber ball spherical harmonic coefficients due to signal noise as a function of the degree l. The plots are for parameter choices that match those of the experiment performed in this study (N = 256, SNR = 6.3, bD0 = 12). Notice the rapid increase for large l in the variance for the corrected fiber ball coefficients. For this reason, the estimates of the higher degree coefficients may be substantially less precise than for the lower degree coefficients.

References

    1. Aboitiz F, Scheibel AB, Fisher RS, Zaidel E. Fiber composition of the human corpus callosum. Brain Res. 1992 Dec 11;598(1–2):143–153. - PubMed
    1. Abramowitz M, Stegun IA. Handbook of Mathematical Functions, with Formulas, Graphs, and Mathematical Tables. Dover, New York: 1972.
    1. Aganj I, Lenglet C, Sapiro G, Yacoub E, Ugurbil K, Harel N. Reconstruction of the orientation distribution function in single- and multiple-shell q-ball imaging within constant solid angle. Magn. Reson. Med. 2010 Aug;64(2):554–566. - PMC - PubMed
    1. Anderson AW. Measurement of fiber orientation distributions using high angular resolution diffusion imaging. Magn. Reson. Med. 2005 Nov;54(5):1194–1206. - PubMed
    1. Assaf Y, Cohen Y. Assignment of the water slow-diffusing component in the central nervous system using q-space diffusion MRS: implications for fiber tract imaging. Magn Reson Med. 2000 Feb;43(2):191–199. - PubMed

Publication types