. 2015 Oct 1;526(7571):75-81.
doi: 10.1038/nature15394.

An integrated map of structural variation in 2,504 human genomes

Peter H Sudmant #  1 Tobias Rausch #  2 Eugene J Gardner #  3 Robert E Handsaker #  4   5 Alexej Abyzov #  6 John Huddleston #  1   7 Yan Zhang #  8   9 Kai Ye #  10   11 Goo Jun  12   13 Markus Hsi-Yang Fritz  2 Miriam K Konkel  14 Ankit Malhotra  15 Adrian M Stütz  2 Xinghua Shi  16 Francesco Paolo Casale  17 Jieming Chen  8   18 Fereydoun Hormozdiari  1 Gargi Dayama  19 Ken Chen  20 Maika Malig  1 Mark J P Chaisson  1 Klaudia Walter  21 Sascha Meiers  2 Seva Kashin  4   5 Erik Garrison  22 Adam Auton  23 Hugo Y K Lam  24 Xinmeng Jasmine Mu  8   25 Can Alkan  26 Danny Antaki  27 Taejeong Bae  6 Eliza Cerveira  15 Peter Chines  28 Zechen Chong  20 Laura Clarke  17 Elif Dal  26 Li Ding  10   11   29   30 Sarah Emery  31 Xian Fan  20 Madhusudan Gujral  27 Fatma Kahveci  26 Jeffrey M Kidd  12   31 Yu Kong  23 Eric-Wubbo Lameijer  32 Shane McCarthy  21 Paul Flicek  17 Richard A Gibbs  33 Gabor Marth  22 Christopher E Mason  34   35 Androniki Menelaou  36   37 Donna M Muzny  38 Bradley J Nelson  1 Amina Noor  27 Nicholas F Parrish  39 Matthew Pendleton  38 Andrew Quitadamo  16 Benjamin Raeder  2 Eric E Schadt  38 Mallory Romanovitch  15 Andreas Schlattl  2 Robert Sebra  38 Andrey A Shabalin  40 Andreas Untergasser  2   41 Jerilyn A Walker  14 Min Wang  33 Fuli Yu  33 Chengsheng Zhang  15 Jing Zhang  8   9 Xiangqun Zheng-Bradley  17 Wanding Zhou  20 Thomas Zichner  2 Jonathan Sebat  27 Mark A Batzer  14 Steven A McCarroll  4   5 1000 Genomes Project ConsortiumRyan E Mills  19   31 Mark B Gerstein  8   9   42 Ali Bashir  38 Oliver Stegle  17 Scott E Devine  3 Charles Lee  15   43 Evan E Eichler  1   7 Jan O Korbel  2   17
Affiliations

An integrated map of structural variation in 2,504 human genomes

Peter H Sudmant et al. Nature. .

Abstract

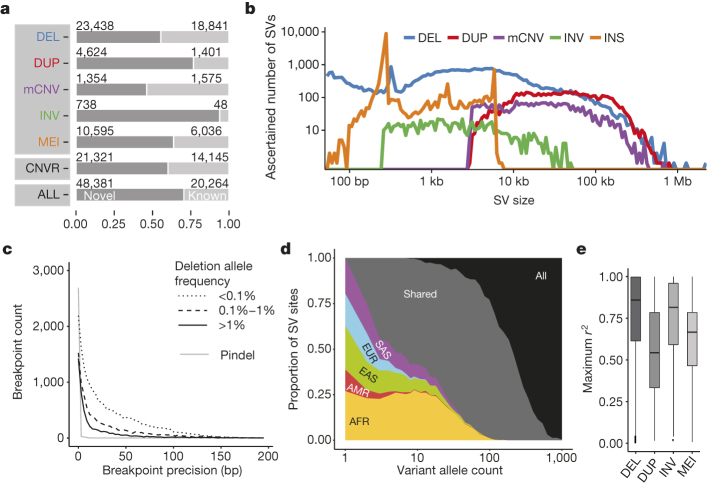
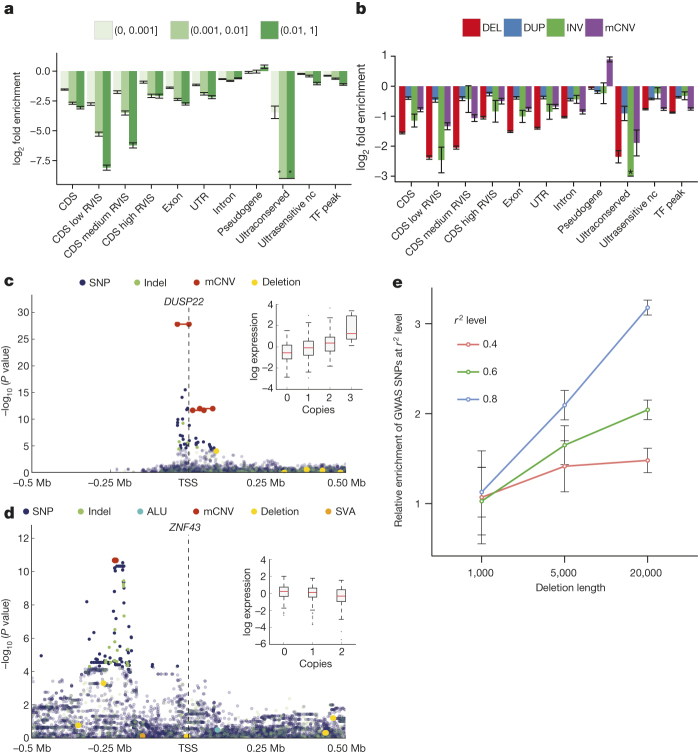
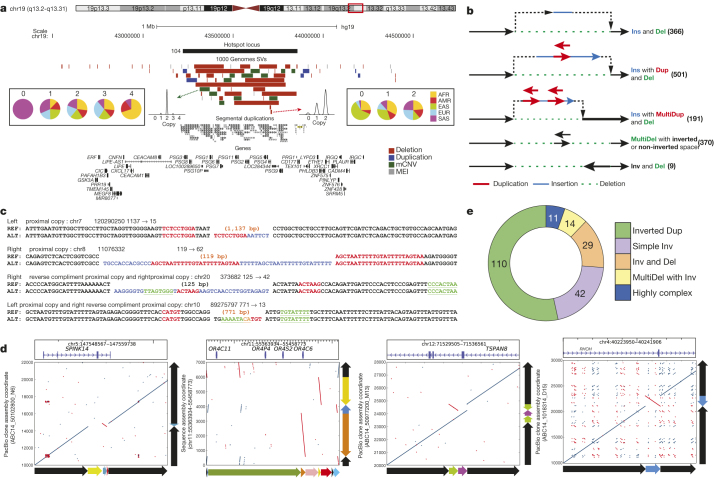
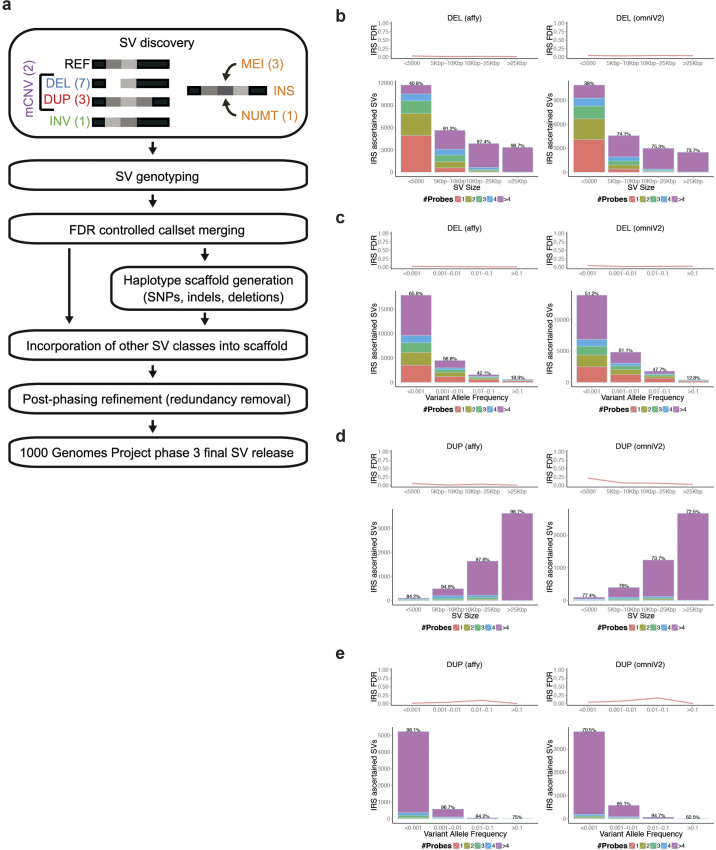
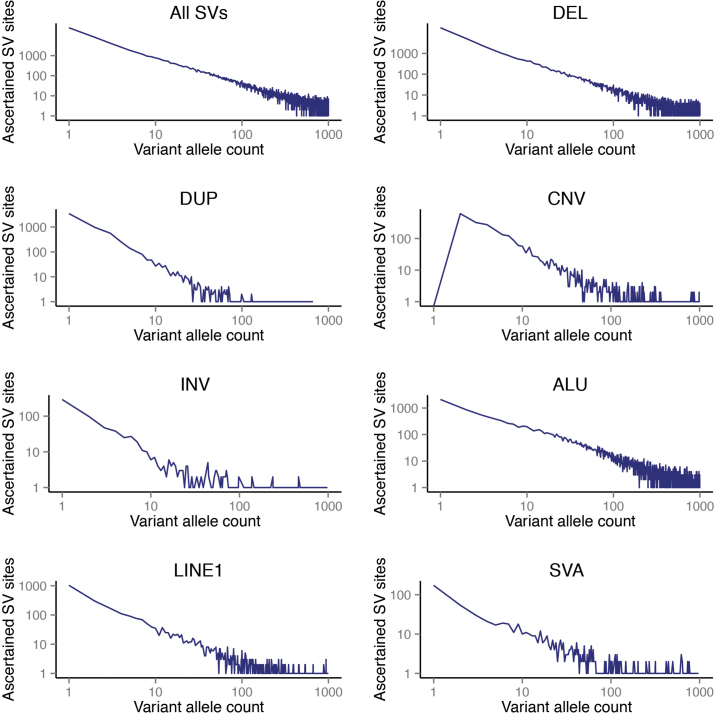
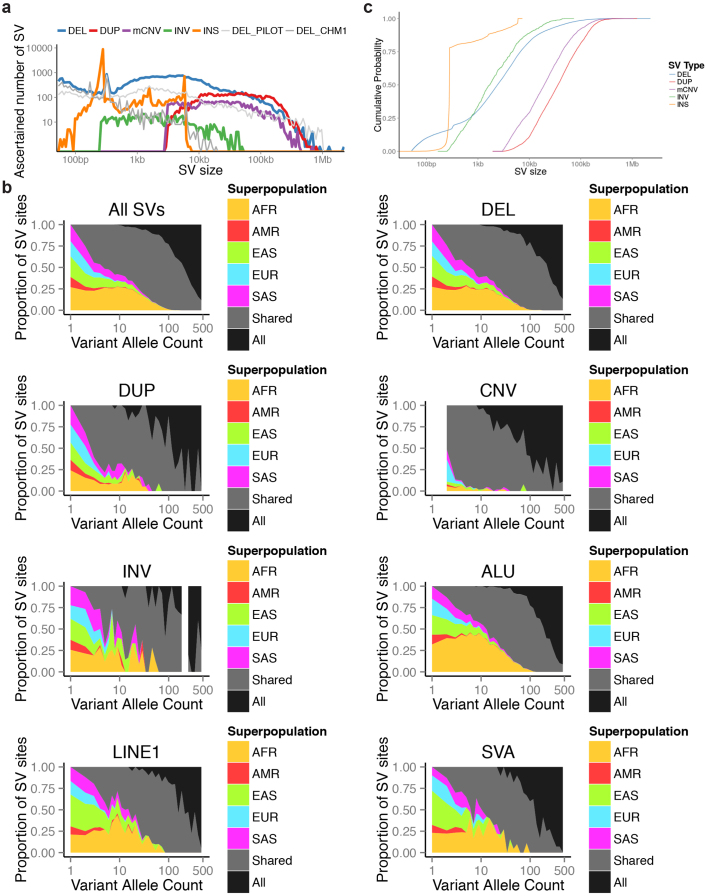
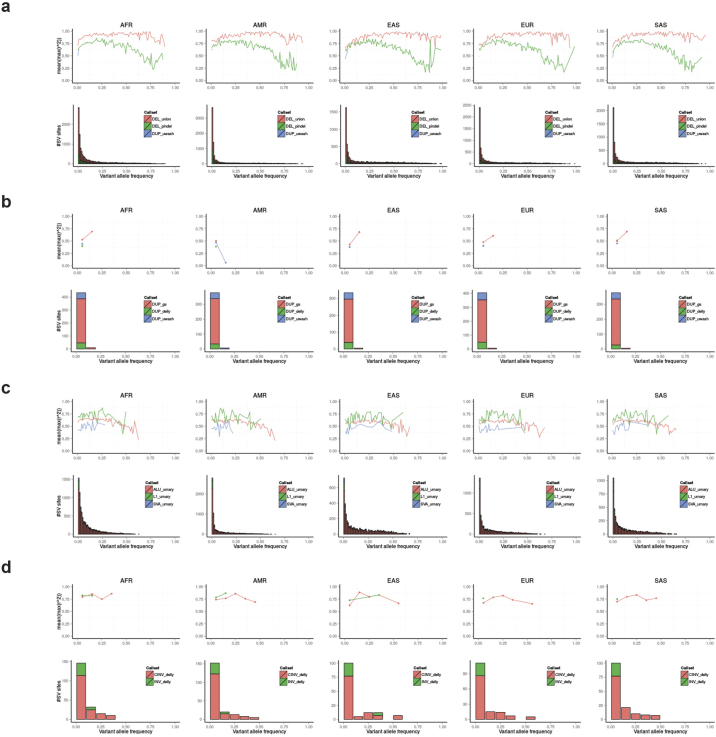
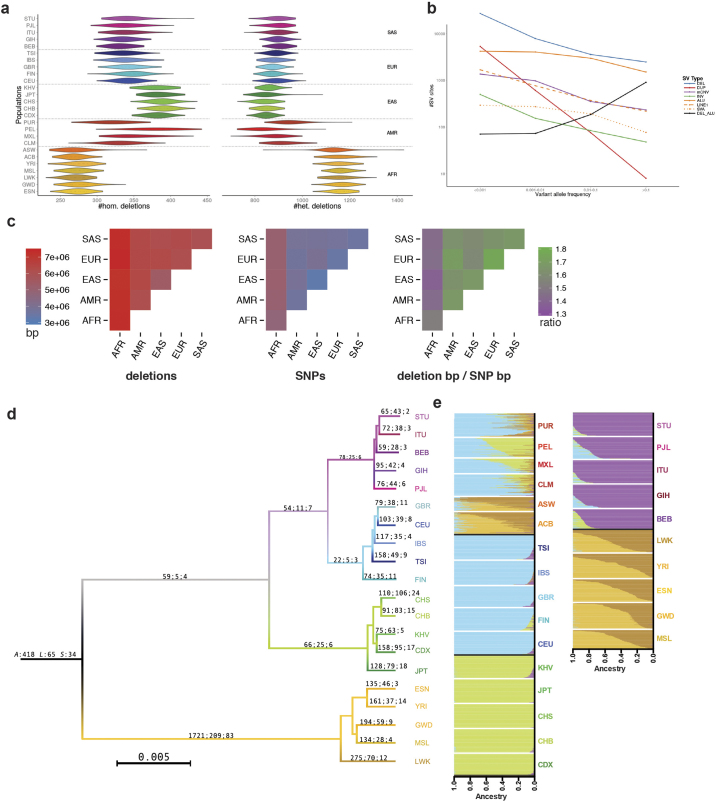
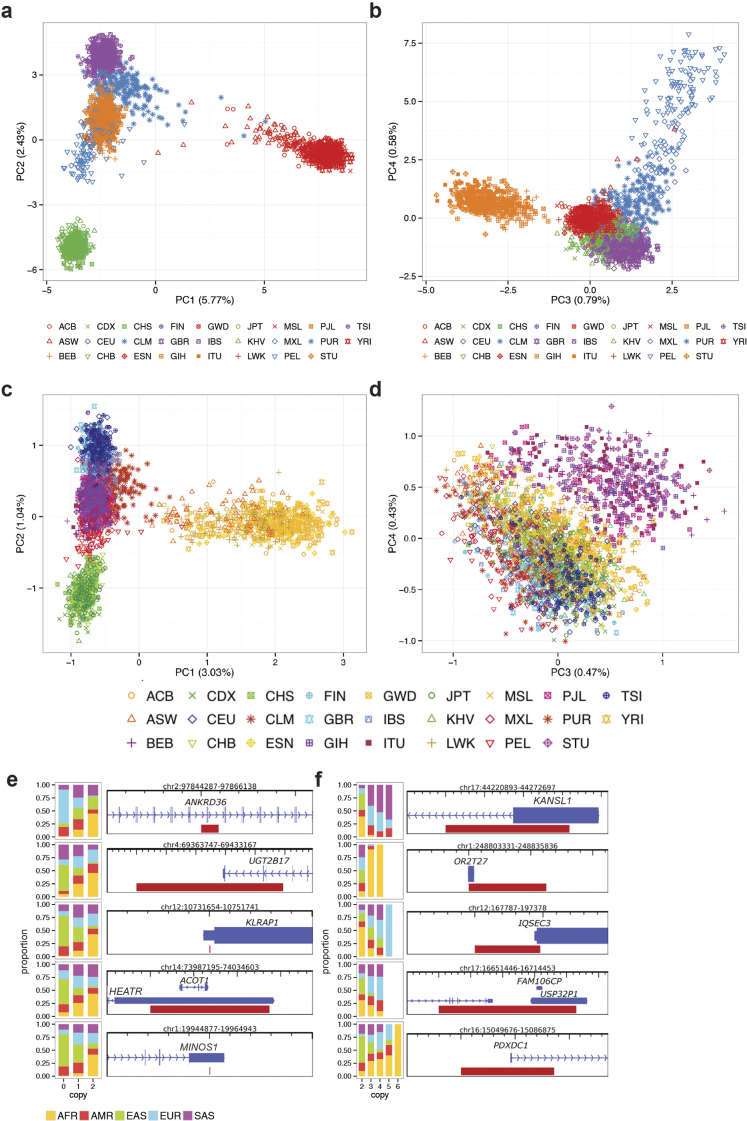
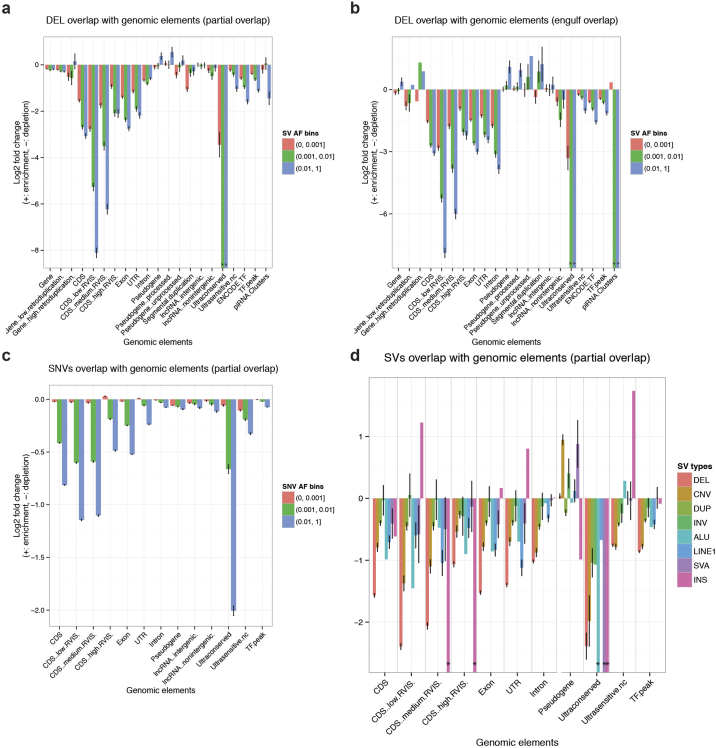
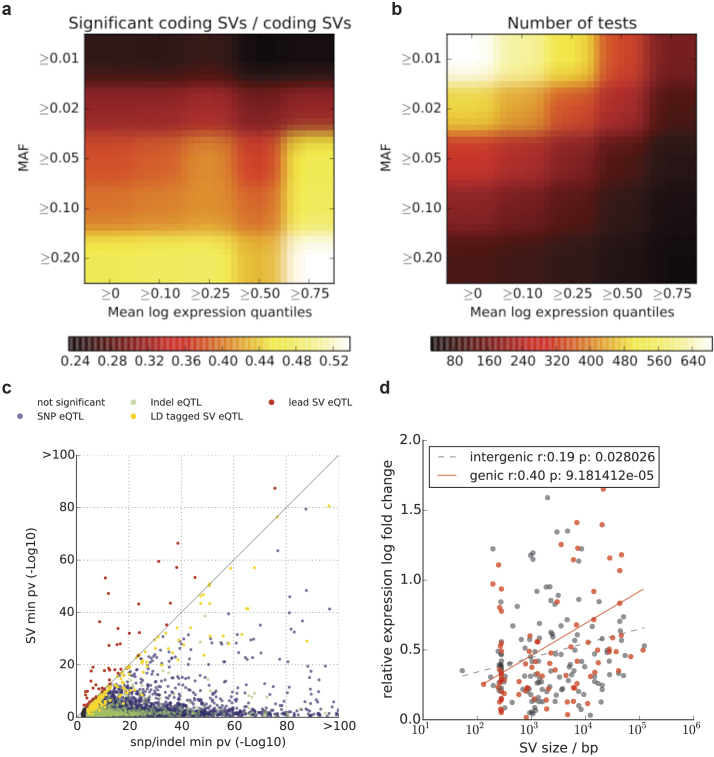
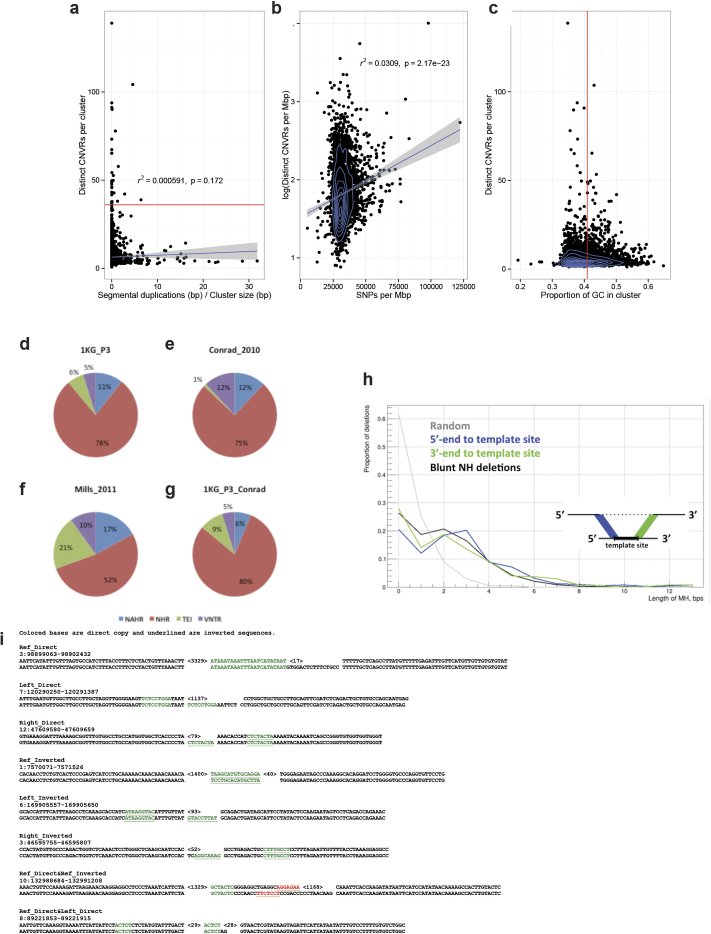
Structural variants are implicated in numerous diseases and make up the majority of varying nucleotides among human genomes. Here we describe an integrated set of eight structural variant classes comprising both balanced and unbalanced variants, which we constructed using short-read DNA sequencing data and statistically phased onto haplotype blocks in 26 human populations. Analysing this set, we identify numerous gene-intersecting structural variants exhibiting population stratification and describe naturally occurring homozygous gene knockouts that suggest the dispensability of a variety of human genes. We demonstrate that structural variants are enriched on haplotypes identified by genome-wide association studies and exhibit enrichment for expression quantitative trait loci. Additionally, we uncover appreciable levels of structural variant complexity at different scales, including genic loci subject to clusters of repeated rearrangement and complex structural variants with multiple breakpoints likely to have formed through individual mutational events. Our catalogue will enhance future studies into structural variant demography, functional impact and disease association.


Conflict of interest statement

E.E.E. is on the scientific advisory board (SAB) of DNAnexus, Inc. and is a consultant for Kunming University of Science and Technology (KUST) as part of the 1000 China Talent Program. P.F. is on the SAB of Omicia, Inc.

Figures

Figure 1
Figure 1. Phase 3 integrated SV callset.
a, Novelty based on overlap of our SV set with DGV (upper panel, broken down by SV class), of collapsed CNVRs with earlier 1000 Genomes Project releases, (middle panel) and of our SV set with refs , (bottom panel). b, Size distribution of ascertained SVs (bin width is uniform in log-scale). DEL, biallelic deletion, DUP, biallelic duplication, INV, inversion, INS, non-reference insertion (including MEIs and NUMTs). c, Breakpoint precision of assembled deletions stratified by VAF (split-read caller Pindel shown separately). d, SV allele sharing across continental groups. e, LD properties of biallelic SV classes. PowerPoint slide
Figure 2
Figure 2. SV functional impact.
a, Relative enrichment or depletion of genomic elements within breakpoint-resolved deletions binned by VAF. TF, transcription factor binding site; nc, noncoding. RVIS range from 0–100 (low < 20, medium 20–50, high ≥ 50). *no element intersected. b, Enrichment/depletion of genomic elements within different SV classes, compared with breakpoint-resolved deletions. c, Manhattan plot of DUSP22-eQTL. Inset, boxplots of association between copy-number genotype and expression. d, Manhattan plot of ZNF43-eQTL. e, Enrichment of SV-containing haplotypes at previously reported GWAS hits (error bars show s.e.m.). PowerPoint slide
Figure 3
Figure 3. SV complexity at different scales.
a,PSG locus with clustered SVs. Population copy-number state histograms are shown for two example SVs. b, Schemes depicting assembled complex deletions. c, Smaller-scale complex deletions identified with Pindel. Flanking sequences are shown for reference (REF) and alternate (ALT) alleles, further to insertions at the breakpoints. Proximal stretches matching the insertion are labelled in red (forward) and green (reverse complement). Blue, insertions lacking nearby matches. d, Alignment dot plots depicting inversions (inverted sequences are in red within each dot plot). Adjacent schemes depict allelic structures for REF and ALT. e, Inversion complexity summarized. PowerPoint slide
Extended Data Figure 1
Extended Data Figure 1. Construction of the SV release and intensity rank sum validation.
a, Approach used for constructing our SV release set. b, Intensity rank sum (IRS) validation results for deletions in different size bins. c, IRS validation results for deletions in variant allele frequency (VAF) bins. d, IRS results for duplications in different size bins. e, IRS validation results for duplications in VAF bins. Based on Affymetrix SNP6 array probes, the IRS FDR for all SV length and VAF bins was ≤5.4%, requiring at least 100 SVs per bin with an IRS assigned P-value.
Extended Data Figure 2
Extended Data Figure 2. This figure shows the number of SV sites in our phase 3 release relative to allele frequency expressed in terms of allele count.
SVs down to an allele count of 1 (corresponding to VAF = 0.0002) are represented in our phase 3 SV set (with the exception of mCNVs, denoted ‘CNV’ in this figure, which are defined as sites of multi-allelic variation thus requiring allele count ≥2, hence no mCNV sites are ascertained for allele count = 1).
Extended Data Figure 3
Extended Data Figure 3. Size and population distribution of different SV classes.
a, Variants ascertained in the 1000 Genomes Project pilot phase (light grey) as well as the recent publication of SVs ascertained by PacBio sequencing in the CHM1 genome (grey) are displayed for comparison in this SV size distribution figure (INS, used as abbreviation for MEIs and NUMTs in this display item). b, Population distribution of SV allele sharing across continental groups for different SV classes. c, Cumulative distributions of the number of events as a function of size by SV class.
Extended Data Figure 4
Extended Data Figure 4. LD properties of various SV classes.
a, LD properties of deletions, broken down by continental group and shown as a function of VAF. b, LD properties of duplications. c, LD properties of Alu, L1 and SVA mobile element insertions. d, LD properties of inversions (with breakdown for two independent inversion sets generated with our inversion discovery algorithm Delly; that is, CINV = one-sided inversions with support for one breakpoint; INV = two-sided inversions with support for both breakpoints; these two sets are combined into the joint phase3 SV group inversion set).
Extended Data Figure 5
Extended Data Figure 5. Population genetic properties of SVs.
a, Deletion heterozygosity and homozygosity among human populations for a subset of high-confidence deletions. Populations from the African continental group (AFR) exhibit the highest levels of heterozygosity and thus diversity among humans, but show the overall lowest level of deletion homozygosity among all continental groups. By comparison, East Asian populations exhibited the lowest levels of deletion heterozygosity and the highest levels of homozygosity. Het., heterozygous; Hom., homozygous. b, VAF distribution of major SV classes. Bi-allelic duplications represent a notable outlier, showing a striking depletion of common alleles, which can be explained by the preponderance of genomic sites of duplication to undergo recurrent rearrangement (see main text). As a consequence, most common duplications are classified as multi-allelic variants (that is, mCNVs). c, The number of base pairs (bp) differing among individuals within and between continental groups for deletions (upper panel) and SNPs (middle panel) contrasted with the ratio of deletion bp differences to SNP bp differences (‘deletion bp/SNP bp’) among groups (lower panel). Non-African groups exhibit a higher ‘deletion bp/SNP bp’ compared to Africans. d, Neighbour-joining tree of populations constructed from MEIs (homoplasy-free markers) to provide a (simplified) view of population ancestry. The tree is labelled with the number of lineage-specific MEIs (Alu:L1:SVA). e, Classification of ancestry in AFR/AMR and AMR admixed populations using homoplasy-free ancestry informative MEI markers. Colour usage follows the same scheme as in Fig. 1d, except in the case of AFR individuals, which use both the colour in Fig. 1d and another colour that is unrelated to any other figure to indicate additional substructure within this group.
Extended Data Figure 6
Extended Data Figure 6. Principal component analysis and population stratification of SVs.
a, Principal component analysis (PCA) plot of principal components 1 and 2 for deletions. b, PCA plot of principal components 3 and 4 for deletions. c, PCA plot of principal components 1 and 2 for MEIs. d, PCA plot of principal components 3 and 4 for MEIs. e, The five most highly population-stratified deletions intersecting protein-coding genes based on VST. f, The five most highly population-stratified duplications and multi-allelic copy number variants (mCNVs) intersecting protein-coding genes based on VST. For abbreviations, see Supplementary Table 1.
Extended Data Figure 7
Extended Data Figure 7. Enrichment of functional elements intersecting SVs.
a, Shadow figure of Fig. 2a. Overlap enrichment analysis of deletions (with resolved breakpoints) versus genomic elements, using partial overlap statistic, deletions categorized into VAF bins. b, Similar to a. The only difference is that engulf overlap statistic is used instead of partial overlap statistic. Engulf overlap statistic is the count of genomic elements (for example, CDS) that are fully imbedded in at least one SV interval (for example, deletions). *no element intersected observed within data set. c, Similar to a and b, with the enrichment/depletion analysis pursued for common SNPs as well as more rare single nucleotide polymorphisms/variants (SNVs). Common SNV alleles show the highest levels of depletion for investigated genomic elements. d, Overlap enrichment analysis of various SV types versus genomic elements, using partial overlap statistic.
Extended Data Figure 8
Extended Data Figure 8. SV-eQTL analysis.
a, SV-centric eQTL analysis of coding SVs. Shown is the proportion of coding SVs that are eQTLs as a function of the minimum VAF and the expression quartile. b, Total number of coding SVs for corresponding filters. Common SVs (VAF > 0.2) in highly expressed genes (>75% quantile) are very likely to correspond to SV-eQTLs (54%, see also Supplementary Table 8). c, For all genes with significant eQTLs (FDR < 10%), shown are raw P-values considering only SNPs (x axis) or only SVs (y axis). Genes with (strict lead) SV-eQTLs are shown in red. Genes with a SNP lead eQTL that is in linkage with an SV (r2 > 0.5) are shown in orange. SNP lead eQTLs without an SV in LD are shown in blue. d, Relative eQTL effect sizes for genetic and intergenic SV eQTLs (n = 239) either with an SV-eQTL or an LD tagged SV (in log abundance scale). Shown are regression trends for both genic and intergenic SV eQTls. For genetic eQTLs, a clear relationship between SV effect size is found. For example, genic SVs >10 kb have threefold larger effect sizes compared to genic SVs < 1 kb; P = 0.004; t-test.
Extended Data Figure 9
Extended Data Figure 9. SV clustering and breakpoint analysis.
a–c, Extensive clustering of recurrent SVs into CNVRs appears unrelated to the extent of segmental duplications (a) and is only partially correlating with SNP diversity (b) and GC content (c). Breakdown of SV mechanism classifications based on criteria from two earlier studies (refs 6, 40). Shown are results for deletions with nucleotide resolved breakpoints. BreakSeq was used for mechanism inference. d, 1KG_P3: breakdown for our 1000 Genomes Project phase 3 SV callset using classification criteria from ref. . e, Conrad_2010: summary of mechanism classification results published in ref. . f, Mills_2011: summary of mechanism classification results published in ref. . g, 1KG_P3_Conrad: Breakdown for our 1000 Genomes Project phase 3 SV callset using classification criteria from ref. . Mechanism classification was pursued using four different categories. Blue, non-allelic homologous recombination (NAHR); green, mobile elements inserted into the reference genomes (appearing deleted in this analysis); red, non-homology-based rearrangement mechanisms (NHR), such as NHEJ, microhomology-mediated end-joining and microhomology-mediated break-induced replication (involving blunt-ended deletion breakpoints or breakpoints with microhomoloy); purple, expansion or shrinkage of variable numbers of tandem repeats (VNTRs). TEI, transposable element insertion (equivalent with MEI). h, Distribution of lengths of micro-homology (MH) for complex SVs, measured between deletion and corresponding template sites boundaries. Simple deletions, which based on BreakSeq were inferred to be formed by a non-homology-based SV formation mechanism, such as NHEJ and microhomology-mediated break-induced replication (Supplementary Table 3), are shown as an additional control (here denoted ‘blunt NH deletions’). i, Origins of inserted sequences in complex deletions inferred by split read analysis. This figure depicts examples for each class shown in Supplementary Table 13.
Extended Data Figure 10
Extended Data Figure 10. Examples of inversions identified in the SV release.
a–e, Five classifications of inversions verified using PacBio and Minion reads are represented: Simple Inversion (a), inv-dup (b), inv-del (c), MultiDel with Inv (here abbreviated as inv-2dels) (d) and complex (e). f, Several further examples of inverted duplications (inv-dup), the most common form of inversion-associated SV identified in the phase 3 release set. The figure is depicting DNA sequence alignment dotplots (same arrangement as in Fig. 3), with the y axis referring to PacBio DNA single molecule sequencing reads and the x axis referring to the reference genome assembly (hg19). Inverted sequences are highlighted in red. Sequence analysis suggests that these inverted duplications are not typically associated with retrotransposition.

Comment in

References

    1. Weischenfeldt J, Symmons O, Spitz F, Korbel JO. Phenotypic impact of genomic structural variation: insights from and for human disease. Nature Rev. Genet. 2013;14:125–138. doi: 10.1038/nrg3373. - DOI - PubMed
    1. Malhotra D, Sebat J. CNVs: harbingers of a rare variant revolution in psychiatric genetics. Cell. 2012;148:1223–1241. doi: 10.1016/j.cell.2012.02.039. - DOI - PMC - PubMed
    1. Hastings PJ, Lupski JR, Rosenberg SM, Ira G. Mechanisms of change in gene copy number. Nature Rev. Genet. 2009;10:551–564. doi: 10.1038/nrg2593. - DOI - PMC - PubMed
    1. Alkan C, Coe BP, Eichler EE. Genome structural variation discovery and genotyping. Nature Rev. Genet. 2011;12:363–376. doi: 10.1038/nrg2958. - DOI - PMC - PubMed
    1. Wellcome Trust Case Control Consortium Genome-wide association study of CNVs in 16,000 cases of eight common diseases and 3,000 shared controls. Nature. 2010;464:713–720. doi: 10.1038/nature08979. - DOI - PMC - PubMed

Publication types