. 2015 Nov 13;290(46):27644-59.
doi: 10.1074/jbc.M115.654129. Epub 2015 Oct 2.

Subcellular Distribution of NAD+ between Cytosol and Mitochondria Determines the Metabolic Profile of Human Cells

Affiliations

Subcellular Distribution of NAD+ between Cytosol and Mitochondria Determines the Metabolic Profile of Human Cells

Magali R VanLinden et al. J Biol Chem. .

Abstract

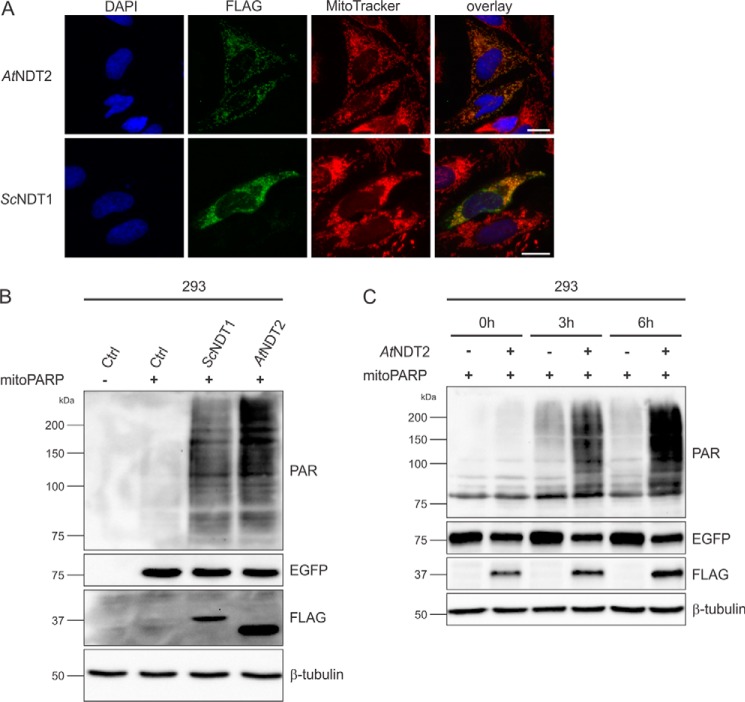
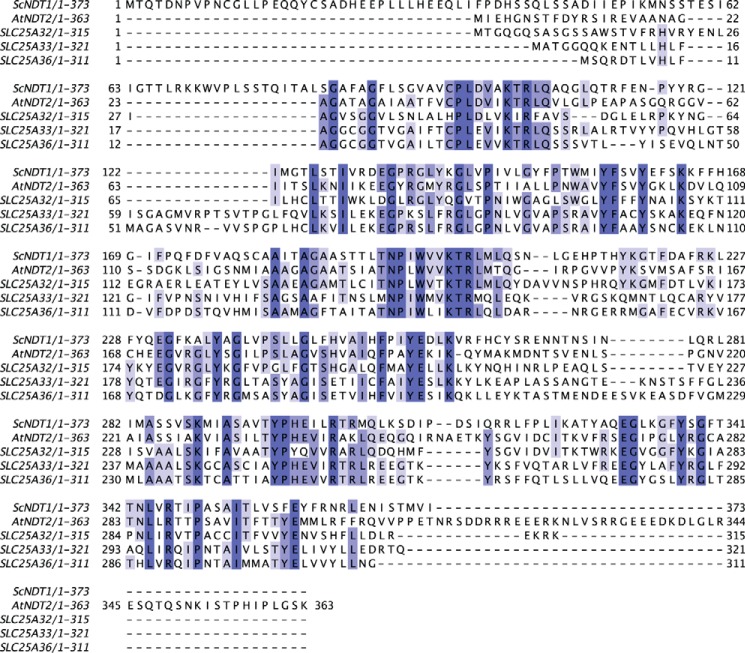
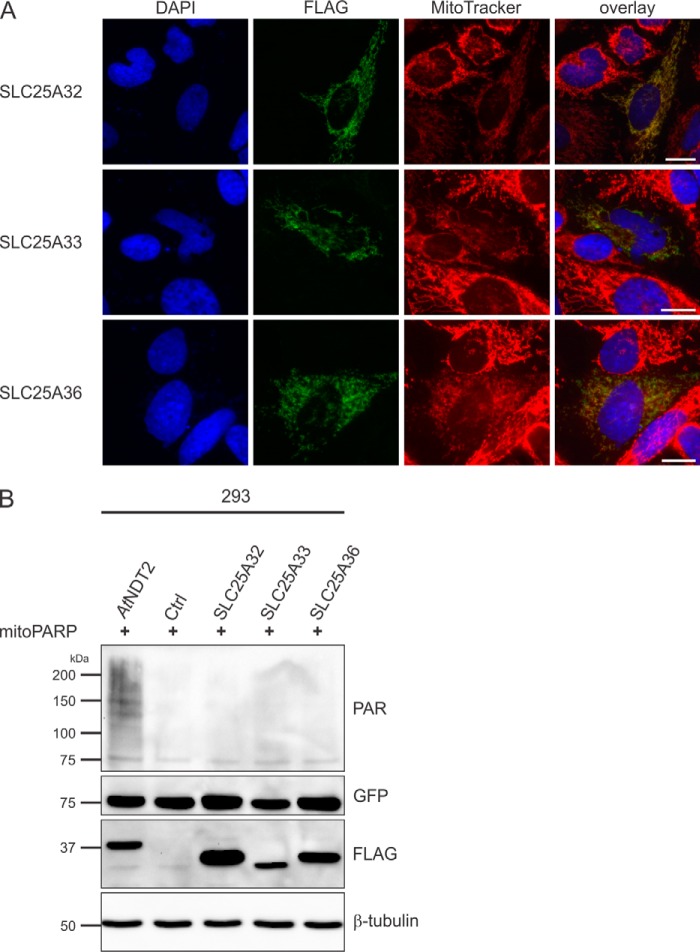
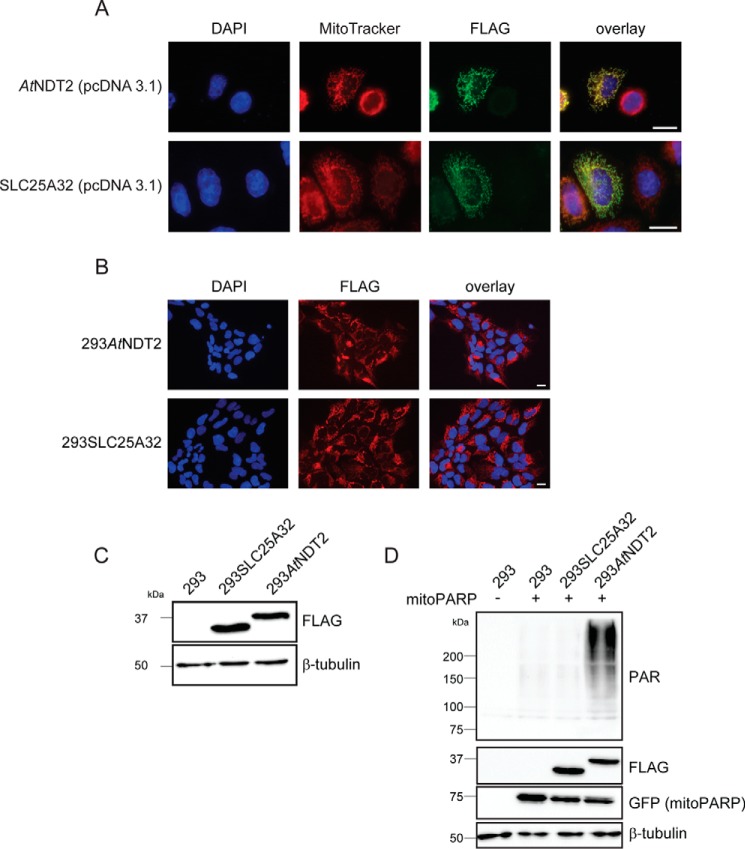
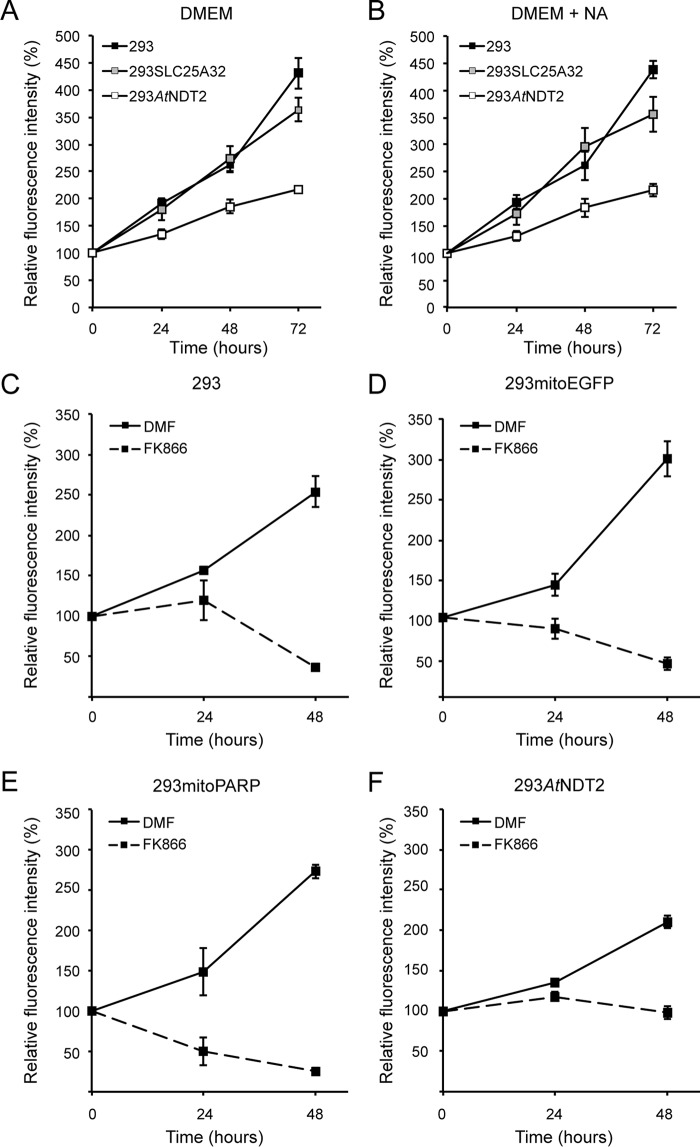
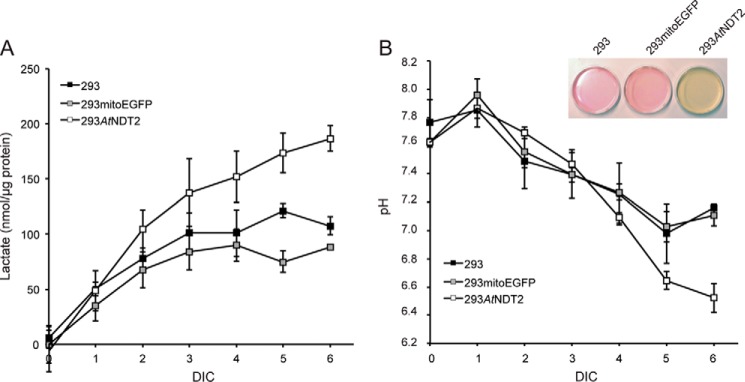
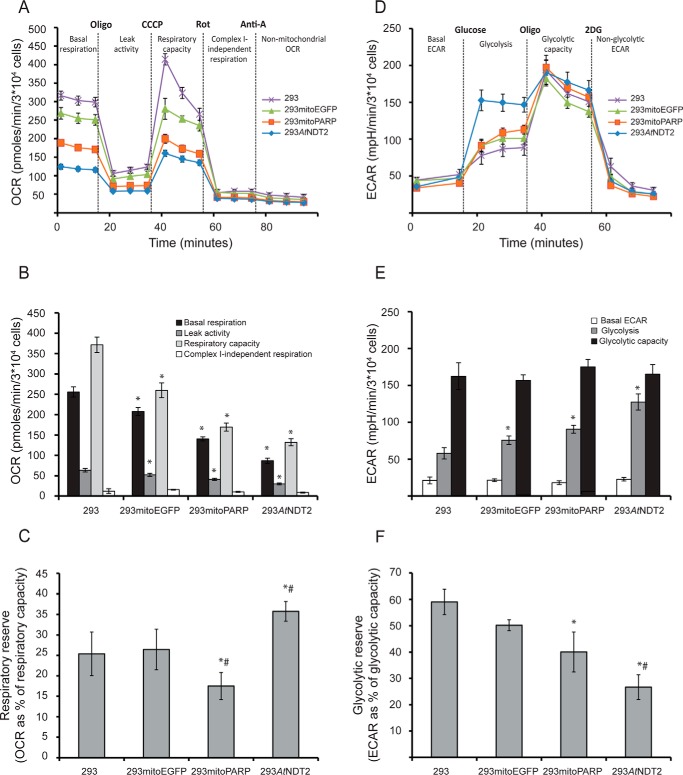
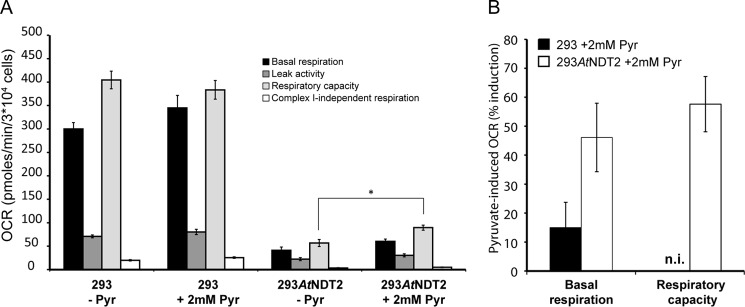
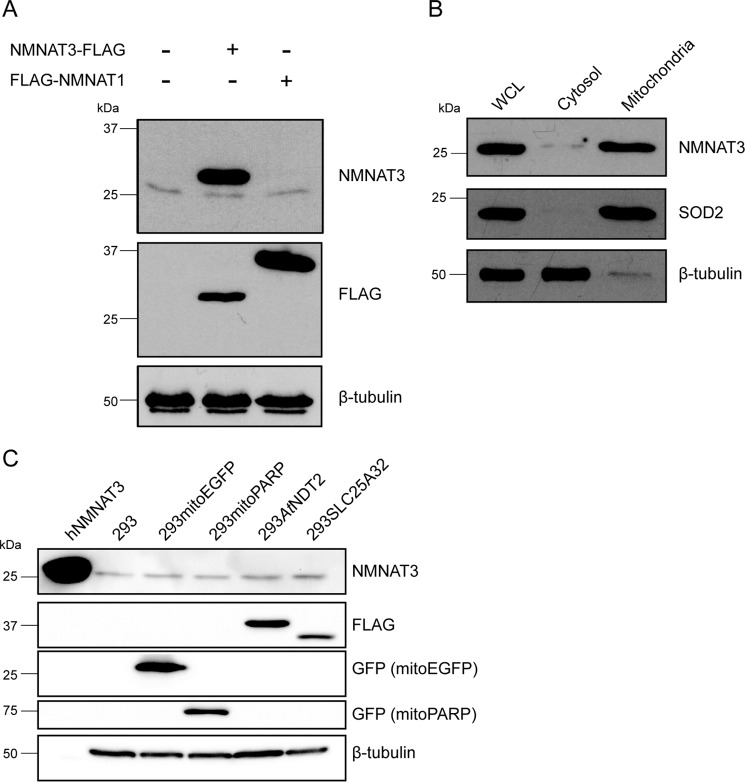
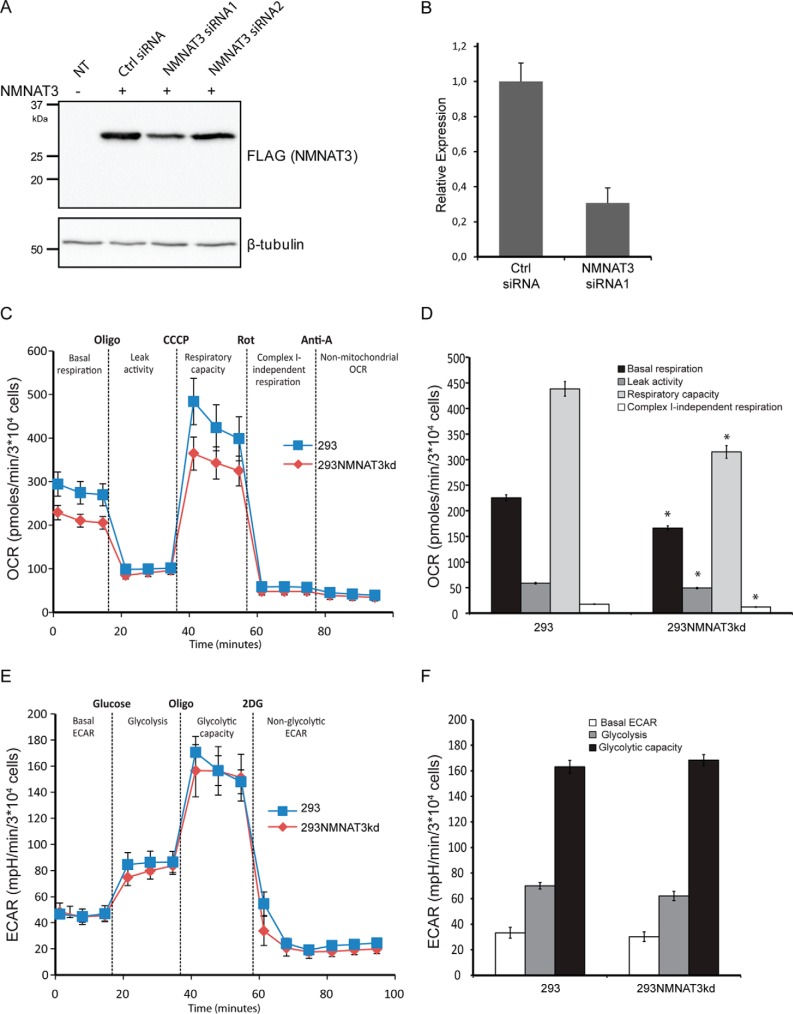
The mitochondrial NAD pool is particularly important for the maintenance of vital cellular functions. Although at least in some fungi and plants, mitochondrial NAD is imported from the cytosol by carrier proteins, in mammals, the mechanism of how this organellar pool is generated has remained obscure. A transporter mediating NAD import into mammalian mitochondria has not been identified. In contrast, human recombinant NMNAT3 localizes to the mitochondrial matrix and is able to catalyze NAD(+) biosynthesis in vitro. However, whether the endogenous NMNAT3 protein is functionally effective at generating NAD(+) in mitochondria of intact human cells still remains to be demonstrated. To modulate mitochondrial NAD(+) content, we have expressed plant and yeast mitochondrial NAD(+) carriers in human cells and observed a profound increase in mitochondrial NAD(+). None of the closest human homologs of these carriers had any detectable effect on mitochondrial NAD(+) content. Surprisingly, constitutive redistribution of NAD(+) from the cytosol to the mitochondria by stable expression of the Arabidopsis thaliana mitochondrial NAD(+) transporter NDT2 in HEK293 cells resulted in dramatic growth retardation and a metabolic shift from oxidative phosphorylation to glycolysis, despite the elevated mitochondrial NAD(+) levels. These results suggest that a mitochondrial NAD(+) transporter, similar to the known one from A. thaliana, is likely absent and could even be harmful in human cells. We provide further support for the alternative possibility, namely intramitochondrial NAD(+) synthesis, by demonstrating the presence of endogenous NMNAT3 in the mitochondria of human cells.

Keywords: NAD transport; NMNAT3; cell compartmentalization; glycolysis; metabolism; mitochondria; respiration.


Figures

FIGURE 1.
FIGURE 1.
Heterologous expression of mitochondrial NAD+ transporters in human cells increases mitochondrial NAD+ availability. A, established mitochondrial NAD+ transporters from A. thaliana (AtNDT2) and S. cerevisiae (ScNDT1) were expressed with a C-terminal FLAG epitope in HeLa S3 cells and detected by FLAG immunocytochemistry. The images show the nuclei (DAPI) and mitochondrial structures (MitoTracker) and the overexpressed proteins (FLAG). The merged images reveal co-localization of the recombinant NAD+ transporters with mitochondria. Scale bar, 10 μm. B, 293 cells were co-transfected with a vector encoding mitoPARP and plasmids encoding the indicated mitochondrial NAD+ transporters or a control plasmid. Cell lysates were subjected to PAR immunoblot analyses. The intensity of the PAR immunoreactivity reflects the mitochondrial NAD+ content. The expression of the transporters (FLAG) and mitoPARP (EGFP) was confirmed, and β-tubulin served as a loading control. C, 293 cells were co-transfected with a vector encoding mitoPARP and either a vector encoding AtNDT2 or a control plasmid in the presence of the PARP inhibitor 3-aminobenzamide (1 mm). 24 h after transfection, PARP inhibition was released by medium exchange. At the indicated time points, cells were lysed and subjected to immunoblot analysis. The intensity of the PAR immunoreactivity reflects the mitochondrial NAD+ content. The expression of the transporter (FLAG) and mitoPARP (EGFP) was confirmed, and β-tubulin served as a loading control. Ctrl, control.
FIGURE 2.
FIGURE 2.
Protein sequence alignment of ScNDT1 and AtNDT2 with closest human relatives. The alignment was carried out using JALVIEW (31). The level of conservation is indicated by shades of blue, with darker blue corresponding to a higher level of conservation.
FIGURE 3.
FIGURE 3.
Human SLC25A32, SLC25A33, and SLC25A36 proteins do not exhibit mitochondrial NAD+ transporter activity. A, HeLa S3 cells were transiently transfected with plasmids encoding C-terminally FLAG-tagged human SLC25A32, SLC25A33, and SLC25A36 proteins. The images show the nuclei (DAPI) and mitochondrial structures (MitoTracker) and the overexpressed proteins (FLAG). As revealed by the merged images, the recombinant proteins co-localize with mitochondria. Scale bar, 10 μm. B, 293 cells were transiently co-transfected with a vector encoding mitoPARP and either control vectors or vectors encoding the indicated transporter. Cell lysates were subjected to PAR immunoblot analyses. The presence of AtNDT2 strongly increases polymer (PAR) formation indicative of elevated mitochondrial NAD+. The expression of the transporters (FLAG) and mitoPARP (EGFP) was confirmed, and β-tubulin served as a loading control. Ctrl, control.
FIGURE 4.
FIGURE 4.
Stable expression of plant NAD+ transporter AtNDT2 in 293 cells constitutively increases the mitochondrial NAD+ content. A, subcellular localization of AtNDT2 and human SCL25A32 in HeLa S3 cells transiently transfected with the vector for stable transfection. AtNDT2 and SLC25A32 are detected by their FLAG epitope, nuclei are stained with DAPI, and mitochondrial structures are stained with MitoTracker. Scale bar, 10 μm. B, fluorescence micrographs of stably transfected monoclonal 293 cells expressing C-terminally FLAG-tagged AtNDT2 (293AtNDT2) or SLC25A32 (293SLC25A32). AtNDT2 and SLC25A32 are detected by their FLAG epitope, and nuclei are stained with DAPI. All cells exhibit immunoreactivity toward the FLAG antibody. Scale bar, 10 μm. C, FLAG immunoblot analysis of 293AtNDT2 and 293SLC25A32 cell lysates. β-Tubulin served as a loading control. D, lysates from parental 293 cells and monoclonal 293AtNDT2 and 293SLC25A32 cells transiently transfected with the vector encoding mitoPARP (detected via its EGFP portion) were subjected to PAR immunoblot analyses. The level of PAR immunoreactivity reflects the mitochondrial NAD+ content. β-Tubulin served as a loading control.
FIGURE 5.
FIGURE 5.
Stable expression of AtNDT2 reduces proliferation of 293 cells and attenuates cell death induced by inhibition of NAD biosynthesis. A and B, cell proliferation of 293AtNDT2, 293SLC25A32 and 293 parental cells was measured in the absence (A) and presence (B) of 100 μm NA. The results show the averages of three independent experiments (means ± S.D.). C–F, cell proliferation was measured in the indicated cell lines in the absence and presence of the NamPRT inhibitor FK866 (2 μm) or its solvent DMF. The results show the averages of three independent experiments (means ± S.D.).
FIGURE 6.
FIGURE 6.
Redistribution of NAD+ to mitochondria of 293AtNDT2 cells leads to increased acidification of the culture medium because of enhanced lactate production. A, the lactate concentration in cell culture supernatants of the indicated cell lines was determined during growth for 6 days in culture (DIC) without medium exchange. The results were normalized to cellular protein concentration and are shown as the averages of three independent experiments (means ± S.D.). B, the pH was measured in the medium collected in A. The results are shown as the averages of three independent experiments (means ± S.D.). The inset shows representative culture dishes of the indicated cell lines after growth for 6 days in culture without medium exchange.
FIGURE 7.
FIGURE 7.
Subcellular distribution of cellular NAD+ determines the metabolic fate of cells. The activity and integrity of glycolysis and mitochondrial respiration in 293AtNDT2 cells were determined by extracellular flux analysis and compared with parental 293 cells and 293 cells stably expressing mitochondrial EGFP (293mitoEGFP) or the mitoPARP construct (293mitoPARP). A, mitochondrial respiration was assessed by measuring OCR after sequential addition of oligomycin (Oligo, 3 μm), CCCP (0.5–1 μm), rotenone (Rot, 1 μm), and antimycin A (Anti-A, 1 μm). The figure shows representative data from one of four experiments. B, quantification of the mitochondrial respiration data obtained in A. The rate determined after the addition of antimycin A was subtracted as background. The results are shown as the averages of four independent experiments (means ± S.D.). *, p ≤ 0.001 versus 293. C, respiratory reserve capacity (respiratory capacity − basal respiration) calculated as percentages of respiratory capacity. The results are shown as averages from four independent experiments (means ± S.D.). *, p < 0.05 versus 293; #, p < 0.05 versus 293mitoEGFP. D, glycolysis was studied by analyzing ECAR after sequential additions of glucose (10 mm), oligomycin (Oligo, 3 μm), and 2-deoxyglucose (2DG, 100 mm). The figure shows representative data from one of four experiments. E, quantification of the glycolysis data obtained in C (means ± S.D.). The rate determined after addition of 2-deoxyglucose was subtracted as background. *, p ≤ 0.001 versus 293. F, the glycolytic reserve capacity (glycolytic capacity − basal glycolysis) was calculated as percentage of glycolytic capacity. The figure shows data (means ± S.D.) from three independent experiments. *, p < 0.05 versus 293; #, p < 0.05 versus mitoEGFP.
FIGURE 8.
FIGURE 8.
Pyruvate supplementation partially restores mitochondrial respiration in 293AtNDT2 cells. A, mitochondrial respiration was assessed by measuring OCR in 293 and 293AtNDT2 cells incubated in the absence (−Pyr) or presence (+2 mm Pyr) of pyruvate, after pyruvate starvation. The figure shows results from a representative experiment. *, p < 0.05. B, quantification of the relative pyruvate-dependent induction of basal and maximal respiration (respiratory capacity) in 293 and 293AtNDT2 cells. n.i., no induction.
FIGURE 9.
FIGURE 9.
NMNAT3 is present in mitochondria of human cells, and its expression level is unaffected by changes in the mitochondrial NAD+ content. A, Western blot detection of endogenous and overexpressed NMNAT3 in 293 cells with a monoclonal NMNAT3-specific antibody. The monoclonal antibody detected both the endogenous protein and the overexpressed FLAG-tagged recombinant NMNAT3. No cross-reactivity of the monoclonal antibody with NMNAT1 was observed. β-Tubulin served as a loading control. B, whole cell lysate (WCL), cytosolic and mitochondrial fractions from 293 cells were subjected to immunoblot analysis using the monoclonal NMNAT3-specific antibody. Superoxide dismutase (SOD2) served as a control for the purity of mitochondrial fraction, whereas β-tubulin served as a control for the cytosolic fraction. C, detection of endogenous NMNAT3 in lysates from 293 cell lines with altered mitochondrial NAD+ availability (293mitoPARP and 293AtNDT2), as well as control cells (293mitoEGFP and 293SLC25A32 and parental 293 cells). Lysates were subjected to immunoblot analysis using the NMNAT3-specific antibody. β-Tubulin served as a loading control. hNMNAT3, bacterially expressed, purified His6-tagged human NMNAT3 (47).
FIGURE 10.
FIGURE 10.
Down-regulation of NMNAT3 gene expression in 293 cells reduces mitochondrial respiration. A, FLAG immunoblot analysis of 293 cell lysates prepared after 24 h of expression of plasmid encoding C-terminally FLAG-tagged NMNAT3 in the presence of two distinct NMNAT3 siRNAs and control siRNA. NT, lysates from untransfected 293 cells. B, relative NMNAT3 gene expression in 293 cells after 48 h of transfection of NMNAT3 siRNA1 and control siRNA (Ctrl) as revealed by QRT-PCR. The NMNAT3 transcript level was normalized to β-actin. C, mitochondrial respiration assessed by measuring OCR in 293 cells transfected with NMNAT3 siRNA1 (293NMNAT3kd) and control siRNA (293). D, quantification of the mitochondrial respiration data obtained in C. *, p < 0.05 E, glycolysis was analyzed by ECAR in 293 cells transfected with NMNAT3 siRNA1 (293NMNATkd) and control siRNA (293). F, quantification of the glycolysis data obtained in E.

References

    1. Houtkooper R. H., Cantó C., Wanders R. J., and Auwerx J. (2010) The secret life of NAD+: an old metabolite controlling new metabolic signaling pathways. Endocr. Rev. 31, 194–223 - PMC - PubMed
    1. Koch-Nolte F., Haag F., Guse A. H., Lund F., and Ziegler M. (2009) Emerging roles of NAD+ and its metabolites in cell signaling. Sci. Signal. 2, mr1. - PubMed
    1. Reddy P. H., and Reddy T. P. (2011) Mitochondria as a therapeutic target for aging and neurodegenerative diseases. Curr. Alzheimer Res. 8, 393–409 - PMC - PubMed
    1. Szendroedi J., Phielix E., and Roden M. (2012) The role of mitochondria in insulin resistance and type 2 diabetes mellitus. Nat. Rev. Endocrinol. 8, 92–103 - PubMed
    1. Wallace D. C. (2012) Mitochondria and cancer. Nat. Rev. Cancer 12, 685–698 - PMC - PubMed

Publication types

MeSH terms