

Targeting Anti-Insulin B Cell Receptors Improves Receptor Editing in Type 1 Diabetes-Prone Mice
- PMID: 26432895
- PMCID: PMC4637270
- DOI: 10.4049/jimmunol.1500438
Targeting Anti-Insulin B Cell Receptors Improves Receptor Editing in Type 1 Diabetes-Prone Mice
Abstract
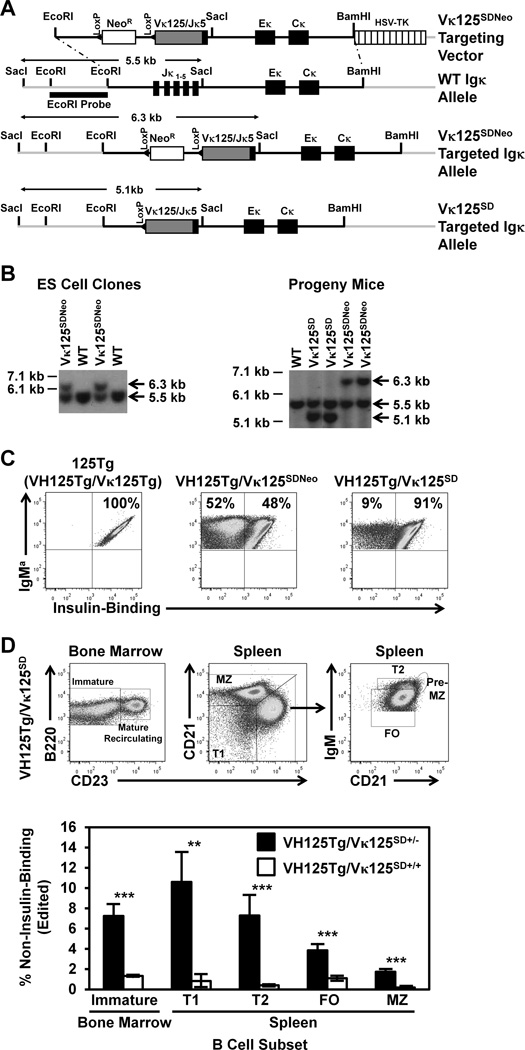
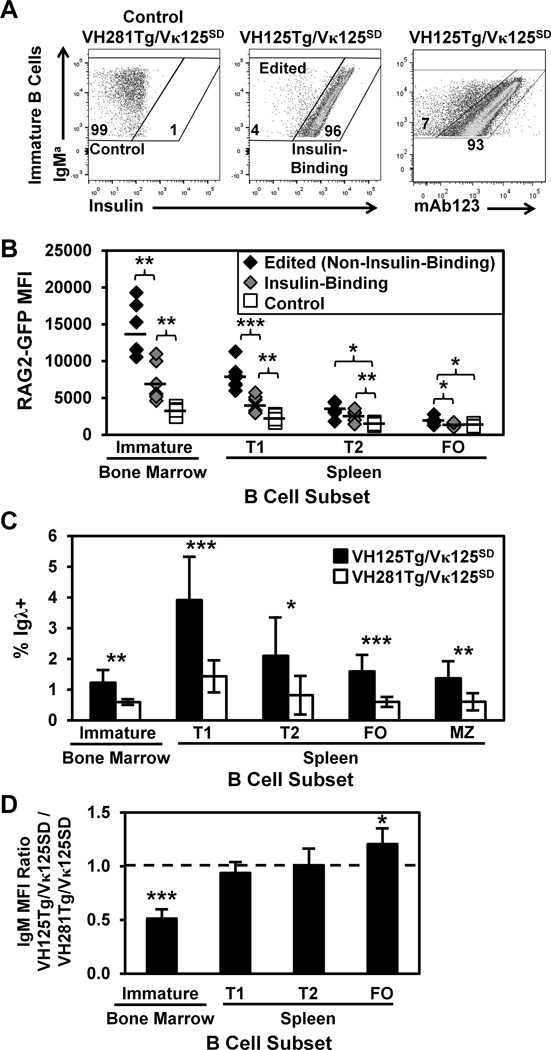
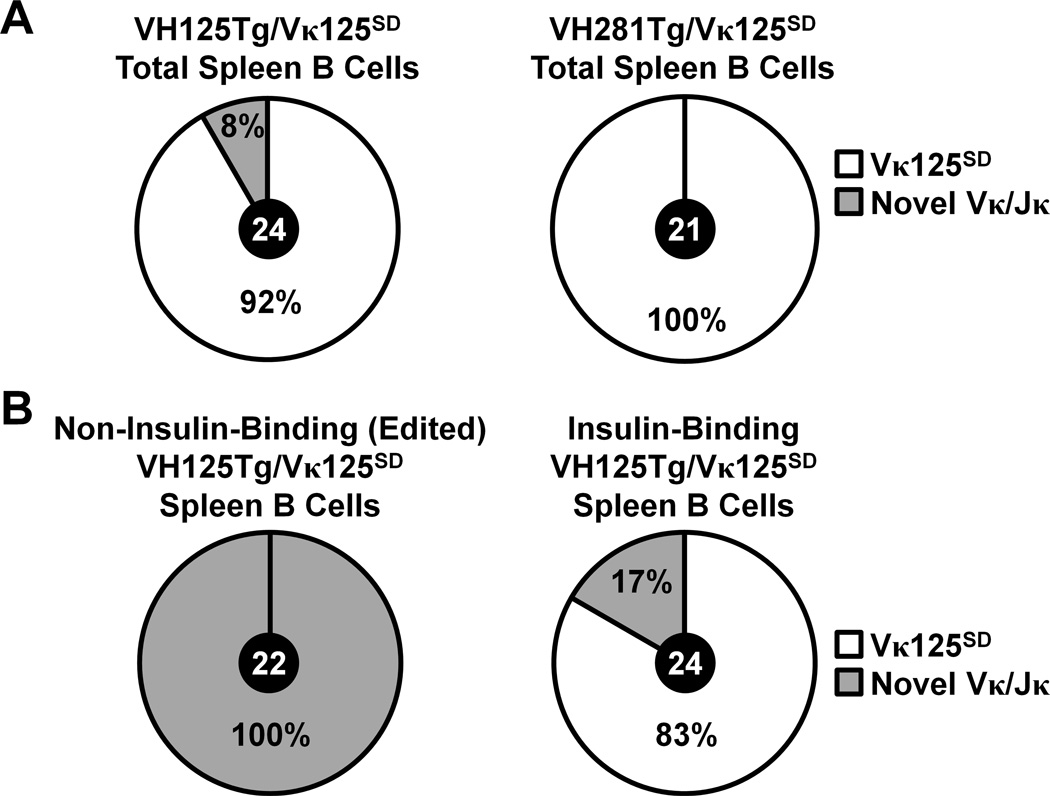
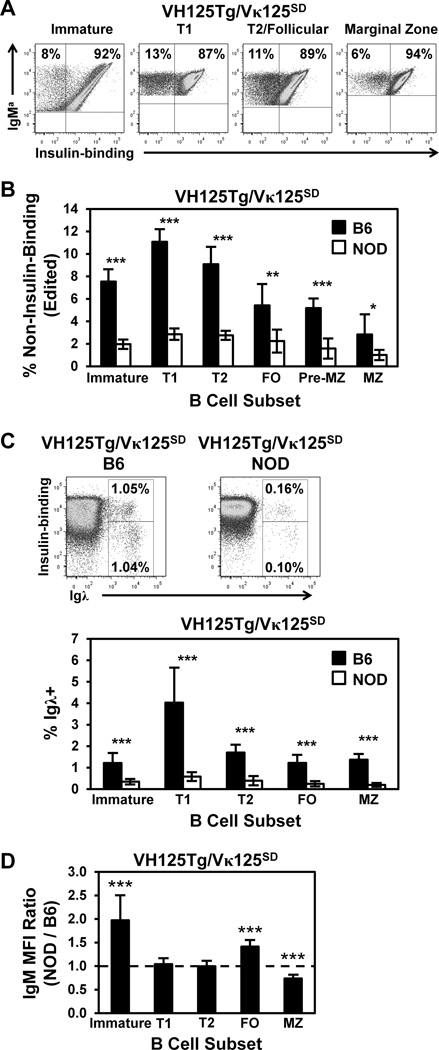
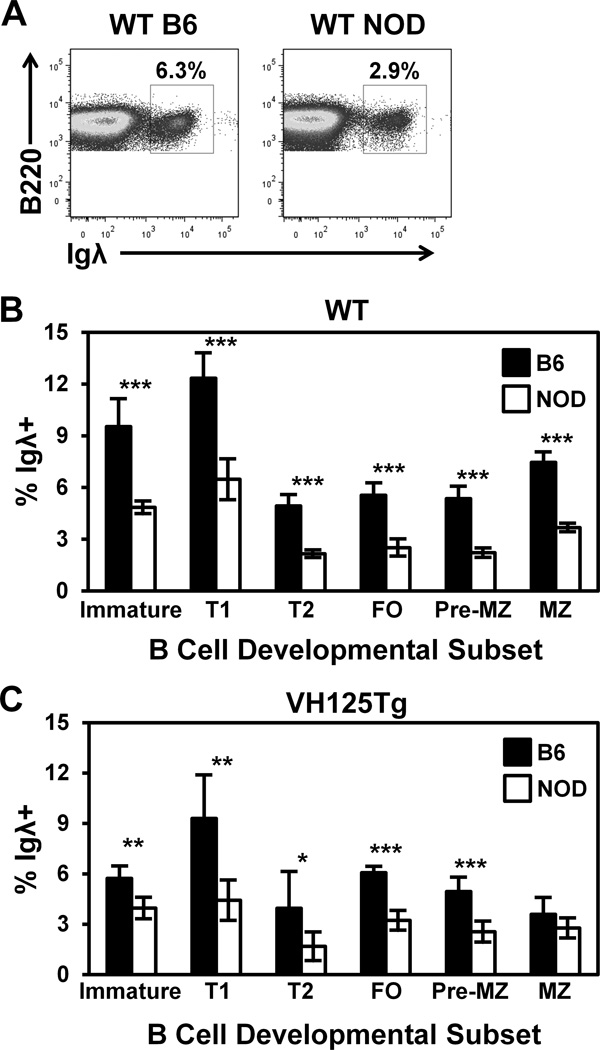
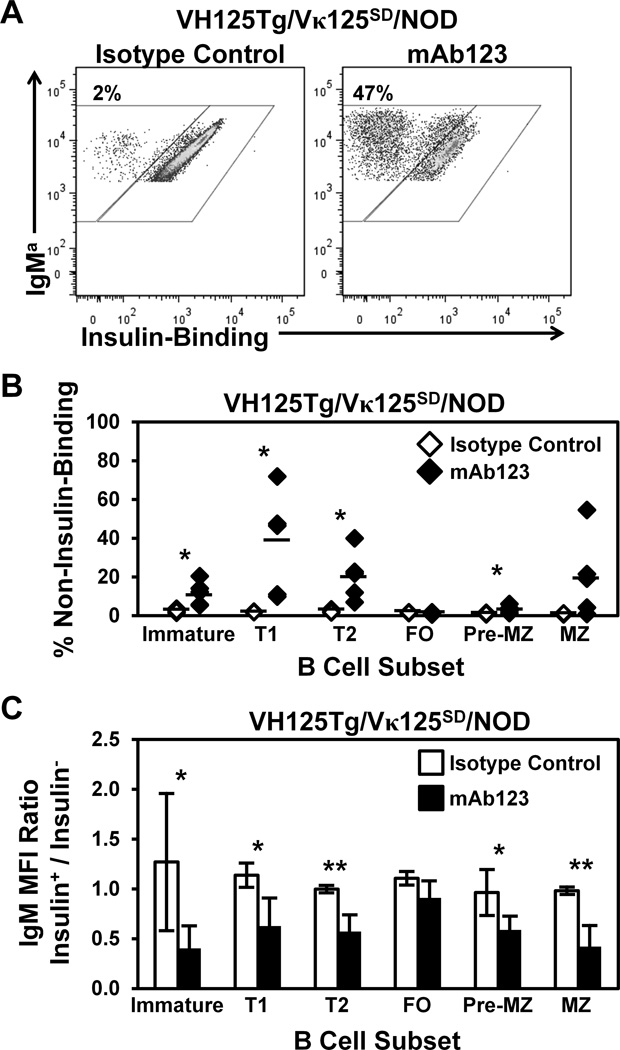
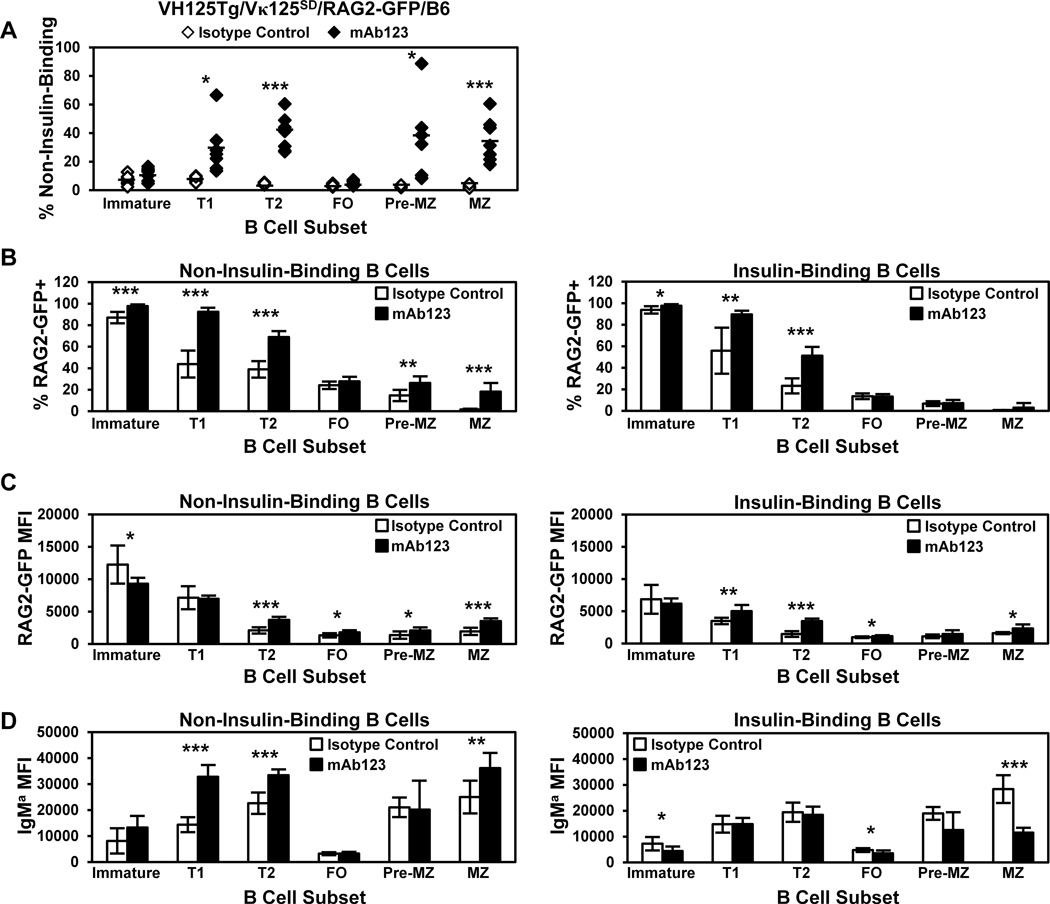
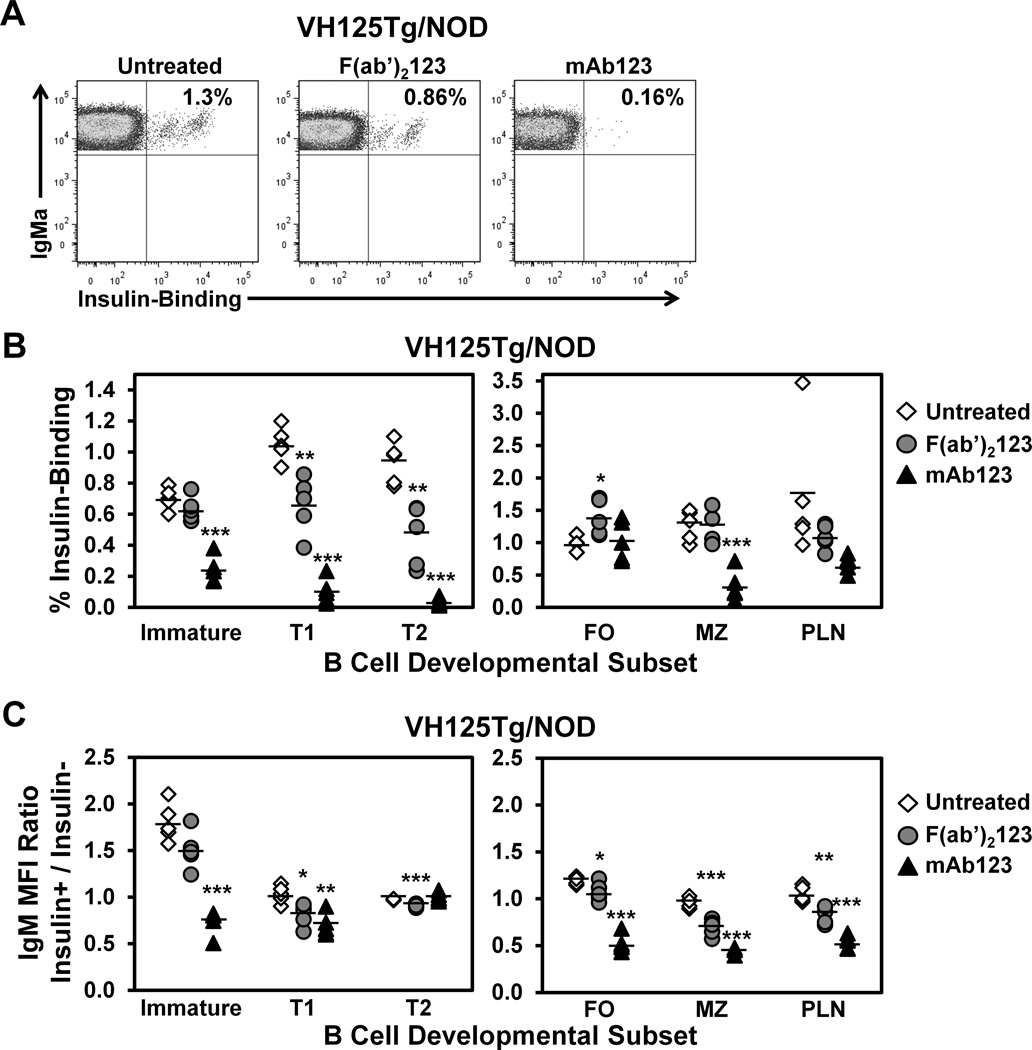
Autoreactive B lymphocytes that commonly arise in the developing repertoire can be salvaged by receptor editing, a central tolerance mechanism that alters BCR specificity through continued L chain rearrangement. It is unknown whether autoantigens with weak cross-linking potential, such as insulin, elicit receptor editing, or whether this process is dysregulated in related autoimmunity. To resolve these issues, we developed an editing-competent model in which anti-insulin Vκ125 was targeted to the Igκ locus and paired with anti-insulin VH125Tg. Physiologic, circulating insulin increased RAG-2 expression and was associated with BCR replacement that eliminated autoantigen recognition in a proportion of developing anti-insulin B lymphocytes. The proportion of anti-insulin B cells that underwent receptor editing was reduced in the type 1 diabetes-prone NOD strain relative to a nonautoimmune strain. Resistance to editing was associated with increased surface IgM expression on immature (but not transitional or mature) anti-insulin B cells in the NOD strain. The actions of mAb123 on central tolerance were also investigated, because selective targeting of insulin-occupied BCR by mAb123 eliminates anti-insulin B lymphocytes and prevents type 1 diabetes. Autoantigen targeting by mAb123 increased RAG-2 expression and dramatically enhanced BCR replacement in newly developed B lymphocytes. Administering F(ab')2123 induced IgM downregulation and reduced the frequency of anti-insulin B lymphocytes within the polyclonal repertoire of VH125Tg/NOD mice, suggesting enhanced central tolerance by direct BCR interaction. These findings indicate that weak or faulty checkpoints for central tolerance can be overcome by autoantigen-specific immunomodulatory therapy.
Copyright © 2015 by The American Association of Immunologists, Inc.
Figures
Similar articles
-
Autoantigen-specific B-cell depletion overcomes failed immune tolerance in type 1 diabetes.Diabetes. 2012 Aug;61(8):2037-44. doi: 10.2337/db11-1746. Epub 2012 Jun 14. Diabetes. 2012. PMID: 22698916 Free PMC article.
-
B lymphocyte "original sin" in the bone marrow enhances islet autoreactivity in type 1 diabetes-prone nonobese diabetic mice.J Immunol. 2013 Jun 15;190(12):5992-6003. doi: 10.4049/jimmunol.1201359. Epub 2013 May 15. J Immunol. 2013. PMID: 23677466 Free PMC article.
-
Reversing Tolerance in Isotype Switch-Competent Anti-Insulin B Lymphocytes.J Immunol. 2015 Aug 1;195(3):853-64. doi: 10.4049/jimmunol.1403114. Epub 2015 Jun 24. J Immunol. 2015. PMID: 26109644 Free PMC article.
-
Antigen-specific responses in autoimmunity and tolerance.Immunol Res. 2001;23(2-3):235-44. doi: 10.1385/IR:23:2-3:235. Immunol Res. 2001. PMID: 11444388 Review.
-
Autoreactivity and the positive selection of B cells.Eur J Immunol. 2015 Nov;45(11):2971-7. doi: 10.1002/eji.201444622. Epub 2015 Sep 9. Eur J Immunol. 2015. PMID: 26350303 Review.
Cited by
-
Impaired B-cell tolerance checkpoints promote the development of autoimmune diseases and pathogenic autoantibodies.Immunol Rev. 2019 Nov;292(1):90-101. doi: 10.1111/imr.12821. Epub 2019 Nov 12. Immunol Rev. 2019. PMID: 31721234 Free PMC article. Review.
-
The Multiple Roles of B Lymphocytes in the Onset and Treatment of Type 1 Diabetes: Interactions between B Lymphocytes and T Cells.J Diabetes Res. 2021 Nov 3;2021:6581213. doi: 10.1155/2021/6581213. eCollection 2021. J Diabetes Res. 2021. PMID: 34778464 Free PMC article. Review.
-
Comparative analysis of the repertoire of insulin-reactive B cells in type 1 diabetes-prone and resistant mice.Front Immunol. 2022 Oct 4;13:961209. doi: 10.3389/fimmu.2022.961209. eCollection 2022. Front Immunol. 2022. PMID: 36275764 Free PMC article.
-
Type 1 diabetes pathogenesis and the role of inhibitory receptors in islet tolerance.Ann N Y Acad Sci. 2020 Feb;1461(1):73-103. doi: 10.1111/nyas.14106. Epub 2019 Apr 26. Ann N Y Acad Sci. 2020. PMID: 31025378 Free PMC article. Review.
-
Productive Germinal Center Responses Depend on the Nature of Stimuli Received by Anti-Insulin B Cells in Type 1 Diabetes-Prone Mice.Immunohorizons. 2023 Jun 1;7(6):384-397. doi: 10.4049/immunohorizons.2300036. Immunohorizons. 2023. PMID: 37261716 Free PMC article.
References
-
- Wardemann H, Yurasov S, Schaefer A, Young JW, Meffre E, Nussenzweig MC. Predominant autoantibody production by early human B cell precursors. Science. 2003;301:1374–1377. - PubMed
-
- Goodnow CC, Crosbie J, Adelstein S, Lavoie TB, Smith-Gill SJ, Brink RA, Pritchard-Briscoe H, Wotherspoon JS, Loblay RH, Raphael K, Trent RJ, Basten A. Altered immunoglobulin expression and functional silencing of self-reactive B lymphocytes in transgenic mice. Nature. 1988;334:676–682. - PubMed
-
- Nemazee DA, Burki K. Clonal deletion of B lymphocytes in a transgenic mouse bearing anti-MHC class I antibody genes. Nature. 1989;337:562–566. - PubMed
Publication types
MeSH terms
Substances
Associated data
- Actions
- Actions
- Actions
- Actions
- Actions
- Actions
- Actions
- Actions
- Actions
- Actions
- Actions
- Actions
- Actions
- Actions
- Actions
- Actions
- Actions
- Actions
- Actions
- Actions
- Actions
- Actions
- Actions
- Actions
- Actions
- Actions
- Actions
- Actions
- Actions
- Actions
- Actions
- Actions
- Actions
- Actions
- Actions
- Actions
- Actions
- Actions
- Actions
- Actions
- Actions
- Actions
- Actions
- Actions
- Actions
- Actions
- Actions
- Actions
- Actions
- Actions
- Actions
- Actions
- Actions
- Actions
- Actions
- Actions
- Actions
- Actions
- Actions
- Actions
- Actions
- Actions
- Actions
- Actions
- Actions
- Actions
- Actions
- Actions
- Actions
- Actions
- Actions
- Actions
- Actions
- Actions
- Actions
- Actions
- Actions
- Actions
- Actions
- Actions
- Actions
- Actions
- Actions
- Actions
- Actions
- Actions
- Actions
- Actions
- Actions
- Actions
- Actions
Grants and funding
LinkOut - more resources
Full Text Sources
Other Literature Sources
Medical
