Review
. 2016 Jan;228(1):R1-18.
doi: 10.1530/JOE-15-0309. Epub 2015 Oct 2.

Endocrine and other physiologic modulators of perinatal cardiomyocyte endowment

Affiliations
Review

Endocrine and other physiologic modulators of perinatal cardiomyocyte endowment

S S Jonker et al. J Endocrinol. 2016 Jan.

Abstract

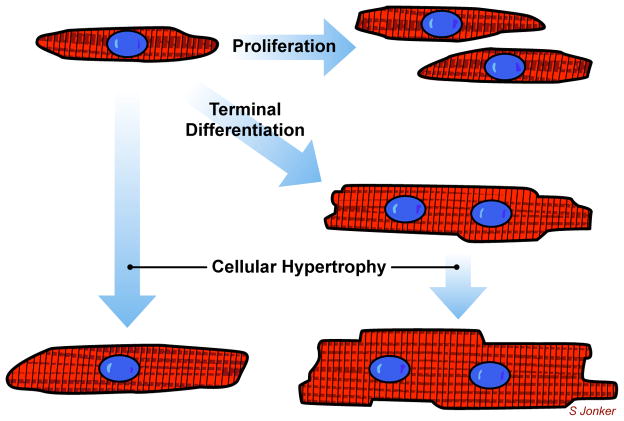
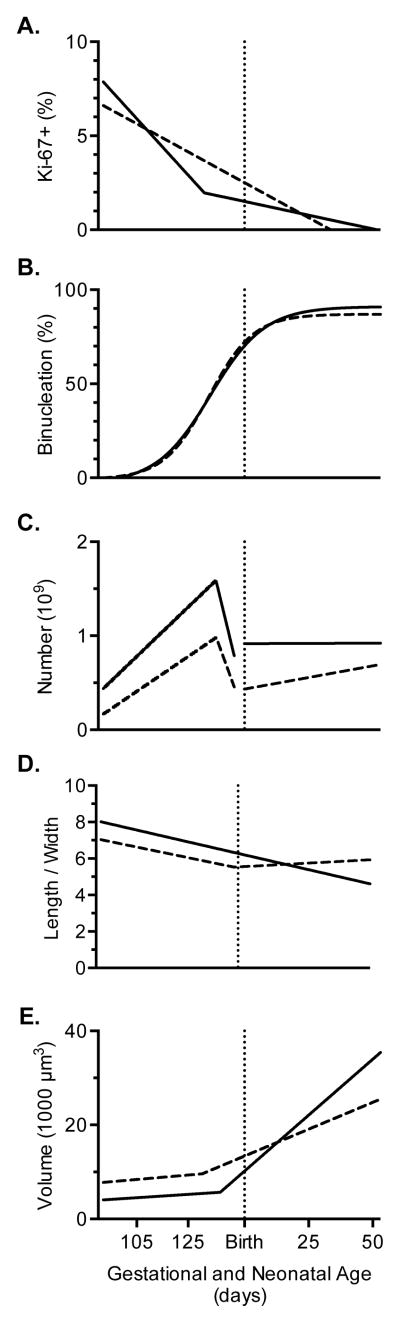
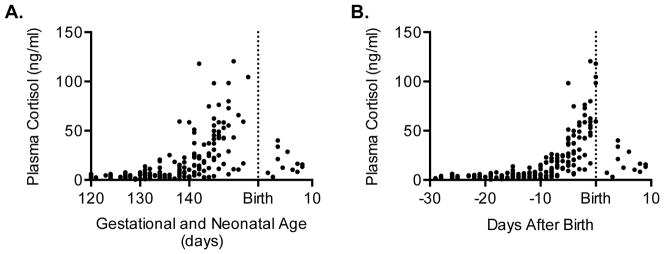
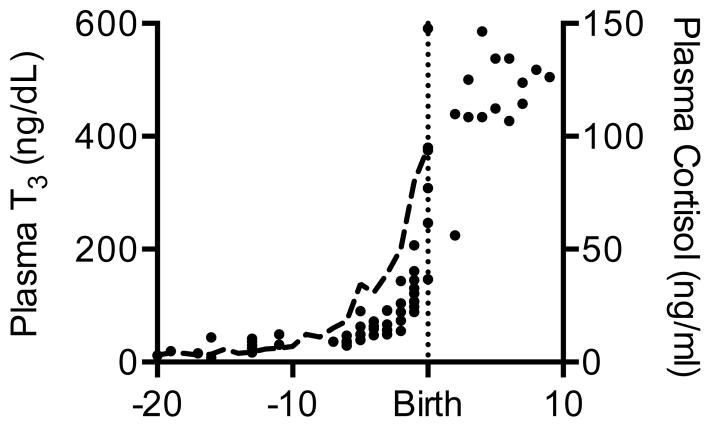
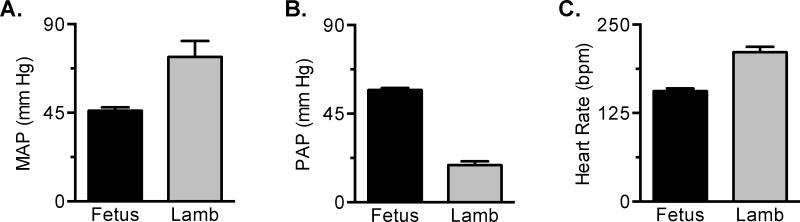
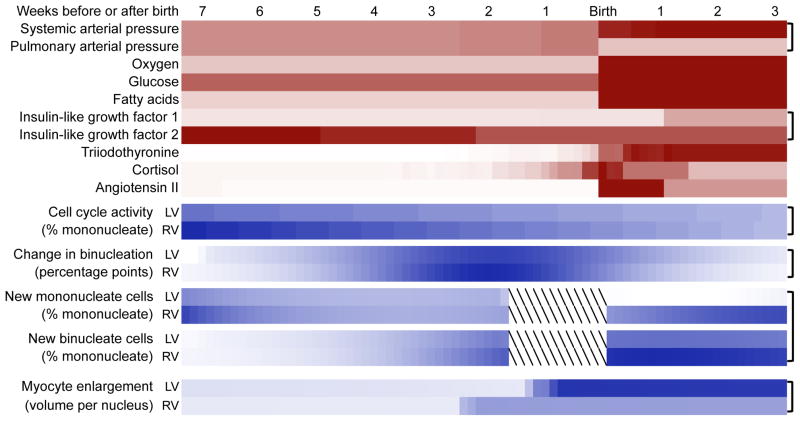
Immature contractile cardiomyocytes proliferate to rapidly increase cell number, establishing cardiomyocyte endowment in the perinatal period. Developmental changes in cellular maturation, size and attrition further contribute to cardiac anatomy. These physiological processes occur concomitant with a changing hormonal environment as the fetus prepares itself for the transition to extrauterine life. There are complex interactions between endocrine, hemodynamic and nutritional regulators of cardiac development. Birth has been long assumed to be the trigger for major differences between the fetal and postnatal cardiomyocyte growth patterns, but investigations in normally growing sheep and rodents suggest this may not be entirely true; in sheep, these differences are initiated before birth, while in rodents they occur after birth. The aim of this review is to draw together our understanding of the temporal regulation of these signals and cardiomyocyte responses relative to birth. Further, we consider how these dynamics are altered in stressed and suboptimal intrauterine environments.

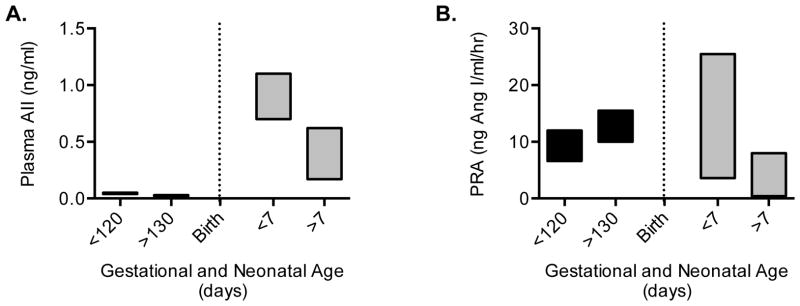
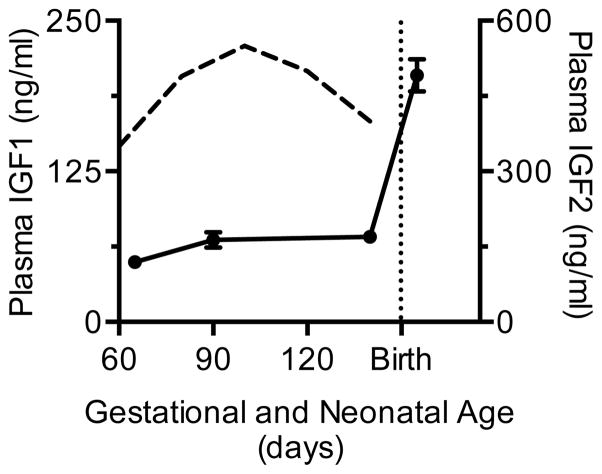
Keywords: angiotensin II; birth; cardiomyocyte growth; cortisol; heart development; hypertension; hypoxia; insulin-like growth factor 1; terminal differentiation; thyroid hormone.


Conflict of interest statement

Declaration of interest

The authors declare that there is no conflict of interest that could be perceived as prejudicing the impartiality of this review.

Figures

Figure 1
Figure 1
Modes of cardiomyocyte growth in the fetal heart. Mononucleated cardiomyocytes have the potential to proliferate. They can also become binucleated, indicative that they are unable to undergo further cytokinesis. They can, however, replicate their DNA and become polyploid (not shown). Both mononucleated and binucleated cardiomyocytes can undergo cellular enlargement, or apoptosis (not shown).
Figure 2
Figure 2
Regulation of cardiomyocyte growth and maturation in the normally-growing fetal and neonatal sheep left ventricle (LV, solid line) and right ventricle (RV, dashed line). Cell cycle activity as assessed by Ki-67 positivity (A) supports cardiomyocyte proliferation and terminal differentiation. Binucleation of cardiomyocytes (B) is an index of terminal differentiation, after which cells infrequently enter the cell cycle, and even less frequently undergo cytokinesis. Consequent to myocyte proliferation, cell number (C) increases rapidly in the fetus (and slowly in the neonatal RV). Cell attrition reduces myocyte number prior to birth in both ventricles. Cardiomyocytes typically grow more rapidly in width than length, decreasing their length-to-width ratio (D), except after birth in the neonatal RV. Myocyte volume (E) increases slowly in the fetus, but more rapidly after birth (much more so in the LV). Most changes in cell growth and maturation rates occur before birth. Data from Jonker et al. ( and 2007b).
Figure 3
Figure 3
Published ranges for (A) angiotensin II (AII) and (B) plasma renin activity (PRA) in normal fetal (black) and newborn (grey) sheep. Owing to the short half-life of AII, PRA is often measured instead of AII (renin converts angiotensinogen to angiotensin I). Data from Broughton Pipkin et al. (1974); Fleischman et al. (1975); Louey et al. (2000); Louey et al. (2007); Rosenfeld et al. (1995); Siegel and Fisher (1980); Velaphi et al. (2007).
Figure 4
Figure 4
Circulating insulin-like growth factor 1 (IGF1; solid line, mean ± standard error) and insulin-like growth factor 2 (IGF2; dashed line, mean) in normal fetal and newborn sheep. Data from Carr et al. (1995); Crespi et al. (2006).
Figure 5
Figure 5
Circulating cortisol levels in normal fetal and newborn sheep expressed relative to (A) gestational age, or (B) the time of birth. Data from Louey et al. (2000); Magyar et al. (1980).
Figure 6
Figure 6
Circulating triiodothyronine (T3; symbols) levels in normal fetal and newborn sheep expressed relative to the timing of birth; the prepartum T3 surge is driven by the prepartum cortisol surge (dashed line, mean data from Figure 5). Data from Klein et al. (1978); Mathur et al. (1980).
Figure 7
Figure 7
(A) Resting mean arterial pressure (MAP), (B) pulmonary arterial pressure (PAP), and (C) heart rate in normal fetal (118–142d GA, black) and newborn (2–28 days old, grey) sheep. Data from Black et al. (2002); Dawes et al. (1980); Fineman et al. (1994); Iwamoto et al. (1987); Jaillard et al. (2001); Louey et al. (2000); Morin and Egan (1992); Stahlman et al. (1967); data are mean ± standard error.
Figure 8
Figure 8
Overview of growth-regulating factors (red) and cardiomyocyte growth kinetics (blue) in the perinatal sheep heart. Proliferation and maturation are expressed to emphasize changing rates of growth processes in the LV and RV, rather than the accumulated outcome of these processes, and how these kinetics might relate to changing endocrine and other physiological modulators of growth. Daily number of new mononucleated and binucleated myocytes are shown normalized to mononucleated cell number (because these are the cells that enter the cell cycle to proliferate or terminally differentiate). Myocyte volume enlargement is expressed relative to nuclear number because DNA content appears to critically mediate magnitude of hypertrophic response in cardiomyocytes. Each parameter is expressed as a monochrome heat map (light = low, dark = high) and is derived from data described in this manuscript. Related data sets (bracketed) share a saturation scale and are comparable across rows. The values within the hatched area cannot be estimated because, while proliferation and terminal differentiation almost certainly continue, cell number declines in this period.

References

    1. Adler CP. Relationship between deoxyribonucleic acid content and nucleoli in human heart muscle cells and estimation of cell number during cardiac growth and hyperfunction. Recent Advances In Studies On Cardiac Structure and Metabolism. 1975;8:373–386. - PubMed
    1. Adler CP, Costabel U. Cell number in human heart in atrophy, hypertrophy, and under the influence of cytostatics. Recent Adv Stud Cardiac Struct Metab. 1975;6:343–355. - PubMed
    1. Adler CP, Costabel U. Myocardial DNA and cell number under the influence of cytostatics. I. Post mortem investigations of human hearts. Virchows Arch B Cell Pathol Incl Mol Pathol. 1980;32:109–125. - PubMed
    1. Adler CP, Friedburg H, Herget GW, Neuburger M, Schwalb H. Variability of cardiomyocyte DNA content, ploidy level and nuclear number in mammalian hearts. Virchows Archiv. 1996;429:159–164. - PubMed
    1. Anderson DF, Barbera A, Faber JJ. Substantial reductions in blood pressure after bilateral nephrectomy in fetal sheep. Am J Physiol. 1994;266:H17–20. - PubMed

Publication types

LinkOut - more resources