. 2015 Oct;38(10):866-75.
doi: 10.14348/molcells.2015.0115. Epub 2015 Oct 2.

Physiological Functions of the COPI Complex in Higher Plants

Affiliations

Physiological Functions of the COPI Complex in Higher Plants

Hee-Kyung Ahn et al. Mol Cells. 2015 Oct.

Abstract

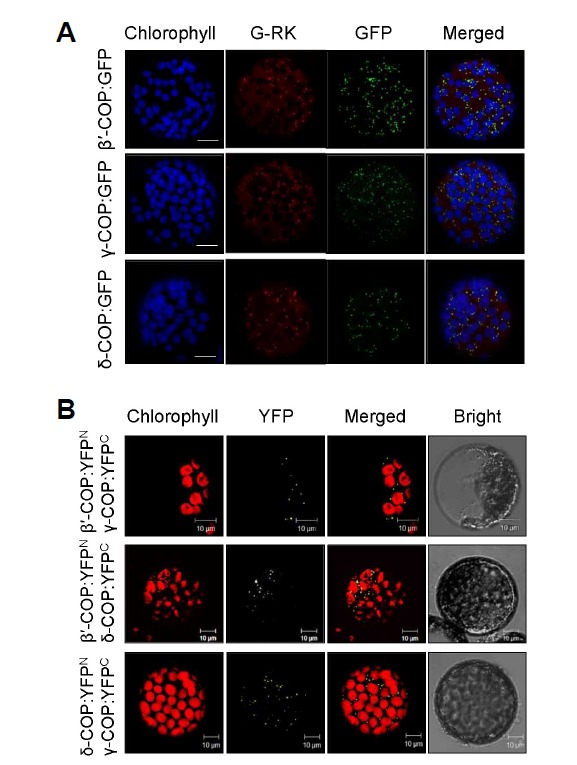
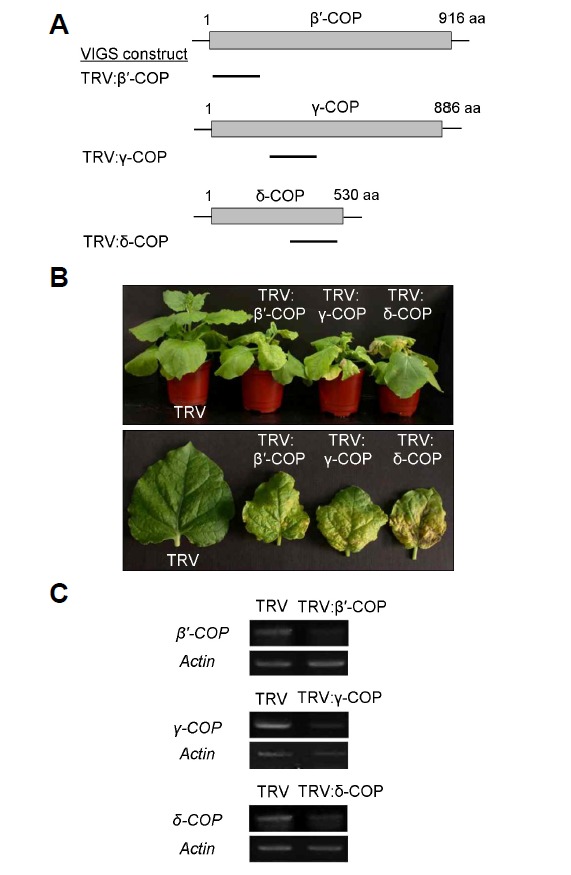
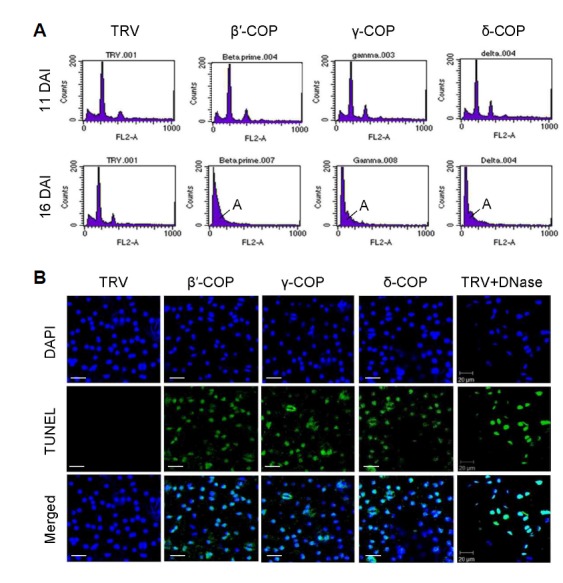
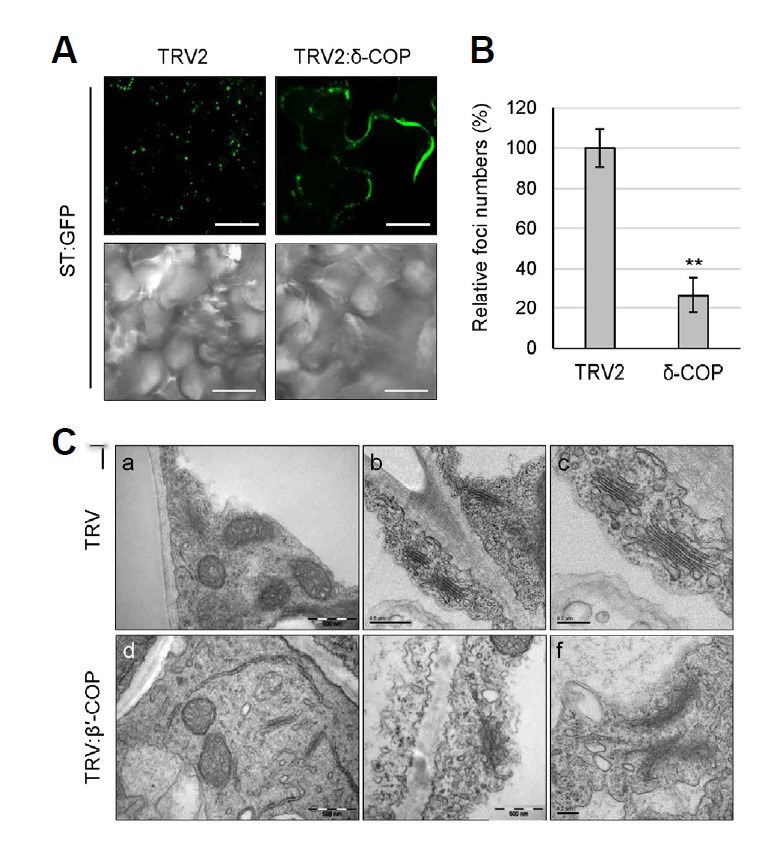
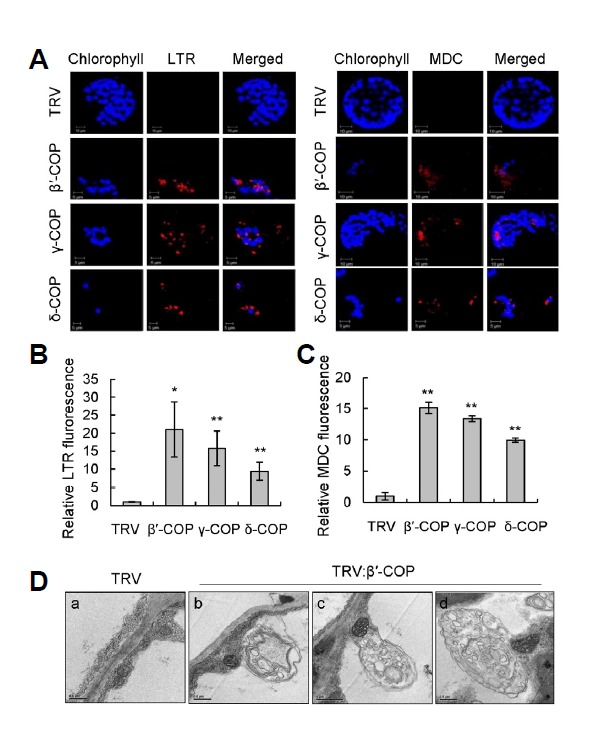
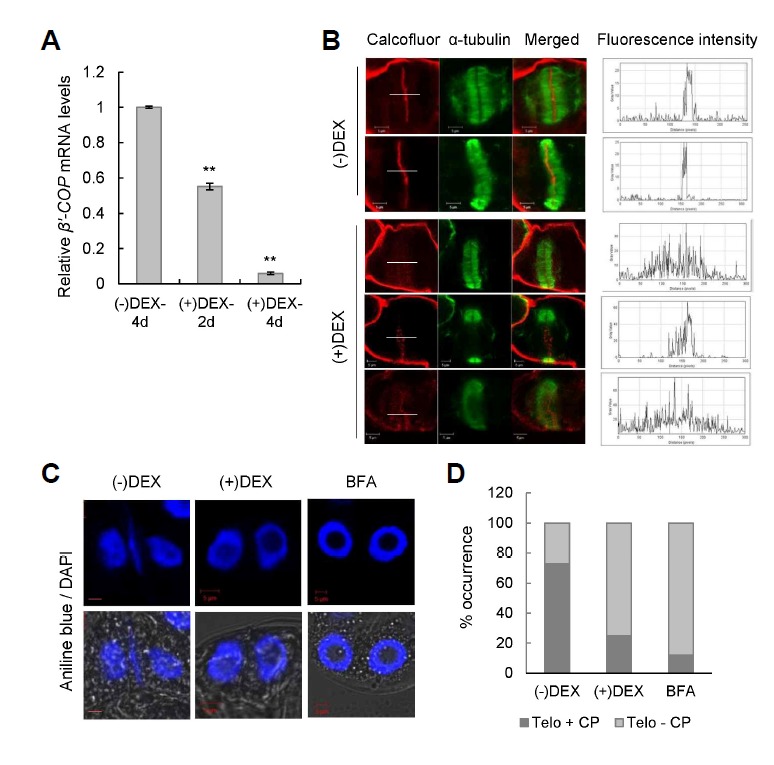
COPI vesicles are essential to the retrograde transport of proteins in the early secretory pathway. The COPI coatomer complex consists of seven subunits, termed α-, β-, β'-, γ-, δ-, ε-, and ζ-COP, in yeast and mammals. Plant genomes have homologs of these subunits, but the essentiality of their cellular functions has hampered the functional characterization of the subunit genes in plants. Here we have employed virus-induced gene silencing (VIGS) and dexamethasone (DEX)-inducible RNAi of the COPI subunit genes to study the in vivo functions of the COPI coatomer complex in plants. The β'-, γ-, and δ-COP subunits localized to the Golgi as GFP-fusion proteins and interacted with each other in the Golgi. Silencing of β'-, γ-, and δ-COP by VIGS resulted in growth arrest and acute plant death in Nicotiana benthamiana, with the affected leaf cells exhibiting morphological markers of programmed cell death. Depletion of the COPI subunits resulted in disruption of the Golgi structure and accumulation of autolysosome-like structures in earlier stages of gene silencing. In tobacco BY-2 cells, DEX-inducible RNAi of β'-COP caused aberrant cell plate formation during cytokinesis. Collectively, these results suggest that COPI vesicles are essential to plant growth and survival by maintaining the Golgi apparatus and modulating cell plate formation.

Keywords: COPI vesicle; Golgi localization; autophagy; cell death; cell plate formation; virus-induced gene silencing.


Figures

Fig. 1.
Fig. 1.
Subcellular localization and protein interactions of COPI subunits. Each experiment was performed at least three times, and representative images are shown. (A) GFP-fusion proteins of N. benthamiana β′-, γ-, and δ-COP were expressed in N. benthamiana leaves through agroinfiltration, and GFP signal in leaf protoplasts was examined by confocal microscopy. To mark the Golgi complex, G-RK (red fluorescence) was co-expressed with the GFP fusion proteins. Chlorophyll autofluorescence is pseudo-colored blue. Scale bars = 10 μm. (B) BiFC was performed to detect in vivo interactions between N. benthamiana COPI subunits. β′-COP:YFPN and γ-COP:YFPC, β′-COP:YFPN and δ-COP:YFPC, and δ-COP:YFPN and γ-COP:YFPC were expressed together via agroinfiltration, and the YFP signal in leaf protoplasts was observed by confocal microscopy.
Fig. 2.
Fig. 2.
Virus-induced gene silencing (VIGS) of COPI subunit genes in N. benthamiana. (A) Schematic drawing of N. benthamiana β′-, γ-, and δ-COP genes and VIGS constructs. Bars indicate cDNA fragments of each gene cloned into the TRV vector. (B) VIGS phenotypes of β′-, γ-, and δ-COP in comparison with the TRV control phenotype. The whole plants (top) and individual leaves (bottom) are shown at 20 days after infiltration (DAI). (C) Semiquantitative RT-PCR to detect endogenous transcript levels. The actin mRNA level was used as control. Total RNA was prepared from leaves collected from >6 independent VIGS plants. RT-PCR was performed three times, and a representative gel image is shown.
Fig. 3.
Fig. 3.
Analyses of cell death phenotypes in COPI VIGS N. benthamiana plants. (A) Flow cytometry was performed with leaf nuclei isolated from TRV:β′-COP, TRV:γ-COP, and TRV:δ-COP VIGS plants and TRV control plants at 11 and 16 DAI. Approximately 10,000 nuclei were counted for each sample. A, apoptotic nuclei. (B) The TUNEL assay on TRV:β′-COP, TRV:γ-COP, and TRV:δ-COP VIGS leaves was observed by confocal microscopy. Leaves were counterstained with DAPI to visualize nuclei. TRV and DNase-treated TRV leaves were used as negative and positive controls, respectively. Scale bars = 20 μm.
Fig. 4.
Fig. 4.
Disruption of Golgi structure in COPI deficient plants. (A) VIGS was performed with Arabidopsis δ-COP cDNA fragment in TRV2 vector using Arabidopsis transgenic plants expressing ST-GFP fusion protein as a Golgi marker. GFP fluorescence of leaf samples was observed by confocal microscopy at 12 DAI. Scale bars = 20 μm. (B) For quantification of the Golgi-specific foci shown in (A), z-sectioning images were taken serially at 0.5-µm intervals (10 images). After 3-dimensional (3-D) reconstruction, the foci were counted using ImageJ. Approximately 300 foci were counted for each 3-D image, and 9 leaf samples were analyzed for each VIGS line for statistical analysis. Foci numbers of TRV2:δ-COP VIGS plants were expressed relative to that of TRV2 control. Asterisks denote the statistical significance of the differences between TRV2:δ-COP and TRV2 control samples: *P ≤ 0.05; **P ≤ 0.01. (C) Morphology of the Golgi complex in the leaves of the N. benthamiana TRV:β′-COP VIGS plants (12 DAI) was observed by transmission electron microscopy (TEM). Scale bars = 0.5 μm in (a, b, d); 0.2 μm in (c, e, f).
Fig. 5.
Fig. 5.
Detection of autolysosomal structures in COPI VIGS N. benthamiana plants.(A) Lysotracker red (LTR) and monodansylcadaverine (MDC) staining of leaf protoplasts isolated from TRV:β′-COP, TRV:γ-COP, and TRV:δ-COP VIGS plants at 12 DAI. Representative confocal images are shown. Scale bars = 5 μm. (B) LTR fluorescence of leaf protoplasts from COPI VIGS plants shown in (A) was expressed relative to that of TRV control. Data represent means ± SD of 30 individual protoplasts. Asterisks denote the statistical significance of the differences between COPI-silenced plants and TRV controls; *P ≤ 0.05; **P ≤ 0.01. (C) MDC fluorescence of leaf protoplasts from COPI VIGS plants shown in (A) was expressed relative to that of TRV control. Data represent means ± SD of 30 individual protoplasts. (D) Representative TEM images of the cytoplasm in mesophyll cells of TRV and TRV:β′-COP VIGS plants at 12 DAI. Scale bars = 0.5 μm in (a, b, d); 1 μm in (c).
Fig. 6.
Fig. 6.
Defective cell plate formation in DEX-inducible β′-COP RNAi BY-2 cells. (A) Real-time quantitative RT-PCR was performed to determine the β′-COP mRNA level in the RNAi BY-2 cells after 2 days (2 d) or 4 days (4 d) of 15 µM DEX treatment. The transcript levels were expressed relative to that of BY-2 cells ethanol-treated for 4 days [(−)DEX-4 d]. Data points represent means ± SD of three replicate experiments; *P ≤ 0.05; **P ≤ 0.01. (B) BY-2 cells were double-labeled with calcofluor staining (pseudo-colored red) and anti-α-tubulin antibodies to visualize the cell plate and the phragmoplast, respectively, after 4 days of ethanol (-DEX) or DEX treatment. The right-most panels show the calcofluor fluorescence intensity profiles spanning the cell plate (white lines). Scale bars = 5 μm. (C) BY-2 cells were double-labeled with aniline blue and DAPI to visualize the cell plate and the nuclei, respectively. Representative telophase cells are shown. BY-2 cells were treated with 20 µM BFA as positive control. Scale bars = 5 μm. (D) Telophase cells with (Telo + CP) or without the newly forming cell plate (Telo - CP) shown in (C) were quantified (n = ∼80 for each sample). Values are expressed as percentage of total telophase cells counted.

References

    1. Ahn C.S., Han J.A., Lee H.S., Lee S., Pai H.-S. The PP2A regulatory subunit Tap46, a component of the TOR signaling pathway, modulates growth and metabolism in plants. Plant Cell. 2011;23:185–209. - PMC - PubMed
    1. Avila-Ospina L., Moison M., Yoshimoto K., Masclaux-Daubresse C. Autophagy, plant senescence, and nutrient recycling. J. Exp. Bot. 2014;65:3799–3811. - PubMed
    1. Assaad F.F. Plant cytokinesis. Exploring the links. Plant Physiol. 2001;126:509–516. - PMC - PubMed
    1. Bassham D.C. Plant autophagy-more than a starvation response. Curr. Opin. Plant Biol. 2007;10:587–593. - PubMed
    1. Bassham D.C., Brandizzi F., Otegui M.S., Sanderfoot A.A. The secretory system of Arabidopsis. The Arabidopsis Book. 2008;6:e0116. - PMC - PubMed

Publication types

MeSH terms

LinkOut - more resources