. 2016 Jun 16;35(24):3151-62.
doi: 10.1038/onc.2015.365. Epub 2015 Oct 5.

Atypical role of sprouty in colorectal cancer: sprouty repression inhibits epithelial-mesenchymal transition

Affiliations

Atypical role of sprouty in colorectal cancer: sprouty repression inhibits epithelial-mesenchymal transition

Q Zhang et al. Oncogene. .

Erratum in

Abstract

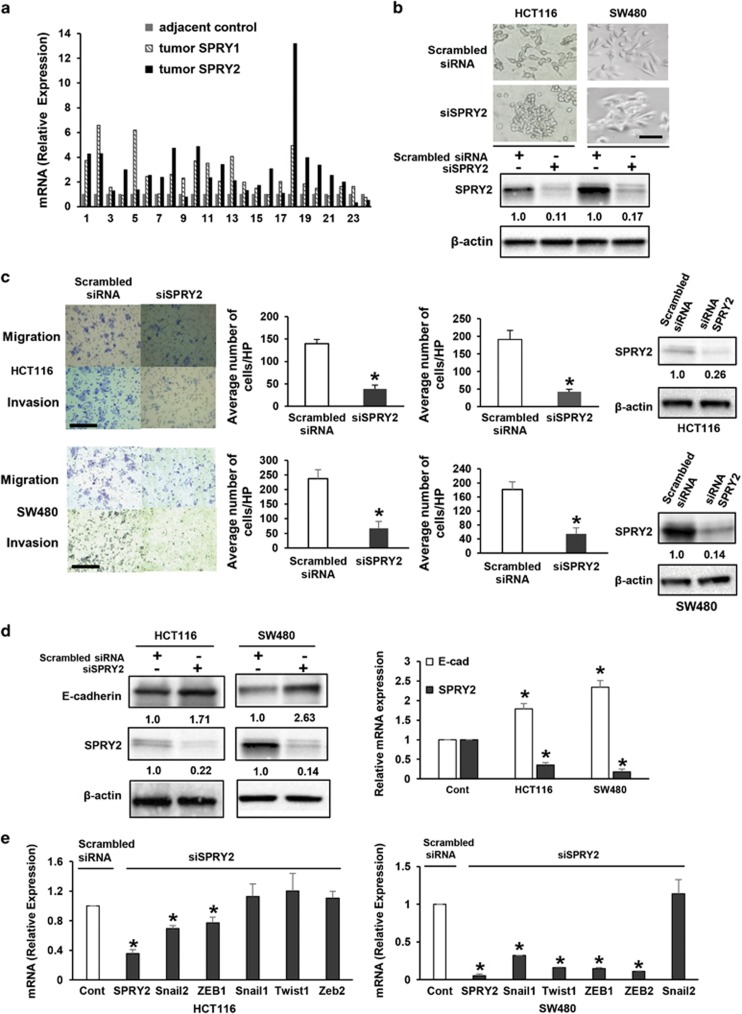
Sprouty (SPRY) appears to act as a tumor suppressor in cancer, whereas we demonstrated that SPRY2 functions as a putative oncogene in colorectal cancer (CRC) (Oncogene, 2010, 29: 5241-5253). We investigated the mechanisms by which SPRY regulates epithelial-mesenchymal transition (EMT) in CRC. SPRY1 and SPRY2 mRNA transcripts were significantly upregulated in human CRC. Suppression of SPRY2 repressed AKT2 and EMT-inducing transcription factors and significantly increased E-cadherin expression. Concurrent downregulation of SPRY1 and SPRY2 also increased E-cadherin and suppressed mesenchymal markers in colon cancer cells. An inverse expression pattern between AKT2 and E-cadherin was established in a human CRC tissue microarray. SPRY2 negatively regulated miR-194-5p that interacts with AKT2 3' untranslated region. Mir-194 mimics increased E-cadherin expression and suppressed cancer cell migration and invasion. By confocal microscopy, we demonstrated redistribution of E-cadherin to plasma membrane in colon cancer cells transfected with miR-194. Spry1(-/-) and Spry2(-/-) double mutant mouse embryonic fibroblasts exhibited decreased cell migration while acquiring several epithelial markers. In CRC, SPRY drive EMT and may serve as a biomarker of poor prognosis.


Conflict of interest statement

The authors declare no conflict of interest.

Figures

Figure 1
Figure 1
SPRY1 and SPRY2 expression is upregulated in human CRC and silencing of SPRY2 suppresses EMT in colon cancer cells. (a) SPRY1 and SPRY2 mRNA levels in a human colon adenocarcinoma cDNA array containing 24 matched pairs (48 samples) covering 24 normal and 24 adenocarcinomas. Expression levels are shown relative to matched normal samples from all 24 patients. (b) Morphological changes in SPRY2 siRNA (100 nm, 96 h) transfected HCT116 and SW480 cells. A representative western blotting with quantification of SPRY2 expression in control scrambled siRNA or siRNA SPRY2-transfected cells, size bar=50 μm. Results were confirmed by repeating the experiment seven times (n=7). (c) SPRY2 suppression decreases cell migration and invasion of HCT116 and SW480 cells in a trans-well migration and invasion assay. Average number of cells from three random microscopic high power (HP) fields per insert were counted, size bar=200 μm. Results from three experiments (n=3) were analyzed, and data are expressed as mean±s.d., *P<0.05. Western blotting represents relative SPRY2 expression in HCT116 and SW480 cells used in migration and invasion assays. (d) SPRY2 suppression increases E-cadherin protein and mRNA expression. A representative western blotting and quantification of SPRY2 and E-cadherin protein in control scrambled siRNA or siRNA SPRY2-transfected cells. Results were confirmed by repeating the experiment five times (n=5). SPRY2 and E-cadherin mRNA expression (mean±s.d., (n=5), *P<0.05) in HCT116 and SW480 cells transfected with control scrambled siRNA or siRNA SPRY2. (e) SPRY2 suppression decreases EMT markers (EMT-inducing transcription factors); mRNA levels were determined in HCT116 and SW480 cells transfected with control scrambled siRNA or SPRY2 siRNA. Results are mean±s.d., (n=5), *P<0.05.
Figure 2
Figure 2
Increased miR-194 levels in SPRY2-downregulated cancer cells and miR-194 transfection suppresses EMT. (a) Cancer cells were transfected with scrambled siRNA or SPRY2 siRNA. SPRY2 suppression significantly increases miR-194-5p levels in HCT116 and SW480 cells. Results are mean±s.d. (n=5), *P<0.05. (b) Morphological changes in miR-194 mimic (100 nm, 96 h) transfected HCT116 and SW480 cells. The bar diagram represents relative miRNA-194 contents of miR-control or miR-194 mimic-transfected cells, size bar=50 μm. Results are mean±s.d. (n=5), *P<0.05. (c) miR-194 alters E-cadherin expression; a representative western blotting and quantification of E-cadherin protein in miR-control or miR-194 mimics (100 nm, 96 h) or miR-194 inhibitor (200 nm, 96 h) transfected cells (n=5). The bar diagrams represent relative miRNA-194 contents of miR-194 control or miR-194 mimic or inhibitor-transfected cells used for western blotting. Results are mean±S.D. (n=5), *P<0.05. (d) miR-194 mimic accentuates, whereas (e) miR-194 inhibitor decreases siSPRY2-induced upregulation of E-cadherin. A representative western blotting of E-cadherin and SPRY2 expression in SPRY2-downregulated SW480 cells or in combination with miR-194 mimic or miR-194 inhibitor transfections (n=3). The bar diagram represents relative miR-194 contents of miR-194 mimic or inhibitor-transfected cells used for western blotting. Results are mean±s.d. (n=3), *P<0.05. (f) miR-194 transfection decreases cell migration and invasion of HCT116 and SW480 cells in a trans-well assay. Average number of cells from three random microscopic fields per insert were counted, size bar=200 μm. Results from three independent experiments were analyzed, and data are expressed as mean±s.d., (n=3), *P<0.05. The bar diagram also represents relative miRNA-194 contents of miR-control or miR-194 mimic-transfected cells used in migration and invasion assays. Results are mean±s.d., (n=3), *P<0.05.
Figure 3
Figure 3
MiR-194 reduces AKT2. (a) miR-194 decreases AKT2 protein levels in cancer cells; a representative western blotting and quantification of AKT2 protein in miR-control or miR-194 mimic-transfected cells (n=5). The bar diagram represents relative miRNA-194 contents of miR-control or miR-194 mimic-transfected cells used for western blotting. Results are mean±s.d., (n=5), *P<0.05. (b) SPRY2 suppression decreases AKT2 expression. A representative western blotting of SPRY2 and AKT2 protein expression in HCT116 and SW480 cells transfected with control scrambled siRNA or siRNA SPRY2 (n=5). (c) Effect of miR-194 on the luciferase activities of wild-type and mutant AKT2 3′UTR reporters; cancer cells were transfected with pCMV miR-empty vector or miR-194 precursor vector (pCMV-miR-194) and pmir-GLO empty vector (Empty Vector) or 3′UTR wild-type AKT2 (pmir-GLO vector-AKT2 3′UTR) or 3′UTR mutant AKT2 (pmir-GLO vector-AKT2 3′UTR mutant) for 48 h. Luciferase activities were determined using a dual luciferase assay. Relative expression of firefly luciferase was standardized to a transfection control. Data represent mean±s.d. of three independent experiments in triplicate, *P<0.05. (d) AKT2 suppression increases E-cadherin expression; a representative western blotting and quantification of E-cadherin and AKT2 in HCT116 and SW480 cells transfected with control scrambled siRNA or AKT2 siRNA (n=5). Bar diagram represents miR-194 contents of control siRNA or siRNA AKT2 transfected cells. (e) AKT2 lacking 3′UTR transfection reverses siSPRY2-induced upregulation of E-cadherin. A representative western blotting of E-cadherin expression in SW480 cells transfected with siSPRY2 or in combination with AKT2 lacking 3′UTR (n=3). (f) miR-194 accentuates siAKT2-induced upregulation of E-cadherin. A representative western blotting of E-cadherin expression in SW480 cells transfected with siAKT2 or miR-194 mimics or in combination (n=3). The bar diagram represents relative miR-194 contents of control or siRNA AKT2 or miR-194 or combination of siAKT2 and mir-194-transfected cells used for western blotting (n=3). Data represents (one-way analysis of variance) mean±s.d. of three independent experiments, *P<0.05.
Figure 4
Figure 4
Mir-194 increases E-cadherin association with membrane and an inverse expression pattern of AKT2 with E-cadherin in human CRC. Cancer cells were transfected with miR-control or miR-194 and plated on collagen-coated cover slips. Immunofluorescence confocal microscopy was performed to assess the expression and localization of AKT2 and E-cadherin. Mir-194 transfection significantly increased membrane localization of E-cadherin and partial association of E-cadherin with AKT2 in (a) HCT116 and (b) SW480 cells, (n=5). The size bar is 20 μm. (c) Human CRC tissue microarrays were used to quantify AKT2 and E-cadherin expression. Tissue microarray contained paraffin-embedded sections from 33 matched pairs (66 samples covering 33 adjacent normal and 33 adenocarcinomas). To quantify immunostaining, images of cross-sections were captured under identical imaging conditions and imported into Image-Pro Plus software. Six regions of interest (ROI) were drawn. The amount of positive immunostaining within each ROI (expressed as positive pixels/mm2) was determined by false color segmentation analysis. Results are mean±s.d., *P<0.05. (d) Immunostaining of AKT2 and E-cadherin in three representative adenocarcinomas and adjacent normal tissue. (e) Boxplot charts demonstrating higher E-cadherin and lower AKT2 expression in normal adjacent tissue when compared with adenocarcinomas shown in panel (d). Immunohistochemical results were shown as Integral Optical Density (IOD)/area. Median value of each group is shown as the middle solid line within each box. Top and bottom lines of each box indicate 75th and 25th percentiles, respectively. Trendline connects the mean value of each group. Nonparametric Mann–Whitney U-test is adopted owing to the non-normal distribution of data. Both tests lead to significant differences at P<0.001.
Figure 5
Figure 5
SPRY1 and SPRY2 suppression in colon cancer cells or deletion of Spry1 and Spry2 in MEFs upregulates epithelial and reduces mesenchymal markers. mRNA transcripts of epithelial (E-cadherin, ZO1 and Occludin) and mesenchymal/EMT (Zeb1, SNAIL2, fsp1, N-cadherin and Vimentin) markers in (a) HCT116 and (b) SW480 cells transfected with control scrambled siRNA or a mixture of SPRY1 (75 nm) and SPRY2 (75 nm) siRNA. Results are mean±s.d., (n=5), *P<0.05. (c) Tamoxifen treatment resulted in deletion of Spry1 and Spry2 that was confirmed by quantitative RT–PCR and lacZ expression, size bar=500 μm. Results are mean±s.d., (n=5), *P<0.05. (d) Tamoxifen-dependent recombination and deletion of Spry1 and Spry2 in MEFs increases the expression of epithelial markers. mRNA transcripts of des, ZO1, Keratin-14 and Keratin-18 in Spry1−/−;Spry2−/− MEFs. Results are mean±s.d., (n=5), *P<0.05. (e) Deletion of Spry1 and Spry2 in MEFs reduces cell migration in a trans-well migration assay. Average number of cells from three random microscopic high power (HP) fields per insert were counted, size bar=400 μm. Results from three experiments (n=3) were analyzed, and data are expressed as mean±s.d., *P<0.05. (f) SPRY signaling in cancer cells and MEFs.

Similar articles

Cited by

References

    1. Hacohen N, Kramer S, Sutherland D, Hiromi Y, Krasnow MA. sprouty encodes a novel antagonist of FGF signaling that patterns apical branching of the Drosophila airways. Cell 1998; 92: 253–263. - PubMed
    1. Leeksma OC, Van Achterberg TA, Tsumura Y, Toshima J, Eldering E, Kroes WG et al. Human sprouty 4, a new ras antagonist on 5q31, interacts with the dual specificity kinase TESK1. Eur J Biochem 2002; 269: 2546–2556. - PubMed
    1. Su AI, Cooke MP, Ching KA, Hakak Y, Walker JR, Wiltshire T et al. Large-scale analysis of the human and mouse transcriptomes. Proc Natl Acad Sci USA 2002; 99: 4465–4470. - PMC - PubMed
    1. Masoumi-Moghaddam S, Amini A, Morris DL. The developing story of Sprouty and cancer. Cancer Metastasis Rev 2014; 33: 695–720. - PMC - PubMed
    1. Holgren C, Dougherty U, Edwin F, Cerasi D, Taylor I, Fichera A et al. Sprouty-2 controls c-Met expression and metastatic potential of colon cancer cells: sprouty/c-Met upregulation in human colonic adenocarcinomas. Oncogene 2010; 29: 5241–5253. - PMC - PubMed

MeSH terms