Randomized Controlled Trial
. 2015 Oct 5:5:14691.
doi: 10.1038/srep14691.

Differential Responses of Plasma Adropin Concentrations To Dietary Glucose or Fructose Consumption In Humans

Affiliations
Randomized Controlled Trial

Differential Responses of Plasma Adropin Concentrations To Dietary Glucose or Fructose Consumption In Humans

Andrew A Butler et al. Sci Rep. .

Abstract

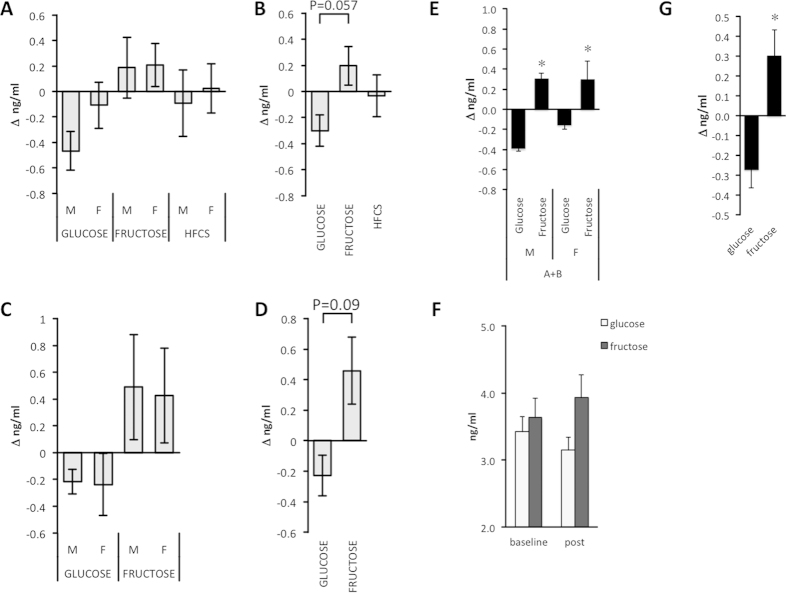
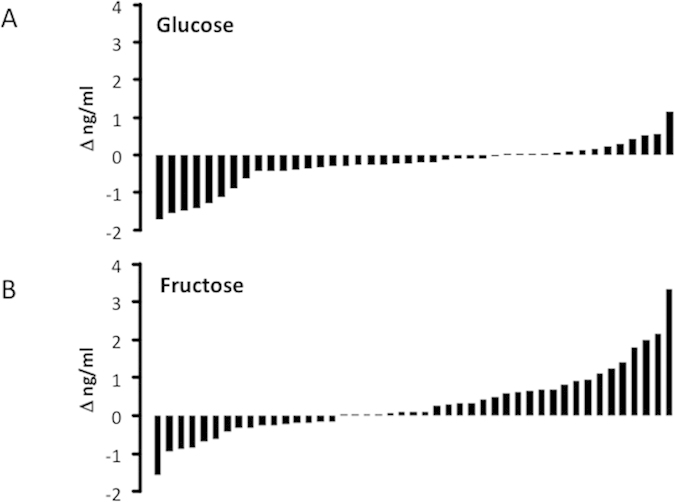
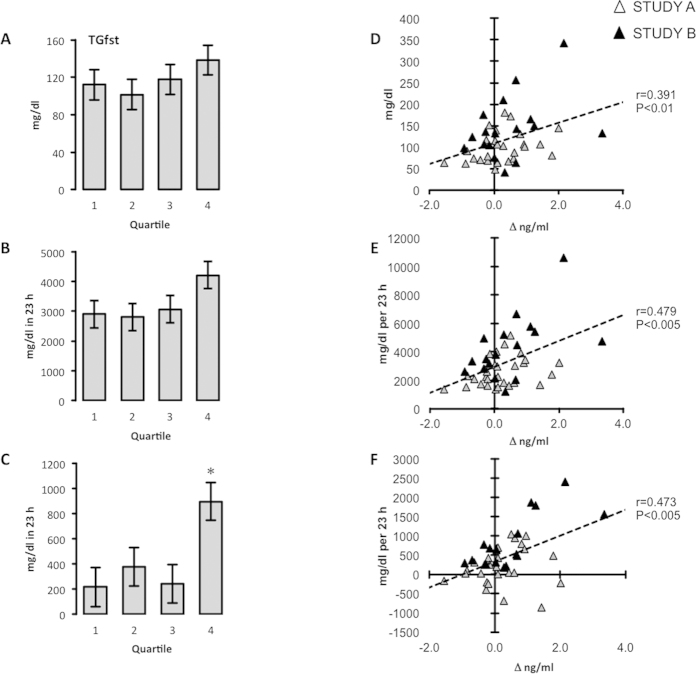
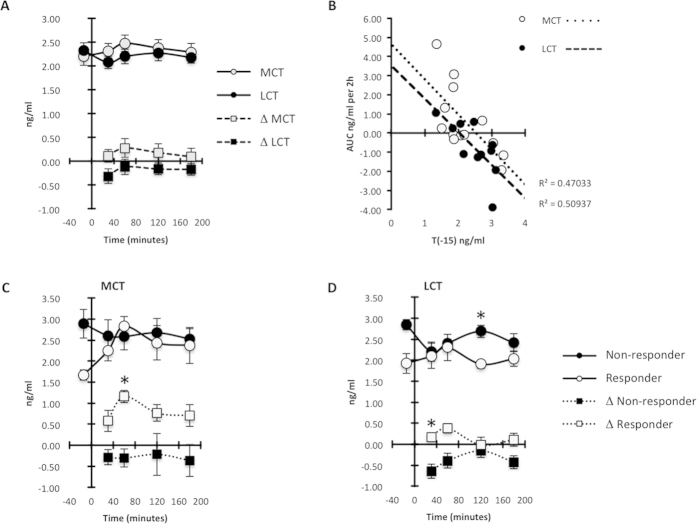
Adropin is a peptide hormone encoded by the Energy Homeostasis Associated (ENHO) gene whose physiological role in humans remains incompletely defined. Here we investigated the impact of dietary interventions that affect systemic glucose and lipid metabolism on plasma adropin concentrations in humans. Consumption of glucose or fructose as 25% of daily energy requirements (E) differentially affected plasma adropin concentrations (P < 0.005) irrespective of duration, sex or age. Glucose consumption reduced plasma adropin from 3.55 ± 0.26 to 3.28 ± 0.23 ng/ml (N = 42). Fructose consumption increased plasma adropin from 3.63 ± 0.29 to 3.93 ± 0.34 ng/ml (N = 45). Consumption of high fructose corn syrup (HFCS) as 25% E had no effect (3.43 ± 0.32 versus 3.39 ± 0.24 ng/ml, N = 26). Overall, the effect of glucose, HFCS and fructose on circulating adropin concentrations were similar to those observed on postprandial plasma triglyceride concentrations. Furthermore, increases in plasma adropin levels with fructose intake were most robust in individuals exhibiting hypertriglyceridemia. Individuals with low plasma adropin concentrations also exhibited rapid increases in plasma levels following consumption of breakfasts supplemented with lipids. These are the first results linking plasma adropin levels with dietary sugar intake in humans, with the impact of fructose consumption linked to systemic triglyceride metabolism. In addition, dietary fat intake may also increase circulating adropin concentrations.


Figures

Figure 1
Figure 1. Effects of sugar consumption on plasma adropin concentrations.
(A) The change (Δ) in plasma adropin concentrations is shown for males (M, N = 43) and females (F,N = 39) who consumed glucose (N = 28; 15M, 13F), fructose (N = 28; 15M, 13F) or HFCS (N = 26, 13M, 13F) for 2 wk (Study A). (B) There was no significant effect of sex; data grouped by sugar type only are also shown. (C) Change (Δ) in plasma adropin concentrations is shown for males (M, N = 15) and females (F, N = 16) who consumed glucose (N = 14; 6 M, 8 F) or fructose (N = 16; 9M, 8F) for 10 wk (Study B). (D) There was no significant effect of sex; data from Study B grouped are also shown grouped by sugar type. (E–F) Data pooled from Study A and B for the glucose and fructose groups. (E) Males (M, N = 45) and females (F, N = 42) exhibited similar responses to glucose (N = 42) or fructose (45) consumption; *P < 0.01. (F) Plasma adropin levels at baseline were similar for the glucose and fructose groups, but then diverged with the consumption of glucose or fructose as 25% of daily energy requirements. (G) The difference in the effect of glucose or fructose consumption on plasma adropin levels was highly significant. *P < 0.01.
Figure 2
Figure 2. Individuals vary in their response to glucose or fructose consumption.
(A) Change in plasma adropin concentrations (Δ ng/ml) with glucose consumption in individuals. (B) Change in plasma adropin concentrations with fructose consumption in individuals. The data shown in panels (A,B) are combined from Study (A) and Study (B).
Figure 3
Figure 3. Association between the increase in plasma adropin levels with fructose consumption and fasting TG (A,D), total area under the curve for TG over 23 h (B,E) and integrative area under the curve for TG over 23 h (C,F).
The TG shown in (AC) are averages based on quartile for Δadropin adjusted for age, sex, BMI and % body fat. The quartiles are for Δadropin ranked from 1st (lowest) to 4th (highest). *P < 0.05 vs. 1st and 3rd quartile. Scatterplots shown in (DF) have baseline TG data (fasting, total or integrative area under the curve) in the y-axis, and Δadropin in the x-axis.
Figure 4
Figure 4. Effects of MCT or LCT consumption on plasma adropin concentrations suggests a responder/nonresponder situation.
(A) Averages in the absolute values and delta (Δ, values at the various time points minus baseline) following MCT or LCT consumption. (B) Inverse association between the area under the curve (AUC) for the change in plasma adropin concentrations and baseline values taken 15 minutes before consumption of meals containing MCT or LCT. (C) Individuals who are “responders” exhibit a marked increase in plasma adropin concentrations after consumption of MCT when compared to “low responders”. “High responders” are characterized by having low plasma adropin concentrations at baseline, with MCT consumption increasing plasma adropin levels to that observed in “low responders”. *P < 0.05. (D) The distinction between responders and nonresponders following LCT consumption is less clear. While the Δ in plasma adropin was higher in responders, this was due to nonresponders showing a marked decline in adropin following consumption of the meal.

References

    1. Ganesh Kumar K. et al. Adropin deficiency is associated with increased adiposity and insulin resistance. Obesity (Silver Spring) 20, 1394–402 (2012). - PMC - PubMed
    1. Kumar K. G. et al. Identification of adropin as a secreted factor linking dietary macronutrient intake with energy homeostasis and lipid metabolism. Cell Metab 8, 468–81 (2008). - PMC - PubMed
    1. Gao S. et al. Therapeutic effects of adropin on glucose tolerance and substrate utilization in diet-induced obese mice with insulin resistance. Mol Metab 4, 310–324 (2015). - PMC - PubMed
    1. Gao S. et al. Regulation of substrate oxidation preferences in muscle by the peptide hormone adropin. Diabetes 63, 3242–52 (2014). - PMC - PubMed
    1. Lovren F. et al. Adropin is a novel regulator of endothelial function. Circulation 122, S185–92 (2010). - PubMed

Publication types