. 2015 Oct 5:5:14693.
doi: 10.1038/srep14693.

Plasma membrane restricted RhoGEF activity is sufficient for RhoA-mediated actin polymerization

Affiliations

Plasma membrane restricted RhoGEF activity is sufficient for RhoA-mediated actin polymerization

Jakobus van Unen et al. Sci Rep. .

Abstract

The small GTPase RhoA is involved in cell morphology and migration. RhoA activity is tightly regulated in time and space and depends on guanine exchange factors (GEFs). However, the kinetics and subcellular localization of GEF activity towards RhoA are poorly defined. To study the mechanism underlying the spatiotemporal control of RhoA activity by GEFs, we performed single cell imaging with an improved FRET sensor reporting on the nucleotide loading state of RhoA. By employing the FRET sensor we show that a plasma membrane located RhoGEF, p63RhoGEF, can rapidly activate RhoA through endogenous GPCRs and that localized RhoA activity at the cell periphery correlates with actin polymerization. Moreover, synthetic recruitment of the catalytic domain derived from p63RhoGEF to the plasma membrane, but not to the Golgi apparatus, is sufficient to activate RhoA. The synthetic system enables local activation of endogenous RhoA and effectively induces actin polymerization and changes in cellular morphology. Together, our data demonstrate that GEF activity at the plasma membrane is sufficient for actin polymerization via local RhoA signaling.


Figures
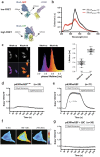
Figure 1
Figure 1. Rapid and reversible GPCR mediated GTP loading of RhoA by p63RhoGEF, measured by a novel high contrast RhoA FRET biosensor.
(a) A cartoon of the DORA-RhoA biosensor consisting of full length RhoA (shown in light blue) fused to CFP, connected via a linker to YFP fused to the Rho binding domain of PKN1 (shown in lila) (structures are based on pdb entries 1CXZ, 1MYW and 3ZTF). (b) Average emission spectra (±s.e.m) acquired from living cells (n = 10) of the non-binding RhoA biosensor (RhoAsensor-nb) and the mutant constitutive GTP loaded RhoA biosensor (RhoAsensor-ca). (c) (left) Donor intensity images (top) and phase lifetime images (bottom) of the RhoAsensor-ca (left) and the RhoAsensor-nb (right) with a false-color coded lifetime according to the scale depicted in the combined lifetime histograms of the same experiment (middle). (right) Accumulated FLIM data for RhoAsensor-ca and RhoAsensor-nb, showing the median phase lifetime from multiple cells (at least 8 acquisitions, n = 28 and n = 24, respectively). Box limits indicate the 25th and 75th percentiles as determined by R software; whiskers extend 1.5 times the interquartile range from the 25th and 75th percentiles. (d) Control FRET ratio-imaging experiments in HeLa cells transfected with DORA-RhoA biosensor and only the first 29 a.a. of p63RhoGEF, containing the plasma membrane targeting sequence, show minimal changes in YFP/CFP ratio (n = 29). (e) Time-lapse FRET ratio imaging of HeLa cells transfected with the DORA-RhoA biosensor and RFP-p63RhoGEF (n = 71) show fast reversible increase in YFP/CFP ratio, indicating rapid GTP loading of RhoA upon GPCR stimulation. (f) Average ratio images at three time intervals of a single cell from the experiment shown in (e). (g) Pre-incubation with the Gαq-inhibitor QIC (2 μM) abolishes the DORA-RhoA biosensor response by GPCR stimulation in RFP-p63RhoGEF transfected cells (n = 30). HeLa cells were stimulated with Histamine (100 μM) at t = 40 s and the response was antagonized by the addition of Pyrilamine (10 μM) at t = 160 s. Time traces show the average ratio change of YFP/CFP fluorescence (±s.e.m). Average curves consist of data from at least 3 independent experiments, conducted on different days. Width of the individual images in (f) corresponds to 65 μm.
Figure 2
Figure 2. GEF activity at the plasma membrane increases actin polymerization.
(a) HeLa cells transiently transfected with YFP-p63RhoGEF, YFP-cDH or YFP-pmDH constructs were stained for F-actin after 24 hours with TRITC-phalloidin and DAPI. The panels show from left to right YFP fluorescence, indicating the transfected cells, F-actin staining and the overlay of YFP, actin and DAPI (b) Quantification of F-actin in HeLa cells by determining the fluorescent intensity of the TRITC-phalloidin staining in transfected cells and normalization to the intensity of untransfected control cells in the same experiment. YFP-p63RhoGEF n = 18 (control n = 143), YFP-cDH n = 11 (control n = 46), YFP-pmDH n = 32 (control n = 134). Statistical significance per condition was determined by performing a two-tailed student T-test. Width of the individual images in (a) is 236 μm.
Figure 3
Figure 3. Expression of the differentially localized DH domains of p63RhoGEF, pmDH and cDH, increases Rho-GTP levels with opposite spatial distributions.
(a) Boxplot showing the basal YFP/CFP ratio of the DORA RhoA biosensor in HeLa cells. Cells transfected with the constitutive active (ca, n = 21) or non-binding (nb, n = 26) RhoA biosensor were co-transfected with an empty vector containing just RFP to keep expression levels equal between the different experimental conditions. Wild-type (wt) RhoA biosensor was transfected with an empty vector containing just RFP (control, n = 29), RFP-p63RhoGEF (n = 36), RFP-pmDH (n = 27) or RFP-cDH (n = 22). (b) Representative ratio images of the pmDH (top panel) and cDH (bottom panel) conditions from the experiment depicted in (a), showing the gradient of RhoA GTP loading state in HeLa cells. (c) Quantification of the spatial distribution of RhoA GTP loading state between the cell cortex (CX) and the cell body (CB) in the pmDH and cDH conditions of the experiment shown in panel (a). The difference value “ratio (CX-CB)” plotted on the y-axis is a measure of spatial inhomogeneity. A value of zero indicates no spatial differences, while a positive value indicates increased RhoA-GTP in the cortex relative to the cell body and a negative value denotes decreased RhoA-GTP in the cortex relative to the cell body (for detailed methods see Supplemental Fig. S3). For boxplots in (a,c); center lines represent the median values; box limits indicate the 25th and 75th percentiles as determined by R software; whiskers extend 1.5 times the interquartile range from the 25th and 75th percentiles; data points are plotted as open circles. Statistical significance between conditions was determined by performing a two-tailed Mann-Whitney test. P-values are shown in plot for the RhoA-wt biosensor conditions with significant different median values. Width of the individual images in (b) is 120 μm.
Figure 4
Figure 4. Recruitment of the DH-domain of p63RhoGEF to the plasma membrane is sufficient for sustained activation of RhoA.
(a) Cartoon illustrating the principle of the recruitment experiment. Rapamycin recruits the cDH domain fused to FKBP12 (F12) to the FRB domain anchored at a membrane, thereby enhancing the local activation. (b) Hela cells transfected with the DORA-RhoA biosensor, Lck-FRB-CFP (W66A) (plasma membrane) and RFP-FKBP12-cDH (n = 28) or RFP-FKBP12 (control, n = 20) were stimulated with Rapamycin (100 nM) at t = 60 s. (c) Hela cells transfected with the DORA-RhoA biosensor, MoA-FRB-CFP (W66A) (mitochondria) and RFP-FKBP12-cDH (n = 18) were stimulated with Rapamycin (100 nM) at t = 40 s. (d) Hela cells transfected with the DORA-RhoA biosensor Giantin-FRB-CFP (W66A) (golgi apparatus) and RFP-FKBP12-cDH (n = 26) were stimulated with Rapamycin (100 nM) at t = 40 s. Time traces show the average ratio change of YFP/CFP fluorescence (±s.e.m). Average curves consist of data from at least 3 independent experiments, conducted on different days.
Figure 5
Figure 5. Recruitment of the DH-domain of p63RhoGEF to the plasma membrane causes translocation of transcription factor MKL2 to the nucleus.
HeLa cells transfected with YFP-MKL2, Lck-FRB-CFP and RFP-FKBP12-cDH (n = 12) or RFP-FKBP12 (n = 18) were stimulated with Rapamycin (100 nM) at t = 150 s. (a) Average time-traces of rapamycin induced translocation of RFP-FKBP12-cDH to the plasma membrane (n = 12), as measured by loss of fluorescence in a region of interest in the cytosol. (b) Average time-traces of RFP-FKBP12-cDH induced YFP-MKL2 translocation to the nucleus in the same cells as (a), as measured by a region of interest in the nucleus. In light grey time-traces are shown for the same experiment performed in RFP-FKBP12 transfected control cells. (c) Representative images at three time intervals of RFP-FKBP12-cDH translocation to the plasma membrane and MKL2 translocation to the nucleus in single cells from the experiment shown in (a,b). Width of the individual images in (c) corresponds to 102 μm.
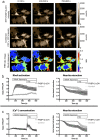
Figure 6
Figure 6. Recruitment of the DH-domain of p63RhoGEF to the plasma membrane causes neurite retraction in N1E-115 cells, and coincides with localized RhoA biosensor activity.
(a) Example of a single N1E-115 retraction and RhoA FRET biosensor experiment. Cells were transfected with DORA-RhoA biosensor, Lck-FRB-CFP (W66A) and RFP-FKBP12-cDH and stimulated with Rapamycin (100 nM) at t = 125 s and Fetal Bovine Serum (FBS) at t = 540 s. Integrated RFP intensity images, added CFP + YFP intensity images and YFP/CFP FRET ratio images are shown of the RhoA-biosensor for three different time intervals (0–100 s, 200–300 s, 700–800 s). (b) Average ratiometric FRET measurements of activated DORA-RhoA biosensor and the corresponding average retraction measurements in N1E-115 cells transfected with RhoA-biosensor, Lck-FRB-CFP (W66A) and RFP-FKBP12-cDH (n = 8) or in RFP-FKBP12 transfected control cells (n = 6, grey). (c) Average ratiometric FRET measurements of intracellular Ca2+ and corresponding average retraction measurements in N1E-115 cells transfected with YC3.60 biosensor, Lck-FRB-CFP (W66A) and RFP-FKBP12-cDH (n = 8) or in RFP-FKBP12 transfected control cells (n = 14, grey). N1E-115 cells were stimulated with Rapamycin (100 nM) at t = 125 s and FBS at t = 540 s. Time traces show the average ratio change of YFP/CFP fluorescence (±s.e.m), or the average retraction of neurites. For details of the cell segmentation and retraction quantification methods, see Supplemental Fig. S4. Width of the individual images in (a) corresponds to 163 μm.

References

    1. Burridge K. & Wennerberg K. Rho and Rac take center stage. Cell 116, 167–179 (2004). - PubMed
    1. Jaffe A. B. & Hall A. Rho GTPases: biochemistry and biology. Annu. Rev. Cell Dev. Biol. 21, 247–269 (2005). - PubMed
    1. Vigil D., Cherfils J., Rossman K. L. & Der C. J. Ras superfamily GEFs and GAPs: validated and tractable targets for cancer therapy? Nat. Rev. Cancer 10, 842–857 (2010). - PMC - PubMed
    1. Barrio-Real L. & Kazanietz M. G. Rho GEFs and cancer: linking gene expression and metastatic dissemination. Sci. Signal. 5, pe43 (2012). - PubMed
    1. Cook D. R., Rossman K. L. & Der C. J. Rho guanine nucleotide exchange factors: regulators of Rho GTPase activity in development and disease. Oncogene 33, 4021–4035 (2013). - PMC - PubMed

Publication types

LinkOut - more resources