Review
. 2015 Sep 28;9(1):52.
doi: 10.1186/s13065-015-0128-x. eCollection 2015 Dec.

Diagnostic techniques in deflagration and detonation studies

Affiliations
Review

Diagnostic techniques in deflagration and detonation studies

William G Proud et al. Chem Cent J. .

Abstract

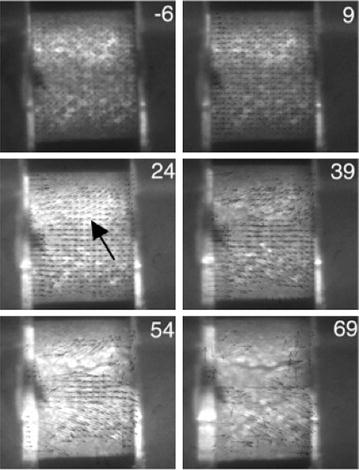
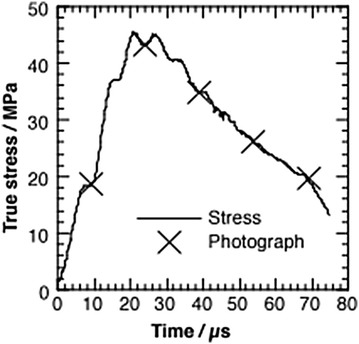
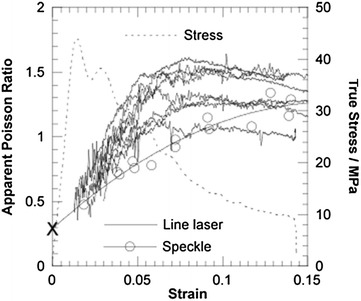
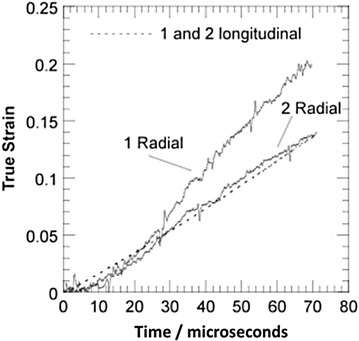
Advances in experimental, high-speed techniques can be used to explore the processes occurring within energetic materials. This review describes techniques used to study a wide range of processes: hot-spot formation, ignition thresholds, deflagration, sensitivity and finally the detonation process. As this is a wide field the focus will be on small-scale experiments and quantitative studies. It is important that such studies are linked to predictive models, which inform the experimental design process. The stimuli range includes, thermal ignition, drop-weight, Hopkinson Bar and Plate Impact studies. Studies made with inert simulants are also included as these are important in differentiating between reactive response and purely mechanical behaviour.

Keywords: Characterisation; Diagnostic; Experimental; High-speed; Quantitative.


Figures

Fig. 1
Fig. 1
a Crystal structure b Crystal parameters of copper (II) styphnate tetrahydrate in terms of atomic displacement factor (U eq) [8]
Fig. 2
Fig. 2
Cylinders used in a post-experimental b photographic studies of DDT [15]
Fig. 3
Fig. 3
DDT event in ultrafine PETN [21]
Fig. 4
Fig. 4
Typical output from a drop-weight stress transducer used in these studies [4]
Fig. 5
Fig. 5
The ignition under impact of a thermite composition in a transparent anvil drop-weight [31]
Fig. 6
Fig. 6
Drop weight modified to detect SHG in HMX crystals during impact [32]
Fig. 7
Fig. 7
Four images, each from a different experiment showing SHG. All images taken less than 13 μs in advance of ignition. All images have enhanced and reversed contrast; black indicates the presence of δ-HMX. Field of view of is 10 mm wide [32]
Fig. 8
Fig. 8
Stress-strain curves showing results for a PBS. Two repeat experiments are shown at three different strain rates [40]
Fig. 9
Fig. 9
Displacement evolution using image correlation in a sample of PBS under Hopkinson Bar Loading. The number indicates microseconds after compression starts, the black arrow the onset of fracture
Fig. 10
Fig. 10
Stress-time plot for the PBS sample in Fig. 9. The crosses correspond to the images in Fig. 9
Fig. 11
Fig. 11
Comparison of apparent Poisson’s ratios from line laser and speckle for 3 specimens. Also shown are the small strain Poisson’s ratio (X) and a typical stress–strain curve [40]
Fig. 12
Fig. 12
Comparison of longitudinal strains from the standard Hopkinson bar analysis to radial strains from the line laser for two specimens
Fig. 13
Fig. 13
Comparison of stress–strain curves calculated assuming volume conservation in the specimen, and those curves which use the apparent Poisson’s ratio (‘corrected’). Only a small difference is seen
Fig. 14
Fig. 14
Flash X-ray of impact experiment. The UK 1 pence piece acts as a indicator of the field of view. The projectile traveling left to right and has struck the target, the fiducial markers do not move on the timescale of the experiment. [44]
Fig. 15
Fig. 15
u-component data, displacement along the line of impact, from plate impact experiment
Fig. 16
Fig. 16
v-component data, displacement orthogonal to the impact direction, from plate impact experiment
Fig. 17
Fig. 17
Displacement measured in PBS material subject to a stepped shock wave. The unshocked region I has no displacement, the initial low shock region II shows displacement indicating compression, region III involving the high shock level has a rapid change in displacement indicated significant compression
Fig. 18
Fig. 18
Experimental arrangements. Top, for gap test, Bottom, for PVDF gauge study
Fig. 19
Fig. 19
Streak records of gap tests on fine-grained PETN 90 % TMD. Gap thickness; top—3.53 mm, second—3.63 mm, third—3.67 mm, bottom—3.71 mm
Fig. 20
Fig. 20
PVDF Output from a gauge separated by 5.54 mm PMMA gap from a C8 detonator
Fig. 21
Fig. 21
The cylinder test arrangement
Fig. 22
Fig. 22
Radius expansion from streak images. Varying mass fraction of Al in NM
Fig. 23
Fig. 23
Velocity histories captured by VISAR for various Al loadings
Fig. 24
Fig. 24
Schematic of wave reflections in the cylinder walls
Fig. 25
Fig. 25
Combined VISAR (solid) and streak (dashed) records for 60 % Al loading

References

    1. Santis LD (2000) A summary of transportation incidents and accidents involving Class 1 materials from 1993 to 1998 in the United States. In: Proceedings of the Annual Conference on Explosives and Blasting Technique. Vol. 1 Cleveland, International Society of Explosives Engineers: 123–132
    1. Deschambault EJ (2006) Relationships between UN transportation tests and NATO SsD 1.2.3 and IM tests. In: Proceedings of the 37th International Annual Conference of Institut für Chemische Technologie. Karlsruhe, Germany: paper 68
    1. Smith GW, Riches MJ, et al. Ultra: a new approach to ultrahigh-speed framing cameras. Proc SPIE. 2001;4183:105–118. doi: 10.1117/12.424267. - DOI
    1. Field JE, Walley SM, Proud WG, Goldrein HT, Siviour CR. Review of experimental techniques for high rate deformation and shock studies. Int J Impact Eng. 2004;30:725–775. doi: 10.1016/j.ijimpeng.2004.03.005. - DOI
    1. Meyers MA. Dynamic behavior of materials. New York: Wiley Interscience; 1994.