. 2012 Feb 1;4(2):513-521.
doi: 10.1039/C2AY05686K. Epub 2012 Jan 26.

Rapid morphological characterization of isolated mitochondria using Brownian motion

Affiliations

Rapid morphological characterization of isolated mitochondria using Brownian motion

Akilan Palanisami et al. Anal Methods. .

Abstract

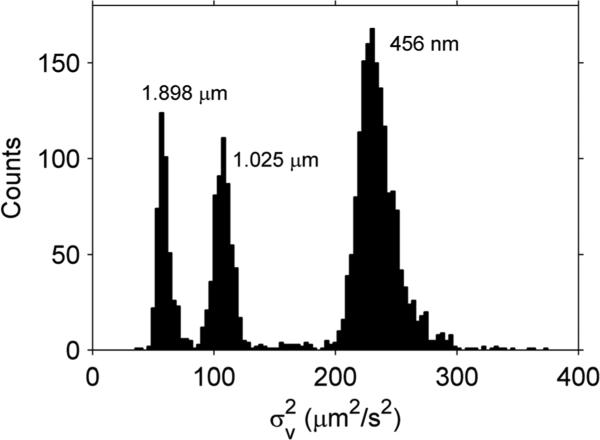
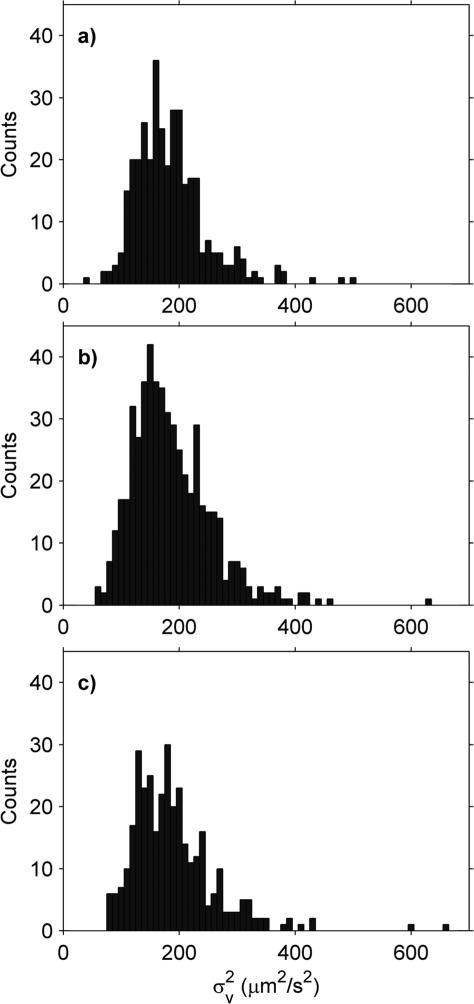
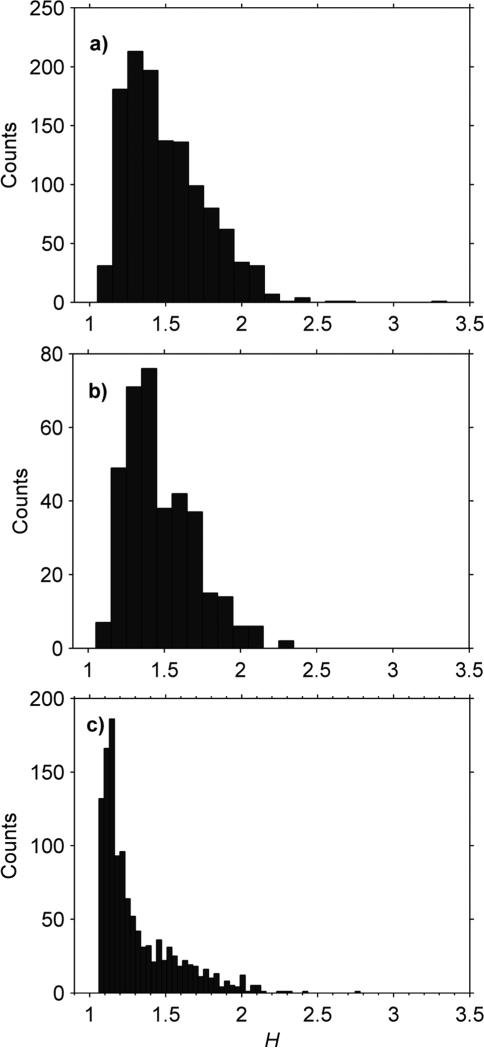
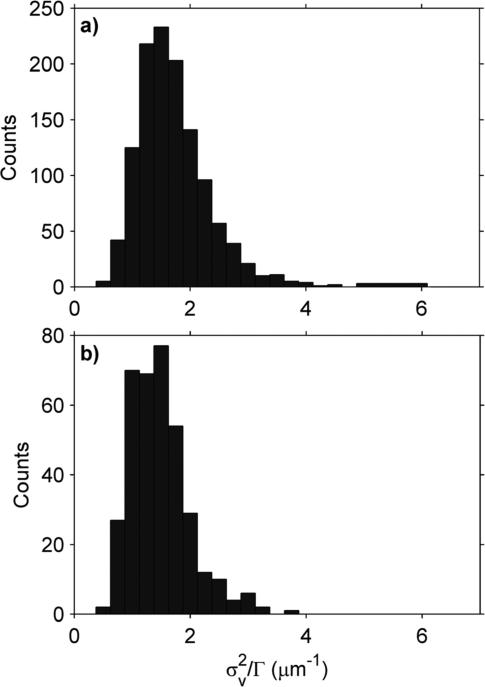
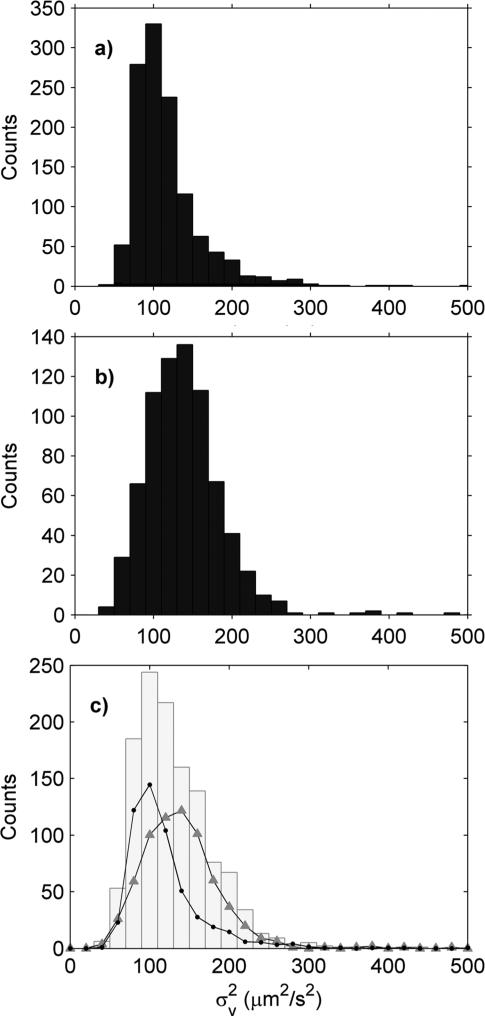
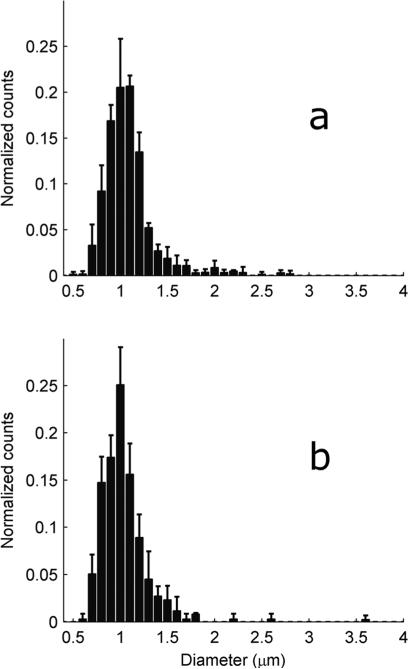
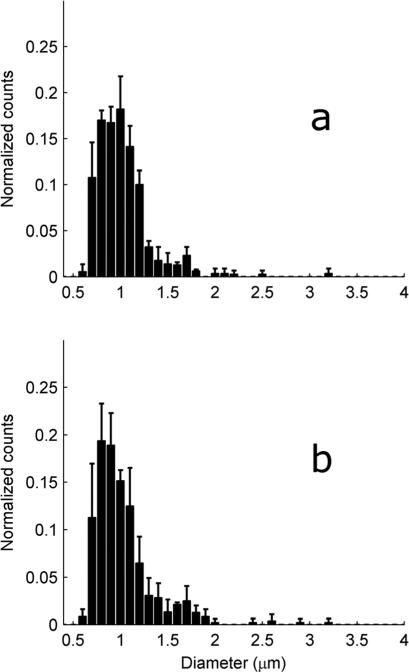
Mitochondrial morphology has been associated with numerous pathologies including cancer, diabetes, obesity and heart disease. However, the connection is poorly understood-in part due to the difficulty of characterizing the morphology. This impedes the use of morphology as a tool for disease detection/monitoring. Here, we use the Brownian motion of isolated mitochondria to characterize their size and shape in a high throughput fashion. By using treadmill exercise training, mitochondria from heart and gastrocnemius of Balb/c mice were modulated in size and used to investigate the protocol. Consistent with previous reports, the heart mitochondria of untrained mice increased 5% in diameter immediately after a single bout of moderate exercise (1.091 ± 0.004 μm) as compared to completely sedentary controls (1.040 ± 0.022 μm). In addition, no change was observed in the size of gastrocnemius mitochondria (1.025 ± 0.018 μm), which was also in agreement with previous studies. The method was also successfully applied to smaller Saccharomyces cerevisiae mitochondria.


Figures

Fig. 1
Fig. 1
σv2 histogram for 0.456 μm, 1.025 μm and 1.898 μm diameter beads in sizing buffer. The different beads were measured separately and combined into a single plot for comparison purposes.
Fig. 2
Fig. 2
Yeast mitochondria σv2 histograms in shrinking buffer using 3 different capillaries: (a) Replicate 1, (b) Replicate 2 and (c) Replicate 3.
Fig. 3
Fig. 3
H histograms of mitochondria in different buffers. (a) Yeast mitochondria in shrinking buffer (total count 1216). (b) Yeast mitochondria in swelling buffer (total count 363). (c) Mouse (C57BK/6) heart mitochondria in combination buffer (total count 1206).
Fig. 4
Fig. 4
Effect of osmotic pressure on σv2. To account for viscosity, σv2 has been scaled by Γ. (a) Shrinking (high osmolar) buffer. (b) Swelling (low osmolar) buffer.
Fig. 5
Fig. 5
σv2 of mouse heart (C57BK/6) and yeast mitochondria in combination buffer. (a) Mouse heart mitochondria (11.81 μg ml−1) only; total count 1206 particles. (b) Yeast mitochondria (1.66 μg ml−1) only; total count 743 particles. (c) Grey histogram is a mixed sample of mouse heart (5.87 μg ml−1) and yeast (2.20 μg ml−1) mitochondria; total count of 1216 particles. The grey histogram was fit using (a) and (b) (circles and triangles respectively), which gave an estimated 5.20 μg ml−1 of mouse heart mitochondria and 1.79 μg ml−1 of yeast mitochondria.
Fig. 6
Fig. 6
Distribution of heart mitochondrial diameter from mice with different exercise histories. To create each figure, the histograms generated from each tissue sample were normalized by the total number of counts, and then all normalized histograms within a mouse group were averaged. The solid bars represent the mean while the error bars represent one standard deviation. (a) EXR, 3 mice. (b) SED, 3 mice.
Fig. 7
Fig. 7
Distribution of the gastrocnemius mitochondrial diameter from mice with different exercise histories. To create each figure, the histograms generated from each tissue sample were normalized by the total number of counts, and then all normalized histograms within a mouse group were averaged. The solid bars represent the mean while the error bars represent one standard deviation. (a) EXR, 2 mice. (b) SED, 3 mice.

References

    1. DiMauro S, Hirano M, Schon EA, editors. Mitochondrial Medicine. Informa Healthcare; Andover: 2006.
    1. Brunk UT, Terman A. Eur. J. Biochem. 2002;269:1996–2002. - PubMed
    1. Kelley DE, He J, Menshikova EV, Ritov VB. Diabetes. 2002;51:2944–2950. - PubMed
    1. Shen X, Zheng S, Thongboonkerd V, Xu M, Pierce WM, Klein JB, Epstein PN. Am. J. Physiol.: Endocrinol. Metab. 2004;287:E896–E905. - PubMed
    1. Modica-Napolitano JS, Singh K. Expert Rev. Mol. Med. 2002;4:1–19. - PubMed

LinkOut - more resources