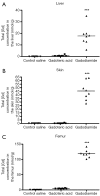
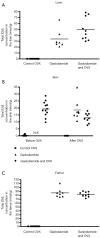
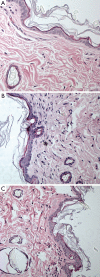
Total gadolinium tissue deposition and skin structural findings following the administration of structurally different gadolinium chelates in healthy and ovariectomized female rats
- PMID: 26435917
- PMCID: PMC4559982
- DOI: 10.3978/j.issn.2223-4292.2015.05.03
Total gadolinium tissue deposition and skin structural findings following the administration of structurally different gadolinium chelates in healthy and ovariectomized female rats
Abstract
Objective: To assess the retention of gadolinium (Gd) in skin, liver, and bone following gadodiamide or gadoteric acid administration.
Methods: Gd was measured in skin, liver and femur bone in female rats 10 weeks after administration of 17.5 mmol Gd/kg over 5 days of Gd agents. Rat skin microscopy, energy filtering transmission electron microscopy and elemental analysis were performed, and repeated after receiving the same dosage of gadodiamide in rats with osteoporosis induced with bilateral ovariectomy (OVX). The OVX was performed 60 days after the last injection of gadodiamide and animals sacrificed 3 weeks later.
Results: Gd concentration was 180-fold higher in the skin, 25-fold higher in the femur, and 30-fold higher in the liver in rats received gadodiamide than rats received gadoteric acid. The retention of Gd in the skin with gadodiamide was associated with an increase in dermal cellularity, and Gd encrustation of collagen fibers and deposition inside the fibroblasts and other cells. No differences in Gd concentration in liver, skin, and femur were observed between rats receiving gadodiamide with or without OVX.
Conclusions: Gd tissue retention with gadodiamide was higher than gadoteric acid. Tissues Gd deposition did not alter following gadodiamide administration to ovariectomized rats.
Keywords: Gadolinium (Gd); bone deposition; osteoporosis; skin; ultrastructural.
Conflict of interest statement
Figures


Similar articles
-
Histology and Gadolinium Distribution in the Rodent Brain After the Administration of Cumulative High Doses of Linear and Macrocyclic Gadolinium-Based Contrast Agents.Invest Radiol. 2017 Jun;52(6):324-333. doi: 10.1097/RLI.0000000000000344. Invest Radiol. 2017. PMID: 28323657 Free PMC article.
-
Does Age Interfere With Gadolinium Toxicity and Presence in Brain and Bone Tissues?: A Comparative Gadoterate Versus Gadodiamide Study in Juvenile and Adult Rats.Invest Radiol. 2019 Feb;54(2):61-71. doi: 10.1097/RLI.0000000000000517. Invest Radiol. 2019. PMID: 30394964 Free PMC article.
-
Safety and Gadolinium Distribution of the New High-Relaxivity Gadolinium Chelate Gadopiclenol in a Rat Model of Severe Renal Failure.Invest Radiol. 2021 Dec 1;56(12):826-836. doi: 10.1097/RLI.0000000000000793. Invest Radiol. 2021. PMID: 34091462
-
Preclinical safety assessment and pharmacokinetics of gadodiamide injection, a new magnetic resonance imaging contrast agent.Invest Radiol. 1993 Mar;28 Suppl 1:S28-43. doi: 10.1097/00004424-199303001-00004. Invest Radiol. 1993. PMID: 8486501 Review.
-
Nephrogenic systemic fibrosis: more questions and some answers.Nephron Clin Pract. 2008;110(1):c24-31; discussion c32. doi: 10.1159/000151228. Epub 2008 Aug 7. Nephron Clin Pract. 2008. PMID: 18688172 Review.
Cited by
-
Gadolinium distribution in kidney tissue determined and quantified by micro synchrotron X-ray fluorescence.Biometals. 2021 Apr;34(2):341-350. doi: 10.1007/s10534-020-00284-8. Epub 2021 Jan 23. Biometals. 2021. PMID: 33486677
-
Gadolinium-Based Contrast Media Nephrotoxicity in Kidney Impairment: The Physio-Pathological Conditions for the Perfect Murder.J Clin Med. 2021 Jan 13;10(2):271. doi: 10.3390/jcm10020271. J Clin Med. 2021. PMID: 33450989 Free PMC article. Review.
-
Manganese-Enhanced Magnetic Resonance Imaging of the Heart.J Magn Reson Imaging. 2023 Apr;57(4):1011-1028. doi: 10.1002/jmri.28499. Epub 2022 Oct 31. J Magn Reson Imaging. 2023. PMID: 36314991 Free PMC article. Review.
-
Increased signal intensities in the dentate nucleus and globus pallidus on unenhanced T1-weighted images: evidence in children undergoing multiple gadolinium MRI exams.Pediatr Radiol. 2016 Oct;46(11):1590-8. doi: 10.1007/s00247-016-3646-3. Epub 2016 Jun 9. Pediatr Radiol. 2016. PMID: 27282825
-
Albumin-based nanoparticles as contrast medium for MRI: vascular imaging, tissue and cell interactions, and pharmacokinetics of second-generation nanoparticles.Histochem Cell Biol. 2021 Jan;155(1):19-73. doi: 10.1007/s00418-020-01919-0. Epub 2020 Oct 11. Histochem Cell Biol. 2021. PMID: 33040183
References
-
- Sieber MA, Pietsch H, Walter J, Haider W, Frenzel T, Weinmann HJ. fibrosis: a possible role for gadolinium-based contrast media. Invest Radiol 2008;43:65-75. - PubMed
-
- Sieber MA, Lengsfeld P, Frenzel T, Golfier S, Schmitt-Willich H, Siegmund F, Walter J, Weinmann HJ, Pietsch H. Preclinical investigation to compare different gadolinium-based contrast agents regarding their propensity to release gadolinium in vivo and to trigger nephrogenic systemic fibrosis-like lesions. Eur Radiol 2008;18:2164-73. - PubMed
-
- Idée JM, Port M, Robic C, Medina C, Sabatou M, Corot C. Role of thermodynamic and kinetic parameters in gadolinium chelate stability. J Magn Reson Imaging 2009;30:1249-58. - PubMed
-
- Morcos SK. Nephrogenic systemic fibrosis following the administration of extracellular gadolinium based contrast agents: is the stability of the contrast agent molecule an important factor in the pathogenesis of this condition? Br J Radiol 2007;80:73-6. - PubMed
-
- Morcos SK, Thomsen HS. Nephrogenic systemic fibrosis: more questions and some answers. Nephron Clin Pract 2008;110:c24-31; discussion c32. - PubMed
LinkOut - more resources
Full Text Sources
