. 2015 Oct 29;526(7575):653-9.
doi: 10.1038/nature15389. Epub 2015 Oct 5.

Projections from neocortex mediate top-down control of memory retrieval

Affiliations

Projections from neocortex mediate top-down control of memory retrieval

Priyamvada Rajasethupathy et al. Nature. .

Abstract

Top-down prefrontal cortex inputs to the hippocampus have been hypothesized to be important in memory consolidation, retrieval, and the pathophysiology of major psychiatric diseases; however, no such direct projections have been identified and functionally described. Here we report the discovery of a monosynaptic prefrontal cortex (predominantly anterior cingulate) to hippocampus (CA3 to CA1 region) projection in mice, and find that optogenetic manipulation of this projection (here termed AC-CA) is capable of eliciting contextual memory retrieval. To explore the network mechanisms of this process, we developed and applied tools to observe cellular-resolution neural activity in the hippocampus while stimulating AC-CA projections during memory retrieval in mice behaving in virtual-reality environments. Using this approach, we found that learning drives the emergence of a sparse class of neurons in CA2/CA3 that are highly correlated with the local network and that lead synchronous population activity events; these neurons are then preferentially recruited by the AC-CA projection during memory retrieval. These findings reveal a sparsely implemented memory retrieval mechanism in the hippocampus that operates via direct top-down prefrontal input, with implications for the patterning and storage of salient memory representations.


Conflict of interest statement

The authors declare no competing financial interests.

Figures

Extended Data Figure 1
Extended Data Figure 1. Anatomical characterization of the AC–CA projection
a, Five days after RV-tdT injection into the hippocampus (coordinates specified), retrogradely labelled neurons were detected in the contralateral hippocampus (arrow), medial septum (bracket), and AC (Fig. 1a). Scale bars: ×5: 300 μm; ×10: 100 μm (confocal). b, Eight weeks after injection of CAV-Cre into the hippocampus and DIO-eYFP in the AC (coordinates specified), afferent cell bodies were detected in the AC (arrow). Confocal image; ×10 magnification; scale bar: 100 μm. c, Retrograde tracing with RV-tdT from the AC to map reciprocal connections from the hippocampus. The injection site is indicated in brackets, sparse labelling of afferent cell bodies in left and right hippocampus, primarily in the subiculum (arrows), and also in the medial dorsal thalamic nucleus as expected (asterisk). Confocal ×5, scale bar, 200 μm; ×10 images, scale bar 100 μm.
Extended Data Figure 2
Extended Data Figure 2. Optogenetic manipulation of the AC–CA projection
a, Experimental design: RV-ChR2-eYFP (or eYFP alone) was injected into the dorsal hippocampus and light was delivered above the cell bodies in the AC. Five days after injection, ChR2 and eYFP mice were fear conditioned in context A while no-shock controls were only exposed to context A (day 1). All mice were tested with light on and off sessions in context B (day 2), and then tested for contextual memory retrieval in context A (day 3). Optogenetic stimulation was with 473 nm light in a train of 20 Hz, 15 ms pulses, 30 s duration, with 8–10 mW laser power at fibre tip. b, Freezing (no head motion observed) during day 2 is plotted in 5 s time bins over 150 s in context B (left). ChR2/shock (FC): black; ChR2/no shock (NS): red; eYFP/shock (eYFP): blue. Individuals in the FC group (each animal a different colour) are shown (middle). Summary (right): percentage time freezing (mean ± s.d.) 20 s before light on (darker shade) versus 20 s after light on (lighter shade); FC: 60.9 ± 7.4% light on versus 6.5 ± 4.4% light off, n = 8; NS: 2.7 ± 0.65% light on versus 3.4 ± 0.95% light off, n = 6; eYFP: 2.9 ± 0.75% light on versus 3.6 ± 1% light off, n = 6; P < 0.001, two-way ANOVA with repeated measures. c, Preservation of contextual fear memory (percentage time freezing) on day 3 in the original context (mean ± s.d., P < 0.001, unpaired t-test). d, Preservation of contextual memory in medial septum injected mice (Fig. 1f); percentage time freezing on day 3 in the original context (mean ± s.d., P < 0.001, comparisons shown, unpaired t-test). e, Preservation of contextual memory in hippocampus injected mice (Fig. 1h); percentage time freezing on day 3 in the original context (mean ± s.d., n = 8 mice, P < 0.001, paired t-test). f, The successful loss-of-function experiments targeting hippocampus-dependent memory formation mediated by cells giving rise to the AC–CA projection (reported in Fig. 2) were designed to allow the most robust inhibition of this circuit element. An alternative design (attempting to target the projection field despite the broad and long septotemporal extent of the hippocampal formation) was also explored as shown here but was not effective, as expected; we injected AAV5-eNpHR3.0-eYFP (or AAV5-eYFP in a parallel cohort) bilaterally into the AC, and targeted light stimulation bilaterally to axon terminals in the hippocampus. Eight weeks after injection, all mice were fear conditioned to context (day 1), and tested for context retrieval during light on/off sessions (day 2), and again for context retrieval in light-off only (day 3). Optogenetic inhibition was with constant illumination of 589 nm light, 30 s duration, with 8–10 mW laser power at fibre tip. g, We observed a trend towards reduction in freezing due to optical inhibition of the AC–CA projection during memory retrieval. Percentage time freezing in context A during day 2 before light (darker bar on left) versus after light (lighter bar at right). eNpHR3.0: 73.5 ± 8.5% light off versus 55.5 ± 11.4% light on, n = 10; eYFP: 74 ± 7.4% light off versus 74 ± 11.3% light on, n = 10; percentage time freezing in context A with light off (dark bars) during day 3 is shown after dotted line. eNpHR3.0: 67.5 ± 7.2%, n = 10; eYFP: 66.5 ± 9.1%, n = 10 (P = 0.067, two-way ANOVA). As expected, point illumination may be less effective for inhibiting broad axon terminal field volumes. h, Extension of findings from effective loss-of-function experiments (Fig. 2) targeting hippocampus-dependent memory formation mediated by cells giving rise to the AC–CA projection: significant effect on speed of onset of memory expression. Experimental design: CAV-Cre was injected into the dorsal hippocampus, DIO-eNpHR3.0 (or DIO-eYFP) was injected into the AC, and light was delivered above cell bodies in the AC. All mice were fear conditioned in context A (day 1), tested for latency to contextual retrieval with light-on only (day 2), and then for latency to context retrieval in light-off only (day 3). i, Day 2: 66.1 ± 18.1 s for eNpHR3.0 (n = 12) versus 43.8 ± 11.1 s for eYFP (n = 8) during light on; day 3: 53.8 ± 13.7 s for eNpHR3.0 versus 48.8 ± 7.7 s for eYFP during light off; P < 0.05 two-way ANOVA with repeated measures. *P < 0.05, **P < 0.01, ***P < 0.001.
Extended Data Figure 3
Extended Data Figure 3. Physiological properties of GCaMP6m-expressing CA3 neurons
a, To ensure that expression of GCaMP6m did not alter Ca2+-related physiological processes, we tracked a form of endocannabinoid-mediated short-term plasticity known as depolarization-induced suppression of inhibition (DSI). Schematic diagram of DSI is shown; DSI is dependent on the increase of postsynaptic intracellular Ca2+ to trigger the synthesis and release of endocannabinoids, which then signal in a retrograde fashion to suppress GABA release from presynaptic inhibitory neurons expressing cannabinoid receptors (adapted with permission from ref. 65). Intrinsic membrane properties of the GCaMP6m-expressing CA3 cells were similar to previously reported values for CA3 (ref. 66); mean resting potential: –72.1 ± 1.6 mV; mean input resistance: 161.8 ± 26.4 MΩ; n = 7. b, Sample trace illustrating DSI of sIPSCs in a GCaMP6m-expressing CA3 cell following application of a depolarizing current step (from –65 mV to 0 mV for 500 ms). c, Sample trace illustrating lack of DSI of sIPSCs with inclusion of the intracellular calcium chelator BAPTA (1,2-bis(o-aminophenoxy)ethane-N,N,N′,N′-tetraacetic acid) in the patch pipette. d, Summary graph of normalized charge transfer in GCaMP6m-expressing cells with standard intracellular solution (left, normalized charge transfer of sIPSCs following DSI compared with pre-pulse baseline over the same fixed interval: charge reduced to 46.9 ± 6.7% of baseline charge; n = 7; comparable to charge transfer reported for non-GCaMP-expressing cells) and with addition of intracellular BAPTA (right, n = 6; error bars represent standard error of the mean (s.e.m.); P < 0.05, paired t-test). e, Spontaneous event rate (detection described in Methods) of GCaMP6m-expressing neurons as a function of baseline GCaMP6m fluorescence intensity (arbitrary units spanning the range over which event-rate population data could be reliably quantified) in each cell (pooling all neurons with ≥1 significant transient, from all mice, over all fields of view). Event rates were not observed to change significantly as a function of GCaMP6m expression level (Spearman’s rank correlation coefficient: 0.48, P = 0.3). f, Behavioural scores from mice before GCaMP6m virus injection and implantation of cannulae above hippocampus; lick rates for the first 2 min in the fear (black) versus neutral (grey) contexts are provided. The level of learning assessed by lick suppression on day 3 retrieval (mean 0.5 ± 0.3 for day 3 fear versus 2.7 ± 0.3 for day 3 neutral; n = 10, P < 0.001, paired t-test) pre-injection/implantation was comparable to levels corresponding to post-injection/implantation (compare with Fig. 3b). *P < 0.05, **P < 0.01, ***P < 0.001.
Extended Data Figure 4
Extended Data Figure 4. Real-time imaging of neural ensembles in three-dimensional hippocampal volumes: extraction of neural sources and identification of significant transients
a, Head-fixed virtual reality setup. Mice run on an axially fixed track ball while movements and licking behaviour are measured through an optical mouse and a lickometer, respectively, both interfaced with the virtual-reality gaming software. For contextual fear conditioning, water-restricted mice were exposed to two contexts with distinct visual, olfactory, tactile and auditory cues (day 1), and provided with aversive air puffs in one context (fear context), but not the other (neutral context) (day 2). Fear memory retrieval in the two contexts was quantified (days 3, 30) by lick suppression. b, Sample mean intensity z projections from raw videos (scale bar: 50 μm), with extracted neural sources (segmented cells) from CA3 for each of the optical sections, along with the first 50 time-series traces. Scale: 300% ΔF/F, 30 s. c, Identification of significant transients in ΔF/F traces. Histogram showing the distribution of events occurring at amplitude 2σ above noise (noise calculated on a per-cell basis), over a range of event duration in seconds. The number of negative-going transients at each amplitude and duration are plotted in red to the left of the ordinate, and positive-going transients at each amplitude and duration are plotted in blue to the right. d, e, The above analysis is repeated for events that occur at an amplitude of 3σ (d) and 4σ (e). f, False positive rates for 2-, 3-, and 4-σ events (pooled across all neurons in all mice over all FOVs). False positive rate curves were calculated for each σ level by dividing the number of negative events at that level by the number of positive events at that level (Methods). Event onset was defined as the time corresponding to ΔF/F exceeding 2σ, and offset as the time corresponding to ΔF/F falling below 0.5σ. A decaying exponential was fit by least-squares to the false positive rate values, allowing for the determination of a minimum transient duration at each σ level for different confidence levels.
Extended Data Figure 5
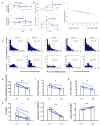
Extended Data Figure 5. Cell populations and graph properties of fear and neutral networks in hippocampus during retrieval
a, No context-dependent change in total event amplitude or rate was detected. Top, mean GCaMP6m-detected event amplitude (average ΔF/F of all significant events; definition of significant event for each neuron as described in Methods) is plotted across days for mice in the fear and neutral contexts (n = 5 mice, not significant in paired t-tests). Bottom, mean GCaMP6m-detected event rate plotted across days for mice in the fear and neutral contexts (n = 5 mice, not significant in paired t-tests). b, Context-dependent changes in individual-neuron and correlated behaviour were observed. Top, number of active neurons (at least one significant GCaMP6m transient detected within first 2 min in context) plotted for fear and neutral contexts (n = 5 mice, 378 ± 64 for day 3 fear context versus 257 ± 39 for day 3 neutral context; P < 0.05, paired t-test, mean ± s.d.). Bottom, mean number of correlated pairs per neuron (where pairwise Pearson’s correlation coefficient >0.3) plotted for fear and neutral contexts (n = 5 mice, 18.5 ± 1.8 for day 2 fear context versus 13.4 ± 1.4 for day 2 neutral context; 11.3 ± 0.8 for day 3 fear context versus 13.6 ± 0.5 for day 3 neutral context; P < 0.05, paired t-test). c, Fitting histograms from Fig. 3d to an exponential distribution of the form aebx demonstrates a power-law (b>1) distribution in day 3 fear context (each red dot represents one mouse) compared to day 3 neutral context (b < 1; green dots), which was consistent across all mice (n = 5 mice; P < 0.01, paired t-test). Many graph properties were calculated for fear versus neutral context, but the power-law exponent of the degree distribution distinguished fear (red) from neutral (green) most powerfully (discriminants shown: coefficient of the power law exponent = 0.78, coefficient of cluster coefficient = 0.61, coefficient of mean path length = 0.11, with 90% confidence intervals being [0.74, 1.0], [0.1, 0.65] and [0.01, 0.23], respectively). These confidence intervals were obtained using 1,000 bootstrapped samples; shown is the best three-dimensional hyperplane separation using a linear support vector machine classifier. d, Histograms of the number of correlated partner neurons existing for each neuron in fear versus neutral context on day 3 (retrieval testing) across mice. The dotted red line indicates correlation threshold (set automatically as mean + 1 standard deviation in the number of correlated pairs in the network), to the right of which lie (by definition) the highly correlated or HC neurons. Similar measurements of interest in fear versus neutral context across mice were calculated and are provided here for other graph invariant properties: e, betweenness centrality; f, g, clique properties; h, strength; i, cluster coefficient; and j, mean path length (all defined in Methods). For the above calculations, correlation between two neurons was defined to exist when the pairwise Pearson correlation coefficient exceeded 0.3 (Methods). Data are presented as individual data points corresponding to each mouse, with mean ± s.d. *P < 0.05, **P < 0.01, ***P < 0.001, using paired t-tests.
Extended Data Figure 6
Extended Data Figure 6. Functional relationships of fear-context-defined HC neurons as appearing in fear versus neutral context
a–c, Data from all additional mice (beyond the exemplar of Fig. 3e, f) demonstrating that HC neurons (red circles) in the fear context with a high degree of correlated partners (grey edges) when located in the neutral context have a much lower degree of correlated partners (n = 4 mice including the example in Fig. 3e, f); mean = 60 correlated pairs (standard deviation 19.4) in fear context versus mean = 18 correlated pairs (standard deviation 14.2) in neutral context; P < 0.01 by paired t-test). Only four mice are analysed here because the exact same FOV (with cell identities) was not captured in fear versus neutral context for one mouse.
Extended Data Figure 7
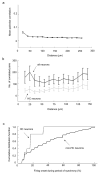
Extended Data Figure 7. Spatial and temporal organization of HC neurons
a, Plot of mean pairwise correlation versus mean pairwise distance averaged over all FOVs (all days and all contexts) from all five mice. It was possible to detect a significant but weak relationship between mean correlation and distance (Spearman’s correlation = −0.66, P = 0.01), which could be a reflection of fine-scale spatial clustering as might be expected of recurrent circuits in CA3, but would also probably include residual crosstalk between regions of interest (ROIs) due to brain motion and common neuropil signal, which is expected and not significantly different from what has been previously observed in the hippocampus. b, Plot of the number of correlated pairs versus pairwise distance for all neurons (black line), and HC neurons only (grey line). More correlated pairs were found at greater distances for HC neurons (Spearman’s = 0.84, P = 0.002 for HC neurons; Spearman’s correlation = 0.23, P = 0.43 for all neurons). c, Cumulative distributions showing fraction of HC neurons (y-axis) with onset times at various latencies across the time course of synchronous events (x-axis) averaged across all mice, compared to response latencies of non-HC neurons. HC neuron activity appeared significantly earlier than for non-HC neurons during synchronous events (P < 0.001, Kolmogorov–Smirnov two-tail test, κ = 0.664; note the horizontal resolution of the plot is inversely proportional to length of the synchrony window, and dependent on frame duration; for instance, a 10-s-long synchrony window with frame duration of 333 ms corresponds to a 3.33% resolution per frame).
Extended Data Figure 8
Extended Data Figure 8. Additional analyses: estimation of event onsets using fast non-negative deconvolution, and correlated pair analysis
a, Example pairings of the original GCaMP6m trace (top traces), with the deconvolved trace (bottom traces), shows reliable estimation of event onset from deconvolved data (deconvolution algorithm and parameters detailed further in Methods). Scale bar: 150% ΔF/F, 10 s. b, Original GCaMP6m traces from a representative synchronous event in one animal (left), paired with the deconvolved traces for that same synchronous event (right). Scale bar: 300% ΔF/F, 10 s. c, The highest-degree node (neuron with the greatest number of correlated pairs) in the day 3 fear context had significantly more correlated pairs than the highest degree node in the day 3 neutral context, significant across n = 5 mice (58.8 versus 33.2 pairs, P < 0.01, paired t-test). d, Temporal relationship of HC neuron activity onset (set to time 0) compared with onset activity of correlated pairs (binned into 333 ms preceding or succeeding HC activity); n = 48 HC neurons. HCs were more likely to lead than lag their correlated pairs (58.5 ± 20% leading versus 24.4 ± 10% lagging; P < 0.01, unpaired t-test). e, Significant synchronous activity (defined in Methods) quantified across five mice: number of synchronous events in the fear context was significantly greater than in the neutral context (5.8 ± 2.9 events in fear context versus 1.2 ± 1.1 in neutral context; P < 0.01, paired t-test). *P < 0.05, **P < 0.01, ***P < 0.001.
Extended Data Figure 9
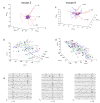
Extended Data Figure 9. PCA of population trajectories in fear versus neutral contexts
a, PCA of ΔF/F traces of all active cells for mouse 2, performed separately for fear and neutral contexts. Population trajectories in the fear context take large, nearly orthogonal, deviations from the centre, while neutral context trajectories remain close to the origin. b, Three-dimensional reconstruction of the neuronal population showing that neurons participating in each synchronous event (red cells (t = 39), green circles (t = 92), blue circles (t = 200)) are largely non-overlapping and anatomically homogenously distributed throughout the volume. There are, however, a small fraction of neurons that participate in all three events (black circles). c, d, Data are shown for another representative mouse. Similar results were seen in all other mice. e, The ΔF/F traces for a randomly selected set of 30 neurons participating in each of three events are shown, with the greatest amount of overlap seen between t = 65 and t = 210. Scale bars: 400% ΔF/F, 20 s.
Extended Data Figure 10
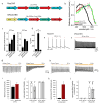
Extended Data Figure 10. bReaChES: engineering a red-shifted opsin for robust projection targeting
a, Schematics of ReaChR and bReaChES. ReaChR is a hybrid of segments from channelrhopsin-1 (blue, amino acids 1–95), Volvox channelrhodopsin-1 (red, amino acids 96–246, 279–350) and Volvox channelrhodopsin-2 (green, amino acids 247–278). The VChR1 segment contains the point mutation Leu171Ile. ReaChR was modified here for enhanced expression and membrane trafficking as well as accelerated channel kinetics, resulting in bReaChES, as follows. The first 51 amino-terminal residues were replaced by the first 11 amino-terminal residues from channelrhodopsin-2 (yellow, amino acids 1–11) and the last 5 carboxy-terminal residues were removed. Mutation of Glu 123 to Ser increases speed of channel closure. b, Spectra of C1V1TT, bReaChES and ChR2 measured between 400 and 650 nm at 0.65 mW mm−2 in cultured neurons from rat hippocampus (n = 6 each). c, Stationary photocurrents at 575 nm (C1V1TT 630 ± 109 pA (s.e.m. throughout figure), ReaChR 963 ± 113 pA, breaches 1,365 ± 128 pA) and 632 nm (C1V1TT 315 ± 111 pA, ReaChR 1,003 ± 95 pA, bReaChES 841 ± 102 pA). Current amplitudes were measured at –80 mV and 5 mW mm−2 light intensity, respectively. d, Speed of channel closure: τ value of mono-exponential off-kinetics (C1V1TT 79 ± 3.7 ms, n = 26; ReaChR 682 ± 86 ms, n = 6; bReaChES 49 ± 4.4 ms, n = 25; P < 0.0005). e, f, Representative current-clamp traces of ReaChR- or bReaChES-expressing cultured neurons excited with 633 nm light (5 ms, 5 mW mm−2). ReaChR kinetics were slow enough that reliable action potential generation was only possible at very low frequencies (e), while the accelerated channel closure of bReaChES allowed reliable spike generation up to 20 Hz (f). g, h, Representative voltage-clamp (g) and current-clamp (h) traces of postsynaptic cells responding to light stimulation (orange) of bReaChES-expressing presynaptic terminals. Pulse length: 5 ms. i, j, Stationary photocurrents (i) and light-evoked spike probability (j) in opsin-expressing medial PFC (mPFC) cells in acute slice (C1V1TT: n = 11, bReaChES: n = 10). k, l, Light-evoked EPSC amplitude (k) and spike probability (l) in postsynaptic cells (C1V1TT: n = 10, bReaChES: n = 18). Light wavelength 575 nm (25 nm bandwidth) and power density 5 mW mm−2. *P < 0.05, **P < 0.01, ***P < 0.001.
Figure 1
Figure 1. Characterization of AC–CA monosynaptic projection
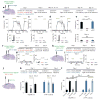
a, Five days after RV-tdT injection into the hippocampus (coordinates specified), retrogradely labelled neurons were detected in the AC (arrowhead). The injection did not leak below the hippocampus into the medial dorsal thalamus (asterisk), a known projection target of the PFC. Scale bars: ×5: 300 μm; ×10: 100 μm (confocal). A, anterior; D, dorsal; DAPI, 4′,6-diamidino-2-phenylindole; M, medial; L, lateral; V, ventral. b, Five weeks after AAV5-CaMKIIα∷eYFP injection into the AC (coordinates specified), projection fibres were visualized in the bilateral striatum (arrows), the bilateral hippocampus at the stratum oriens and stratum radiatum of CA1 (one asterisk) and CA3 (two asterisks), and the ipsilateral medial dorsal thalamus (arrowhead), while sparing CA2 and the dentate (brackets). The injection did not leak into the medial septum, a known input to the hippocampus (caret). Scale bars: ×5: 300 μm (100 μm maximum projections). L., left; R., right. c, AAVdj-CaMKIIα∷ChR2(H134R)-eYFP was injected into the dorsal AC; post-synaptic responses were recorded from CA1 pyramidals in acute slice. Scale bars: ×20: 60 μm. d, CA1 response amplitudes (n = 26 neurons, n = 6 mice); inset: raw traces. e, CA1 response latency (mean 3.2 ms). f, CA3 response amplitudes (n = 13 neurons, n = 2 mice); inset: raw traces. g, CA3 response latency (mean 2.7 ms). h, i, CA1 (h) and CA3 (i) current-clamp traces illustrating spiking reliability at 10 Hz. Scale: 10 mV, 250/500 ms. j, No responses were detected in dentate neurons (n = 5).
Figure 2
Figure 2. AC–CA projections control top-down memory retrieval
a, AAVdj-CaMKIIα∷ChR2-eYFP (or eYFP alone) was injected into the AC, and light was targeted to the dorsal hippocampus 5 weeks after injection. Timelines are indicated. FC, fear context; NS, no shock. bd, Percentage time freezing on days 2, 15 and 17: 5 s time bins (n = 8; P < 0.001, two-way ANOVA with repeated measures) are shown. Throughout this figure, error bars represent standard deviation (s.d.), to facilitate comparison with previously published literature; however, since freezing behaviour is not unbounded, these error bars may overestimate the upper limit of error. Summary bar graphs below are mean ± s.d. 20 s before light (dark bar) versus 20 s after light (lighter bar). e, Preservation of contextual memory (day 3) and contextual extinction (day 14), original context A (mean ± s.d., n = 8, P < 0.001, paired t-test). f, AAVdj-CaMKIIα∷ChR2-eYFP (or eYFP alone) was injected into the medial septum, and light stimulation was targeted to the dorsal hippocampus 5 weeks after injection. g, Percentage time freezing during day 2: 10 s time bins. Right, summary bar graph (not significant, unpaired t-test). h, AAVdj-CaMKIIα∷ChR2-eYFP (or eYFP alone) injection and light targeting to the dorsal hippocampus 5 weeks after injection. i, Percentage time freezing during day 2, 5 s time bins. Right, summary bar graph (n = 8; not significant, paired t-test). j, CAV-Cre was injected into the dorsal hippocampus, and a Cre-sensitive double-floxed inverted orientation (DIO)-eNpHR3.0 (or DIO-eYFP) was injected into the AC, and light was delivered above the cell bodies in the AC 8 weeks after injection. k, Percentage time freezing in context A, day 2 before light (dark bar) versus after light (lighter bar). This effect is reversible on day 3 (to the right of the dotted line). eNpHR3.0: n = 12; eYFP: n = 8; P < 0.001, two-way ANOVA with repeated measures. l, Cued conditioning on day 1 followed by retrieval to the tone on day 2 during light on/off sessions. NS, not significant. All data are presented as mean ± s.d. *P < 0.05, **P < 0.01, ***P < 0.001.
Figure 3
Figure 3. Memory formation generates highly correlated HC neurons that represent context
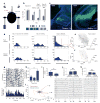
a, Head-fixed virtual reality setup. Fear was quantified by lick suppression (Methods). P1, projector 1; P2, projector 2. b, Lick rates in fear (black) versus neutral (grey) contexts (mean ± s.d.; n = 12; P < 0.001, paired t-test). Sample day 3 raw lick profiles in the fear (top) versus neutral (bottom) context. Scale: 1 V, 20 s. c, Histology performed 4 weeks after injection/surgical implantation showing implant above GCaMP6m-expressing neurons. Left: × 10; scale bar, 200 μm. Right: ×20; scale bar, 50 μm. d, Histograms showing number of correlated partners for each neuron in the fear versus neutral contexts for a representative mouse (see Extended Data Fig. 5). e, f, HC neurons in the fear context (red) (e) have few correlated partners in the neutral context (f). n = 4 mice (60 ± 18.2 (s.d.) in the fear context versus 18 ± 15.8 in the neutral context; P < 0.01, paired t-test; see Extended Data Fig. 6). g, Raster plot (top) and collapsed activity histogram (bottom) during memory retrieval in one mouse; representative HC neuron time series is overlaid (red). h, HC neuron activity onset (time 0) compared with onset activity of their correlated pairs (n = 67 HC neurons, 60.3 ± 6% leading versus 23.2 ± 10% lagging; P < 0.01, unpaired t-test). ik Synchronous activity (Methods) was quantified (n = 5, 8.1 ± 4 events in the fear versus 4.2 ± 1.6 in the neutral context; P < 0.01, paired t-test) (i), and was not accompanied by significant changes in velocity (j) or lick rate (k) (n = 5 mice; not significant (NS), paired t-test). FC, fear context; NC, neutral context. l, Principal component analysis (PCA) from a representative mouse (Extended Data Fig. 9 for additional data sets). Population trajectory in the fear (red) versus the neutral context (blue) was projected onto the respective first three principal components. Right: ΔF/F traces of HC neurons and their correlated neurons participating in each deflection. F, fluorescence; Scale: 400% ΔF/F, 20 s. All error bars represent s.d. *P <0.05, **P < 0.01, ***P < 0.001.
Figure 4
Figure 4. The AC–CA projection preferentially recruits HC neurons during memory retrieval
a, Left, AAV8-CaMKII∷bReaChES-eYFP or AAV8-CaMKII∷C1V1T/T-eYFP (C1V1T/T denotes the red-light-activated channel-rhodopsin engineered and characterized in refs 33 and 47) was injected into the AC, and fibre terminals were visualized in CA3 (red). Scale bars, 60 μm (×20). Right, AAV8-CaMKII∷tdT in the AC, and AAVdj-CaMKII∷GCAMP6m in CA2/CA3. Histology 8 weeks after cannula implantation showing preservation of AC–CA projections (red) near GCaMP6m-expressing neurons (green). Scale bar, 50 μm (×20). b, Two-photon imaging and full-field optogenetic stimulation setup (Methods). Green indicates GCaMP6m signals; red, stimulation artefact. D1, 680 nm short-pass dichroic; D2, 594 band/NIR long-pass dichroic; D3, 555 nm long-pass dichroic; FC, fibre couple; F1, 520 ± 22 nm filter; F2, 624 ± 20 nm filter; L, 25 mm planoconvex lens; MMF, multimode fibre; NIR BF, near infrared blocking filter; PMT1 and PMT2, GaAsP PMTs; TL, tube lens. c, Z-projection images (mean over time) at two depths (40 μm apart) from a representative mouse before and after training. Scale bars, 60 μm. d, Proportion of cells responding (CDF, cumulative distribution function) to AC–CA stimulation as a function of latency (n = 4 mice; 12 trials, P = 0.002, Kolmogorov–Smirnov two-tail test, k = 0.2673). Sample traces in inset (red box: stimulation duration). Consecutive trials are overlaid. e, Optical stimulation in the neutral context induces significant lick suppression after training (n = 4 mice, 12 total trials, mean ± s.d., P < 0.01, paired t-test). No lick suppression was seen before training (not significant, paired t-test). FC, fear context; NC, neutral context. f, Fraction of fear- and neutral-context HC and non-HC neurons recruited during before- (n = 3 mice, 10 total trial) and after-training optical stimulation (n = 4 mice, 12 total trials, P < 0.001, one-way ANOVA); mean, quartile, minimum and maximum are shown. **P < 0.01, ***P < 0.001.

Comment in

References

    1. Kandel ER, Dudai Y, Mayford MR. The molecular and systems biology of memory. Cell. 2014;157:163–186. - PubMed
    1. Han JH, et al. Neuronal competition and selection during memory formation. Science. 2007;316:457–460. - PubMed
    1. Han JH, et al. Selective erasure of a fear memory. Science. 2009;323:1492–1496. - PubMed
    1. Yiu AP, et al. Neurons are recruited to a memory trace based on relative neuronal excitability immediately before training. Neuron. 2014;83:722–735. - PubMed
    1. Reijmers LG, Perkins BL, Matsuo N, Mayford M. Localization of a stable neural correlate of associative memory. Science. 2007;317:1230–1233. - PubMed

Publication types