. 2015 Nov;18(11):1584-93.
doi: 10.1038/nn.4132. Epub 2015 Oct 5.

Depletion of microglia and inhibition of exosome synthesis halt tau propagation

Affiliations

Depletion of microglia and inhibition of exosome synthesis halt tau propagation

Hirohide Asai et al. Nat Neurosci. 2015 Nov.

Abstract

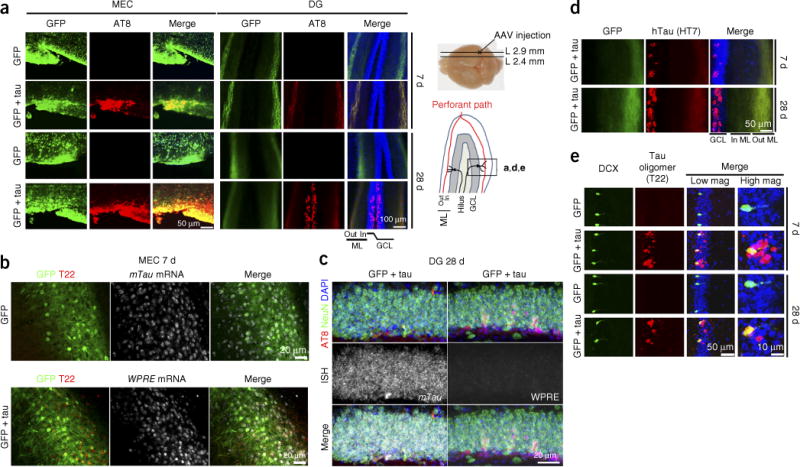
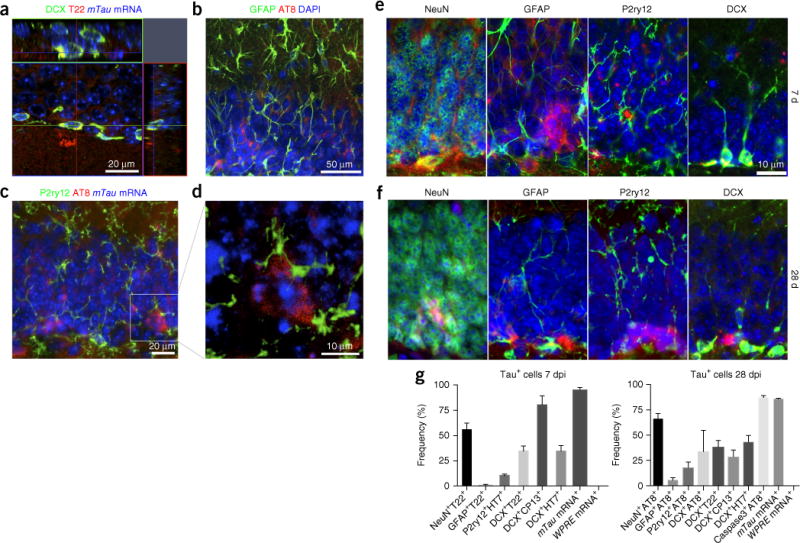
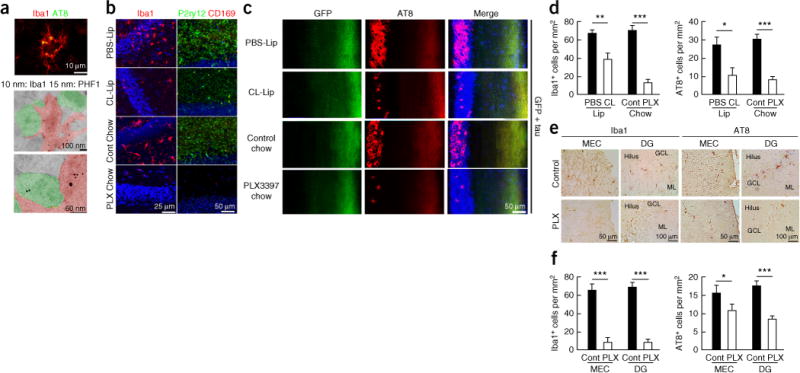
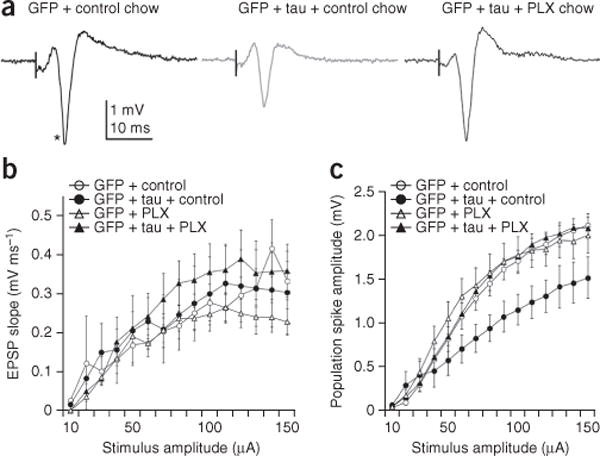
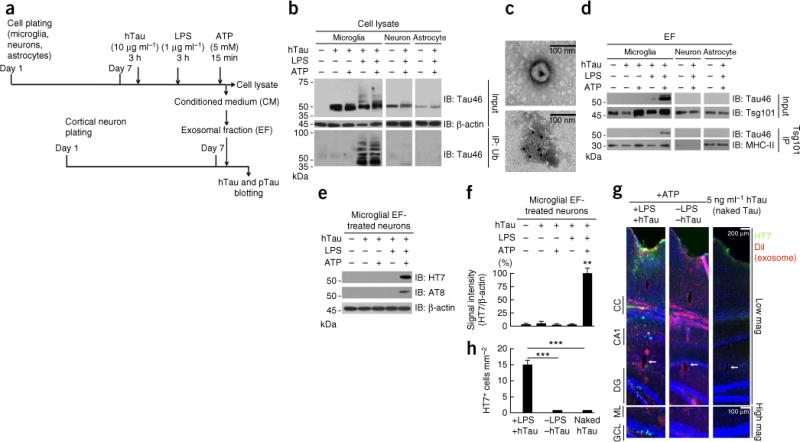
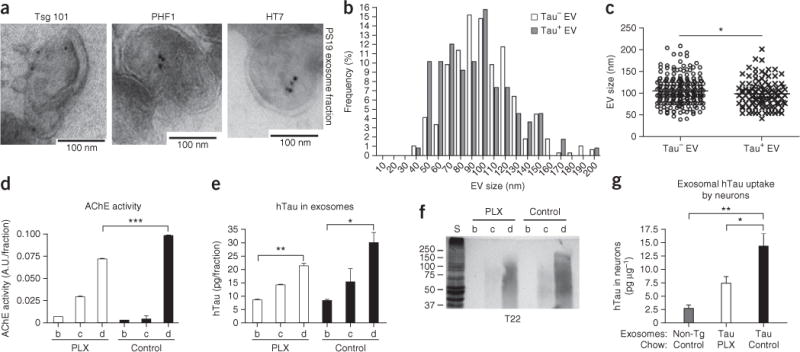
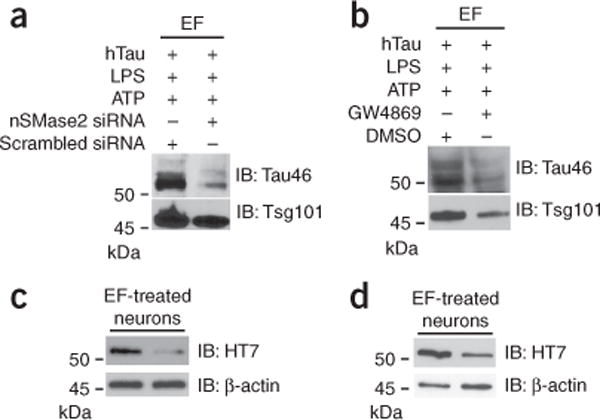
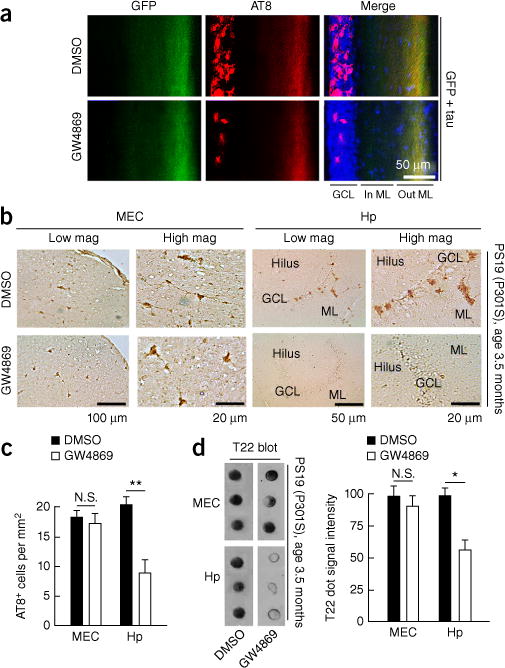
Accumulation of pathological tau protein is a major hallmark of Alzheimer's disease. Tau protein spreads from the entorhinal cortex to the hippocampal region early in the disease. Microglia, the primary phagocytes in the brain, are positively correlated with tau pathology, but their involvement in tau propagation is unknown. We developed an adeno-associated virus-based model exhibiting rapid tau propagation from the entorhinal cortex to the dentate gyrus in 4 weeks. We found that depleting microglia dramatically suppressed the propagation of tau and reduced excitability in the dentate gyrus in this mouse model. Moreover, we demonstrate that microglia spread tau via exosome secretion, and inhibiting exosome synthesis significantly reduced tau propagation in vitro and in vivo. These data suggest that microglia and exosomes contribute to the progression of tauopathy and that the exosome secretion pathway may be a therapeutic target.


Conflict of interest statement

COMPETING FINANCIAL INTERESTS

The authors declare no competing financial interests.

Figures

Figure 1
Figure 1
Tau propagates to the DG after the injection of AAV-GFP/tau in the MEC of the mouse brain. (a) C57BL/6 mice at 4 months of age were injected in the MEC with AAV-GFP or AAV-GFP/tau, then sacrificed at 7 or 28 dpi and subjected to immunofluorescence for AT8 (pTau at pSer202 and Ser205, red), GFP (green) and DAPI (blue) in the MEC (left panels) and the dentate gyrus (DG) regions (right panels). The scheme of the right side depicts the anatomical orientations of the images; L, lateral; Out ML, outer molecular layer; In ML, inner molecular layer; GCL, granule cell layer. (b) Combined immunofluorescence at 7 dpi of GFP (green) and T22 (tau oligomer, red) and in situ hybridization of the 3′ UTR of mTau mRNA (top, white) or the AAV-derived 3′-UTR WPRE (bottom, white) in the MEC of AAV-GFP (top) or AAV-GFP/tau-injected mice (bottom). (c) Combined immunofluorescence for GFP (green), AT8 (red) and DAPI (blue) and in situ hybridization (ISH) of mTau (left, white) or WPRE mRNA (right, white) in the DG GCL of AAV-GFP/tau-injected mice at 28 dpi. (d) HT7 (hTau, red), GFP (green) and DAPI (blue) in the DG of AAV-GFP/tau injected mice at 7 and 28 dpi. (e) DCX (doublecortin: immature neuronal marker, green), T22 (red) and DAPI (blue) in the GCL of AAV-GFP or AAV-GFP/tau-injected mice at 7 and 28 dpi; scale bars: 50 μm for low magnifications and 10 μm for high magnifications. All immunofluorescence images are representative of 3 independent experiments.
Figure 2
Figure 2
Immunofluorescence for tau with cellular markers. (a) Stacked sequential confocal microscopy imaging at 7 dpi of the GCL in the C57BL/6 mouse brain injected with AAV-GFP/tau into the MEC. DCX, green; T22, red; DAPI, blue. Scale bar, 20 μm. (b,c) Immunofluorescence at 28 dpi of the GCL in the C57BL/6 mice brain injected with AAV- GFP/tau in the MEC: GFAP (astrocytes, green), AT8 (red) and DAPI (blue) or P2ry12 (microglia, green), AT8 (red) and mTau mRNA (in situ hybridization, blue). (d) Stacked sequential confocal microscopy imaging of sections in c. AT8+ and mTau mRNA+ tau-bearing neurons are surrounded by P2ry12+ microglia (green). Scale bar, 10 μm. (e,f) Immunofluorescence of the GCL of a AAV-GFP/tau-injected mouse brain for cellular markers (green) and tau markers (red) at 7 (e) or 28 dpi (f). Scale bar, 10 μm. (e) From left to right, NeuN (mature neurons) and T22, GFAP and T22, P2ry12 and HT7 (hTau), and DCX and T22. (f) NeuN and AT8, GFAP and AT8, P2ry12 and AT8, and DCX and AT8. (g) Quantification of tau+ cells in AAV-GFP/tau-injected mice at 7 (left) or 28 dpi (right). The values represent double-positive cells with the cellular marker and the tau marker as a percentage of total tau marker–positive cells in the DG (mean ± s.e.m.). For mTau and WPRE mRNA, in situ hybridization was performed before the immunostaining for tau markers (T22 for 7 dpi and AT8 for 28 dpi).
Figure 3
Figure 3
Microglial depletion suppresses tau propagation in the DG of AAV-GFP/tau-injected mice and PS19 tau mice. (a) Colocalization of tau with microglia in the hippocampal region of PS19 (P301S tau transgenic) mouse brain by laser-scanning confocal microscopy (top) and immunogold electron microscopy with two different gold particle sizes (middle and bottom). (b) Microglia depletion of AAV-GFP/tau mice by ICV injection of clodronate liposome (CL-Lip) or feeding with PLX3397 chow (290 p.p.m.), followed by immunofluorescence for Iba1 (mononuclear phagocyte marker; left, red), or P2ry12 (right, green) and CD169 (infiltrating monocyte marker, red) in the DG. (c) Immunofluorescence for AT8 (red), GFP (green) and DAPI (blue) in the DG at 28 dpi. (d) Quantification of the number of Iba1+ and AT8+ cells in the GCL of AAV-GFP/tau mice in c. Iba1+ cells in the PBS group (n = 3 mice, 18 sections) and CL group (n = 3 mice, 18 sections): P = 0.0013, t(34) = 3.506; Iba1+ cells in control (n = 4 mice, 16 sections) and PLX33973397 chow groups (n = 4 mice, 11 sections), P < 0.0001, t(25) = 7.185; AT8+ cells in PBS (n = 3 mice, 16 sections) and CL groups (n = 3 mice, 14 sections): P = 0.017, t(28) = 3.470; AT8+ cells in control (n = 4 mice, 18 sections) and PLX3397 chow groups (n = 4 mice, 16 sections): P < 0.0001, t(32) = 4.605. All unpaired t-tests. (e) Microglial depletion in the PS19 mice at 4.5 months of age after feeding PLX3397 chow for 4 weeks, followed by immunohistochemistry for Iba1 (red) and AT8 (red) and quantification of the number of Iba1+ and AT8+ cells in the MEC and DG. (f) Quantification of the number of Iba1+ and AT8+ cells in the GCL of PS19 mice in e. Iba1+ cells in the MEC in control (n = 4 mice, 23 sections) and PLX3397 chow groups (n = 3 mice, 12 sections): P < 0.0001, t(33) = 7.647; Iba1+ cells in the DG in control (n = 4 mice, 20 sections) and PLX3397 chow groups (n = 3 mice, 11 sections), P < 0.0001, t(32) = 10.35; AT8+ cells in control (n = 4 mice, 19 sections) and PLX3397 chow groups (n = 4 mice, 14 sections): P = 0.033, t(28) = 2.243, AT8+ cells in control (n = 4 mice, 18 sections) and PLX3397 chow groups (n = 4 mice, 14 sections): P < 0.0001, t(30) = 4.791. All unpaired t-tests. Error bars represent s.e.m. *P < 0.05, **P < 0.01 and ***P < 0.001 as determined by unpaired Student’s t-test.
Figure 4
Figure 4
Reduced population spike responses in AAV-GFP/tau mice are rescued by depletion of microglia. (a) Field potential responses in the dentate granule cell layer to a 100-μA stimulus in the middle molecular layer in hippocampal slices prepared from the following: left, AAV-GFP (control); middle, AAV-GFP/tau; right PLX3397-treated (microglia depleted) AAV-GFP/tau mice. Vertical black line represents time of stimulus and asterisk denotes the population spike. (b) Mean input-output relationships for the excitatory postsynaptic potential (EPSP) slope for all fields in slices prepared from AAV-GFP mice fed control chow (open circles; n = 3 mice, 16 slices), AAV-GFP/tau mice fed control chow (filled circles, n = 3 mice, 10 slices), AAV-GFP mice fed PLX3397 chow (open triangles; n = 3 mice, 16 slices) and AAV-GFP/tau mice fed PLX3397 chow (filled triangles, n = 3 mice, 19 slices). (c) Mean input-output relationships for the population spike for all fields in the same groups as b. Error bars in b and c represent s.e.m. P = 0.0003, F(14,364) = 2.932 for AAV-GFP + control versus AAV-GFP/tau + control; P = 0.0605, F(14,350) = 1.668 for AAV-GFP/tau + control versus AAV-GFP + PLX3397; P = 0.0057, F(14,392) = 2.263 for AAV-GFP/tau + control versus AAV-GFP/tau + PLX3397, as determined by two-way repeated-measurement ANOVA.
Figure 5
Figure 5
Microglia phagocytose and secrete human tau in exosomes, which facilitates tau propagation to neurons in vitro and in vivo. (a) Experimental timeline for in vitro tau transmission from primary cultured murine microglia, neurons or astrocytes to neurons. (b) Cell lysates (Input) were immunoblotted (IB) for total tau (Tau46) and β-actin (upper panels), or subjected to immunoprecipitation (IP) with anti-ubiquitin (Ub) antibody and immunoblotting with Tau46 (lower panels). (c) Electron micrograph of purified exosomes from microglia (top) and immunoelectron micrograph of exosomes with Tsg101 immunogold labeling (10-nm gold particles, bottom). (d) The exosomal fraction (EF) separately collected from conditioned media was immunoblotted for Tau46 or Tsg101 (upper panels). The EF was also subjected to immunoaffinity purification with Tsg101 antibody and immunoblotted for Tau46 or MHC-II (another exosomal marker, lower panels). (e) The EF was applied to primary cultured murine cortical neurons for 4 h, and after washing, the neuron cell lysates were tested for the uptake of hTau with HT7 or AT8. Results are representative of 3 independent experiments. (f) Quantification of band intensity in c. **P < 0.0001, F(4,10) = 253.3, n = 3 per group as determined by one-way ANOVA and Tukey post hoc test. Error bars in b and c represent s.e.m. (g) The DiI-labeled EF containing tau (+LPS +tau) or no tau (−LPS −tau), or 5 ng μl−1 of naked human tau aggregates, were injected into the OML of DG in C57BL/6 mice and sacrificed 21 dpi for immunofluorescence for HT7 (green), exosome (DiI, red) and DAPI (blue) labeling along the injection tract (top) and in the DG regions (bottom). CC, corpus callosum; arrows, injection site in the OML. (h) Quantification of HT7+ cells. Error bars represent s.e.m. ***P < 0.0001, F(2,27) = 36.08 as determined by one-way ANOVA and Tukey post hoc test for +LPS +tau (n = 4 mice, 12 sections), −LPS −tau (n = 3 mice, 9 sections) and naked tau (n = 3 mice, 9 sections) groups. Full-length blots are presented in Supplementary Figure 10.
Figure 6
Figure 6
Characterization of tau-containing extracellular vesicles from microglia depleted PS19 mouse brain. (a) Electron micrograph from the exosomal fraction of PS19 tau mouse brains. Immunogold labeling of Tsg101 (exosome), PHF1 (pTau) and HT7 (hTau). (b,c) Histogram of the size of tau+ (n = 107) or tau extracellular vesicles (EVs, n = 261) (b) and their quantification (c). *P = 0.0371, t(366) = 2.092 as determined by unpaired Student’s t-test. (d) AChE activity of sucrose gradient ultracentrifugation fractions. A.U., arbitrary units. ***P < 0.0001, F(5,6) = 539.3 as determined by one-way ANOVA and Tukey post hoc test (n = 3 per group). (e) Quantification of hTau in each fraction by hTau-specific ELISA. P = 0.0078, F(5,6) = 9.632 as determined by one-way ANOVA and Tukey post hoc test (n = 3 per group). (f) Immunoblotting of tau oligomers using T22 antibody. (g) Ten micrograms of fraction d (exosome fraction) from non-transgenic (non-Tg), PS19 tau mice with a 4-week treatment with PLX3397 chow (tau PLX) or PS19 mice with control chow treatment (tau control) were applied to primary cultured murine cortical neurons as described in Figure 5a, and exosome-transferred hTau in the neurons was quantified by hTau ELISA. P = 0.0026, F(2,9) = 12.34 as determined by one-way ANOVA and Tukey post hoc test (n = 3 per group). Error bars represent s.e.m. *P < 0.05 and **P < 0.01. Results are representative of 3 independent experiments.
Figure 7
Figure 7
nSMase2 silencing or inhibition reduces exosomal secretion and exosome-mediated tau transmission from microglia to neurons. (a,b) Primary cultured microglia were either transfected with siRNA against murine nSMase2 gene or scrambled siRNA (a) or treated with 3 μM GW4869 in 0.5% DMSO in DMEM for 24 h (b), followed by treatment with oligomeric hTau, LPS and ATP as described for Figure 5a. The exosomal fraction (EF) from microglia (10 μg per lane) was immunoblotted with Tau46 and Tsg101. (c,d) Microglia-derived exosome-treated neuronal cell lysates were immunoblotted for hTau (HT7) or β-actin. Results are representative of 3 independent experiments. Full-length blots are presented in Supplementary Figure 10.
Figure 8
Figure 8
Inhibition of nSMase2 suppresses tau propagation in the DG of AAV-GFP/tau-injected and PS19 tau mice. (a) C57BL/6 mice at 4 months of age were injected with AAV-GFP/tau into the MEC and injected daily intraperitoneally (i.p.) with GW4869 or control vehicle for 4 weeks after AAV injection. Immunofluorescence image shows GFP (green), AT8 (red) and DAPI (blue) and quantification of AT8+ cells in the GCL of the DG in AAV-GFP/tau injected mice. GCL, granule cell layer; In ML, inner molecular layer; Out ML, outer molecular layer. (b,c) PS19 mice at 3.5 months of age were treated with daily i.p. injection of GW4869 (1.25 mg per kg per day in 200 μl of 5% DMSO) or control vehicle for 4 weeks and sacrificed for immunofluorescence with AT8 and quantification of AT8+ cells in the EC and the GCL of the DG in PS19 mice. N.S., no significance (P = 0.8067), t(19) = 0.2481 between DMSO (n = 3 mice, 11 sections) and GW4869-treated groups (n = 3 mice, 10 sections) in the MEC; **P = 0.0013, t(22) = 3.698 between DMSO (n = 3 mice, 12 sections) and GW4869-treated groups (n = 3 mice, 12 sections), as determined by unpaired Student’s t-test. Hp, hippocampus. Error bars represent s.e.m. (d) T22 dot blot of brain tissue lysate of the EC and DG from PS19 mice. N.S., no significance (P = 0.7512), t(4) = 0.3397; *P = 0.0136, t(4) = 4.228, as determined by unpaired Student’s t-test for each brain region (n = 3 mice per group). Error bars in d represent s.e.m.

Comment in

References

    1. Braak H, Braak E. Neuropathological stageing of Alzheimer-related changes. Acta Neuropathol. 1991;82:239–259. - PubMed
    1. Clavaguera F, et al. Transmission and spreading of tauopathy in transgenic mouse brain. Nat Cell Biol. 2009;11:909–913. - PMC - PubMed
    1. Ahmed Z, et al. A novel in vivo model of tau propagation with rapid and progressive neurofibrillary tangle pathology: the pattern of spread is determined by connectivity, not proximity. Acta Neuropathol. 2014;127:667–683. - PMC - PubMed
    1. Boluda S, et al. Differential induction and spread of tau pathology in young PS19 tau transgenic mice following intracerebral injections of pathological tau from Alzheimer’s disease or corticobasal degeneration brains. Acta Neuropathol. 2015;129:221–237. - PMC - PubMed
    1. Iba M, et al. Synthetic tau fibrils mediate transmission of neurofibrillary tangles in a transgenic mouse model of Alzheimer’s-like tauopathy. J Neurosci. 2013;33:1024–1037. - PMC - PubMed

Publication types