. 2015 Oct 5:6:8523.
doi: 10.1038/ncomms9523.

miR-142-5p and miR-130a-3p are regulated by IL-4 and IL-13 and control profibrogenic macrophage program

Affiliations

miR-142-5p and miR-130a-3p are regulated by IL-4 and IL-13 and control profibrogenic macrophage program

Shicheng Su et al. Nat Commun. .

Abstract

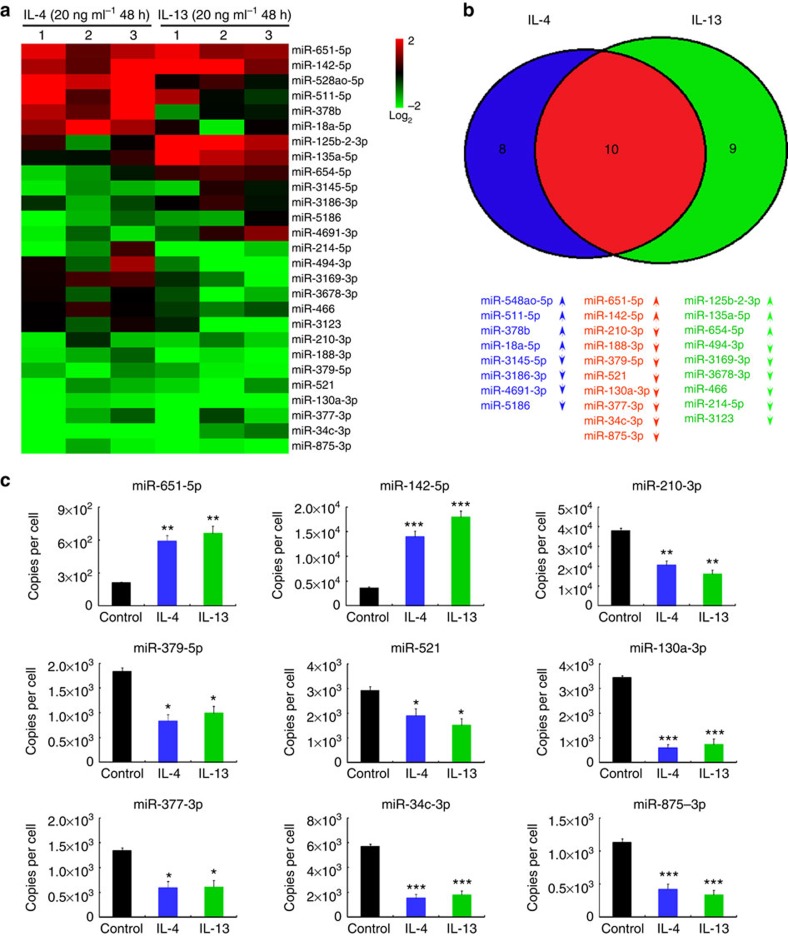
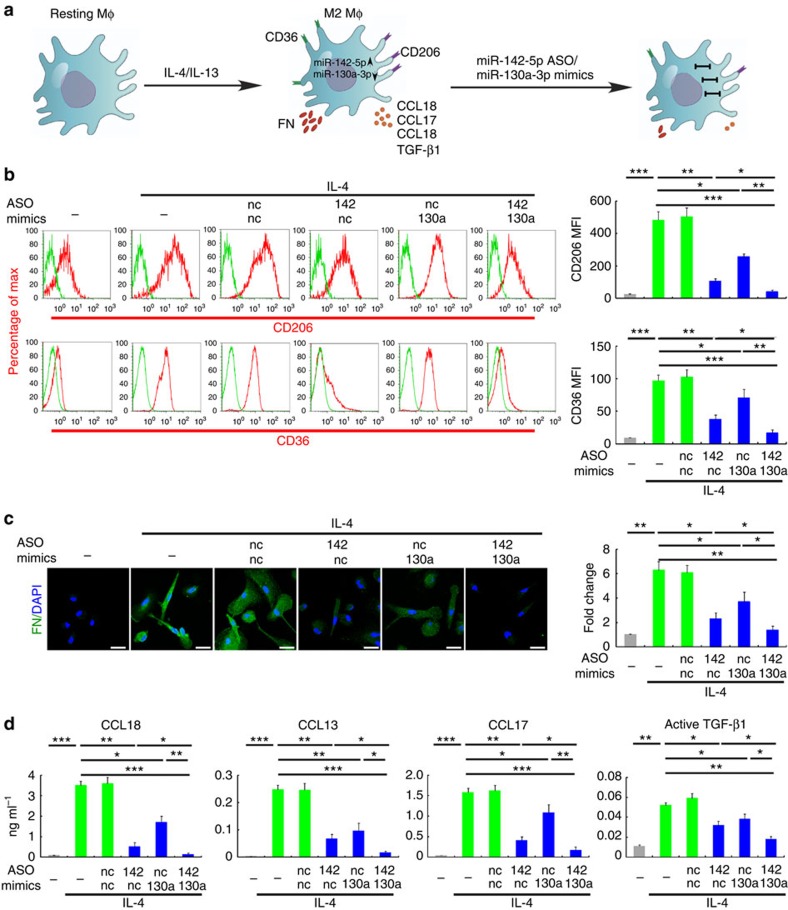
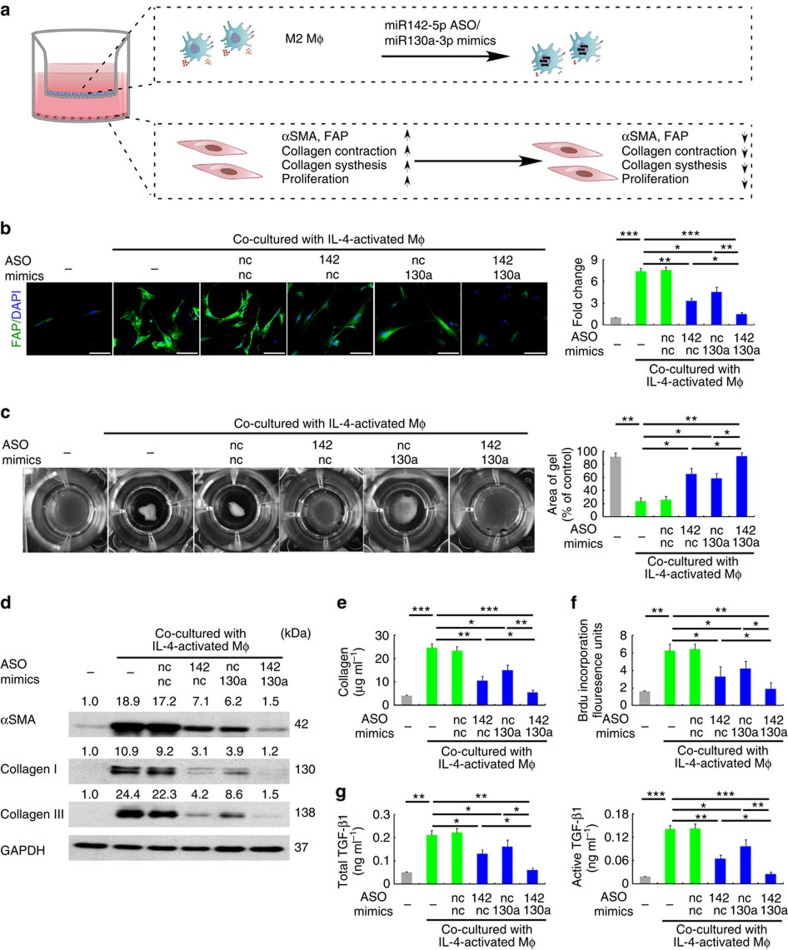
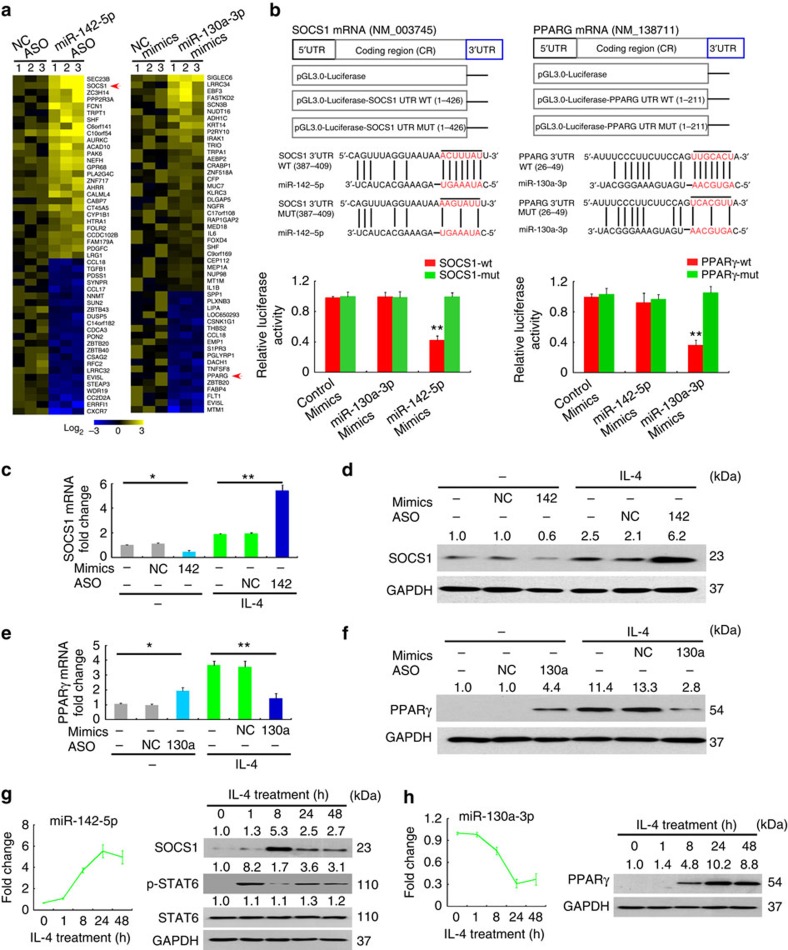
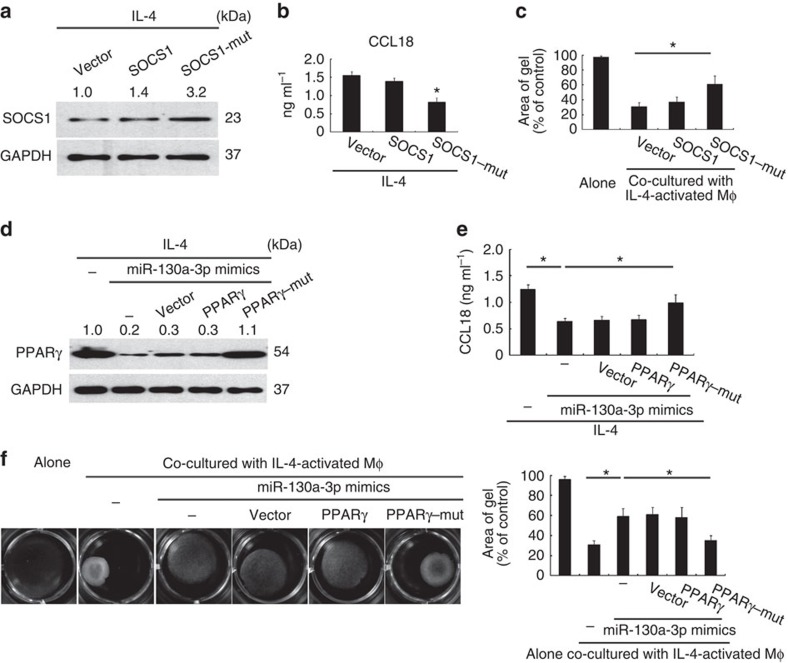
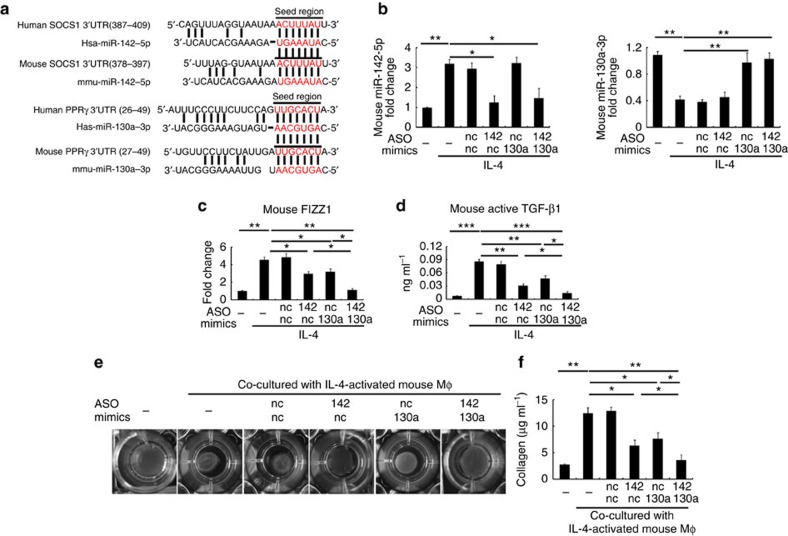
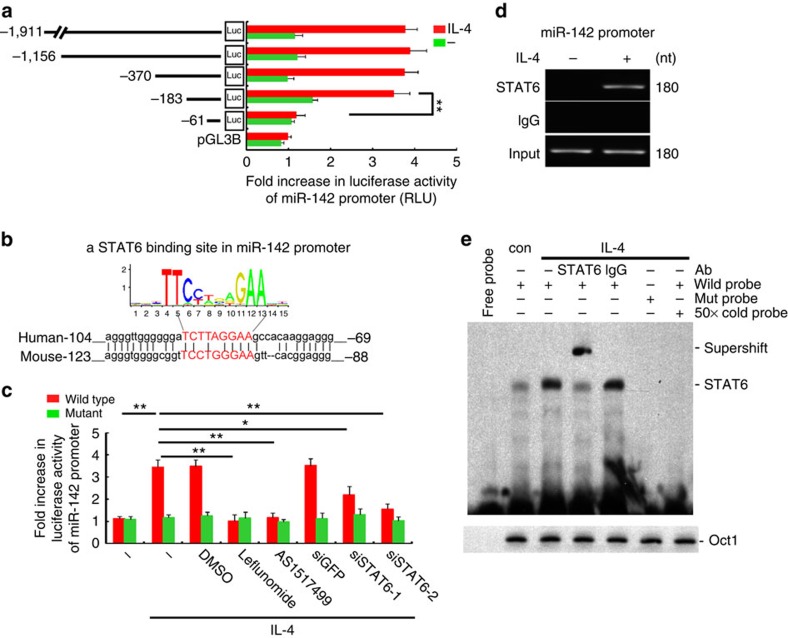
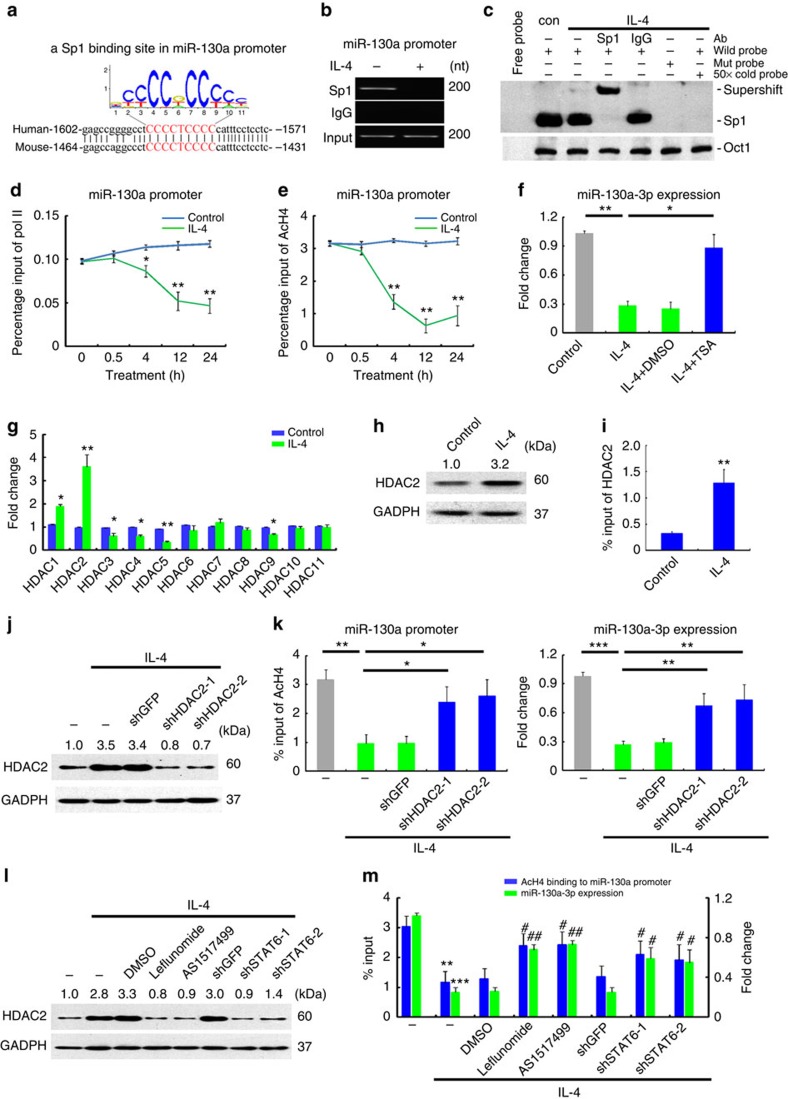
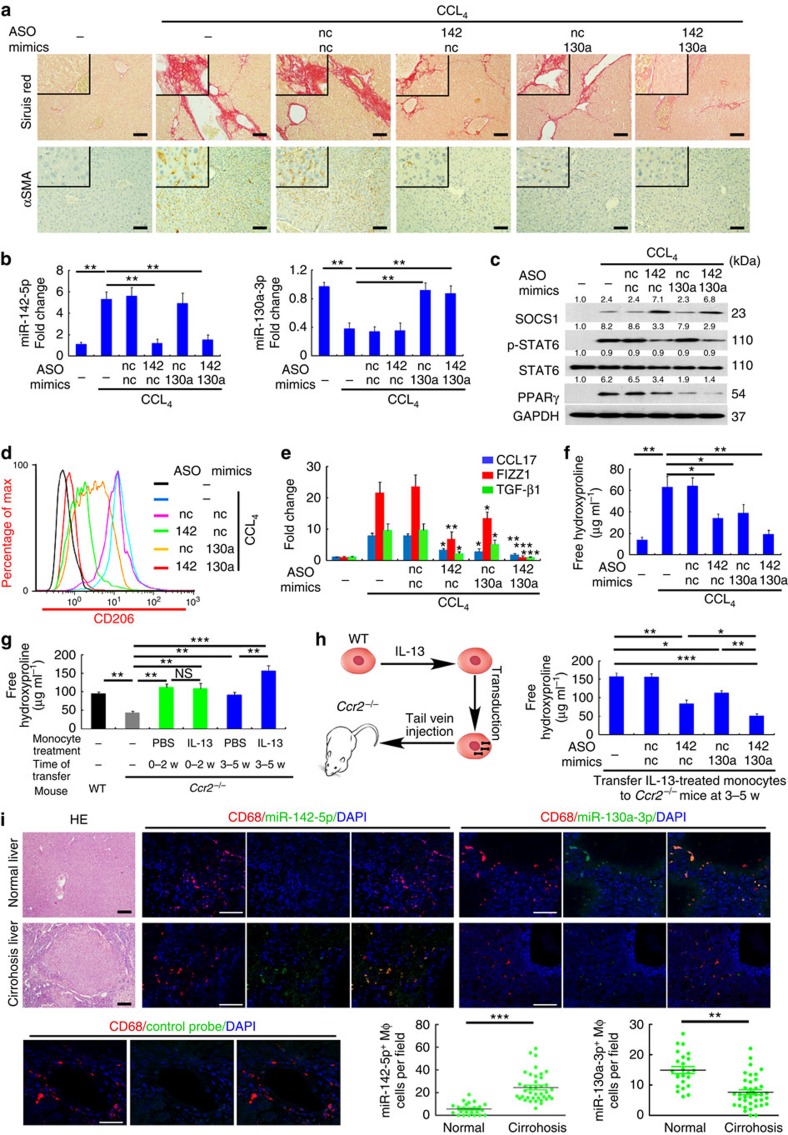
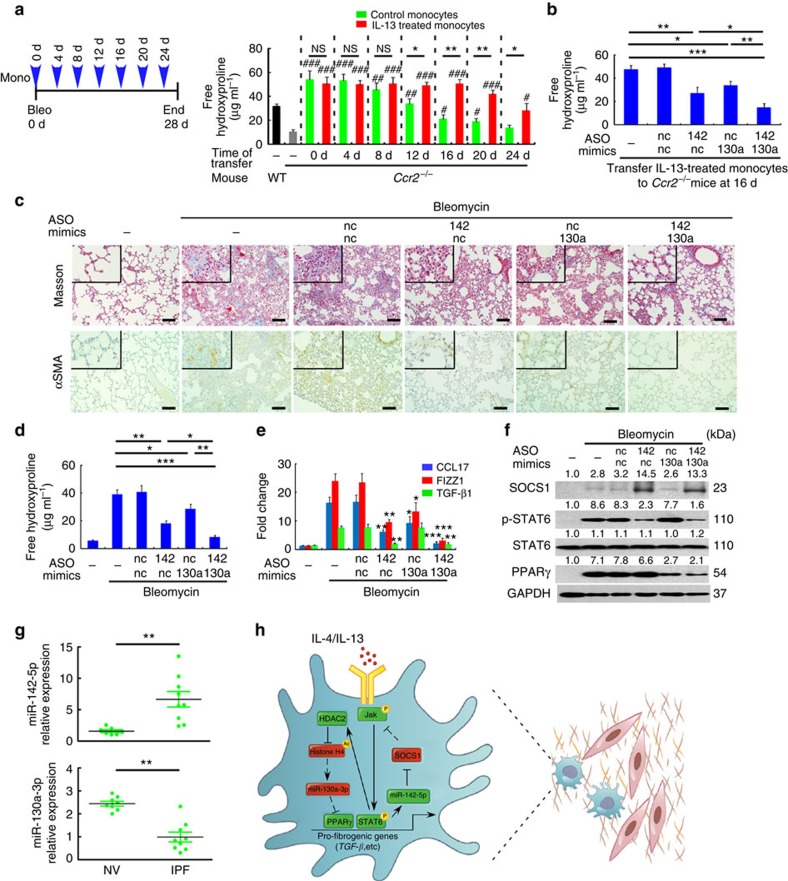
Macrophages play a pivotal role in tissue fibrogenesis, which underlies the pathogenesis of many end-stage chronic inflammatory diseases. MicroRNAs are key regulators of immune cell functions, but their roles in macrophage's fibrogenesis have not been characterized. Here we show that IL-4 and IL-13 induce miR-142-5p and downregulate miR-130a-3p in macrophages; these changes sustain the profibrogenic effect of macrophages. In vitro, miR-142-5p mimic prolongs STAT6 phosphorylation by targeting its negative regulator, SOCS1. Blocking miR-130a relieves its inhibition of PPARγ, which coordinates STAT6 signalling. In vivo, inhibiting miR-142-5p and increasing miR-130a-3p expression with locked nucleic acid-modified oligonucleotides inhibits CCL4-induced liver fibrosis and bleomycin-induced lung fibrosis in mice. Furthermore, macrophages from the tissue samples of patients with liver cirrhosis and idiopathic pulmonary fibrosis display increased miR-142-5p and decreased miR-130a-3p expression. Therefore, miR-142-5p and miR-130a-3p regulate macrophage profibrogenic gene expression in chronic inflammation.


Figures

Figure 1
Figure 1. IL-4/IL-13 alter the miRNA expression profiles in macrophages.
(a) Primary human macrophages derived from peripheral blood monocytes were treated for 48 h with 20 ng ml−1 IL-4 or IL-13, and the miRNA expression profiles were analysed by microarray. The mean fluorescence intensity was calculated as the average for three replicates. The results are presented as the miRNA ratio versus the untreated cells (n=3 per group, fold change >2, P<0.05 by two way ANOVA). (b) Venn diagram of all miRNAs with different expression in the cells treated as in (a). Red indicates the overlap between IL-4-regulating miRNAs and IL-13-regulating mRNAs. (c) Absolute quantification of the expression of the indicated miRNAs at 48 h following IL-4/IL-13 treatment as determined by qRT–PCR (mean±s.e.m., n=4; *P<0.05; **P<0.01; ***P<0.001, compared with untreated macrophages by two-tailed Student's t-test). ANOVA, analysis of variance.
Figure 2
Figure 2. miR-142-5p and miR-130a-3p regulate M2 activation of macrophages.
(ad) Human macrophages were transduced with nc, miR-142-5p ASO or miR-130a-3p mimics or both using lentiviral vectors. After 24 h, the cells were treated with IL-4 for 48 h. (a) The schematics of the approach. (b) Expression of CD206 and CD36 in macrophages as determined by flow-cytometry analysis. The representative histograms and quantitation of the MFI are shown (mean±s.e.m., n=4 independent experiments; *P<0.05; **P<0.01; ***P<0.001. P values were obtained using two-tailed Student's t-test). (c) Representative images of fluorescent fibronectin(FN)/DAPI staining in macrophages. Scale bar, 20 μm. Fluorescence intensity was quantitated by ImageJ software and normalized to control levels (mean±s.e.m., n=3 independent experiments; *P<0.05; **P<0.01. P values were obtained using two-tailed Student's t-test). (d) Cytokine levels in the media of macrophages (mean±s.e.m., n=4 independent experiments; *P<0.05; **P<0.01; ***P<0.001. P values were obtained using a two-tailed Student's t-test). MFI, mean fluorescence intensity; nc, negative control.
Figure 3
Figure 3. miR-142-5p and miR-130a-3p regulate the profibrogenesis of macrophages.
(ag) Human macrophages were transduced with control, miR-142-5p ASO or miR-130a-3p mimics or both. After 24 h, the macrophages were stimulated with IL-4 for 12 h and co-cultured with primary human fibroblasts for another 48 h. (a) The schematics of the approach. (b) Representative images of fluorescent FAP/DAPI staining in fibroblasts. Scale bar, 100μm. Fluorescence intensity was quantitated.(mean±s.e.m., n=3 independent experiments; *P<0.05; **P<0.01. P values were obtained using two-tailed Student's t-test). (c) Fibroblast contractility in three-dimensional collagen matrices (mean±s.e.m., n=4 independent experiments; *P<0.05; **P<0.01. P values were obtained using two-tailed Student's t-test). (d) Representative images of western blot analysis of α-SMA, collagen I and collagen III in fibroblasts (n=3). The numbers above the blots present the intensity ratio of indicated protein/GAPDH analysed by ImageJ. (e) Extracellular acid-soluble collagen production of fibroblasts was measured by the Sircol assay. (mean±s.e.m., n=4 independent experiments; *P<0.05; **P<0.01; ***P<0.001. P values were obtained using two-tailed Student's t-test). (f) The proliferation of fibroblasts was determined by BrdU incorporation assay (mean±s.e.m., n=4 independent experiments; *P<0.05; **P<0.01. P values were obtained using two-tailed Student's t-test). (g) Total TGF-β1 (acid-treated) and active TGF-β1 (not acid-treated) in the media of the macrophage/fibroblast co-culture system (mean±s.e.m., n=4 independent experiments; *P<0.05; **P<0.01; ***P<0.001. P values were obtained using two-tailed Student's t-test).
Figure 4
Figure 4. miR-142-5p and miR-130a-3p target the 3′UTRs of SOCS1 and PPARγ respectively.
(a) Heat map for gene-expression profiling of human M(IL-4) transduced with control ASO versus miR-142-5p ASO or control mimics versus miR-130-3p mimics. The mean fluorescence intensity was calculated as the average for three replicates, and the levels of expression were shown with log2-transformed values. The top 50 genes with the greatest changes compared with controls are shown (n=3). (b) Luciferase reporter assays for THP-1 cells transfected with pRL-TK vectors carrying SOCS1–3′ UTR versus SOCS1-mut-3′UTR or PPARγ-3′ UTR versus PPARγ-mut-3′ UTR in the absence or presence of the indicated miRNA mimics (mean±s.e.m., n=3 independent experiments; **P<0.01 compared to control by two-tailed Student's t-test). (c,d) The human untreated and M(IL-4) were transduced with miR-142-5p mimics and miR-142-5p ASO, respectively. Expression of SOCS1 (c) mRNA and (d) protein was measured. The numbers above the blots present the intensity ratio of SOCS1/GAPDH analysed by ImageJ. (mean±s.e.m., n=3, *P<0.05; **P<0.01 by two-tailed Student's t-test). (e,f) The human macrophages untreated and M(IL-4) were transduced with miR-130-3p ASO and miR-130-3p mimics, respectively. Expression of PPARγ (e) mRNA and (f) protein was measured (mean±s.e.m., n=3, *P<0.05; **P<0.01 by two-tailed Student's t-test). (g) Time course of miR-142-5p expression in human macrophages as determined by qRT–PCR and SOCS1 protein level and STAT6 phosphorylation as determined by western blotting after IL-4 stimulation (mean±s.e.m., n=3). (h) Time course of miR-130a-3p expression in human macrophages as determined by qRT–PCR and PPARγ protein level as determined by western blotting after IL-4 stimulation (mean±s.e.m., n=3).
Figure 5
Figure 5. miR-142-5p and miR-130a-3p regulate profibrogenesis by targeting SOCS1 and PPARγ respectively.
(ac) MM6 cells were transfected with the pcDNA 3.1 plasmid vector or vectors cloned with a wild-type SOCS1 or mutated SOCS1 expression cassette at miR-142-5p (SOCS1-mut) response element. After 24 h, the cells were stimulated with IL-4 for 12 h and co-cultured with primary human fibroblasts for another 48 h. (a) Representative western blot of SOCS1 in MM6 cells (n=3). The numbers above the blot present the intensity ratio of SOCS1/GAPDH analysed by ImageJ. (b) CCL18 level in the media of MM6 cells (mean±s.e.m., n=3; *P<0.05 compared with cells transfected with vector by two-tailed Student's t-test). (c) Human primary fibroblast contractility in three-dimensional collagen matrices (mean±s.e.m., n=3 independent experiments; *P<0.05 by a two-tailed Student's t-test). (dg) MM6 cells were transfected with miR-130a-3p mimics or co-transfected with a wild-type PPARγ or mutated PPARγ expression cassette at miR-130a-3p response element. After 24 h, the macrophages were stimulated with IL-4 for 12 h and co-cultured with primary human fibroblasts for another 48 h. (d) Representative western blotting for PPARγ in MM6 cells (n=3) (e) CCL18 level in the media of MM6 cells (mean±s.e.m., n=3; *P<0.05 by two-tailed Student's t-test). (f) Human primary fibroblast contractility in three-dimensional collagen matrices (mean±s.e.m., n=3 independent experiments; *P<0.05 by two-tailed Student's t-test).
Figure 6
Figure 6. miR-142-5p and miR-130a-3p regulate profibrogenesis of mouse macrophages.
(a) Humans and mice share conserved miR-142-5p-binding sites in the 3′UTR of SOCS1 mRNA and conserved miR-130a-3p-binding sites in the 3′UTR of PPARγ. (b) Primary mouse macrophages were transduced with nc, miR-142-5p ASO or miR-130a-3p mimics or both. After 24 h, the cells were stimulated with IL-4 for 24 h and expression of miR-142-5p and miR-130a-3p was examined by qRT–PCR (mean±s.e.m., n=4 independent experiments; *P<0.05; **P<0.01. P values were obtained using two-tailed Student's t-tests). (c,d) FIZZ1 mRNA expression (c) and active TGF-β1 production (d) in mouse macrophages treated as in (b) were examined by qRT–PCR and ELISA, respectively (mean±s.e.m., n=4 independent experiments; *P<0.05; **P<0.01; ***P<0.001. P values were obtained using two-tailed Student's t-tests). (e,f) Mouse macrophages were transfected with control, miR-142-5p ASO or miR-130a-3p mimics or both. After 24 h, the macrophages were stimulated with IL-4 for 12 h and co-cultured with mouse primary fibroblasts for another 48 h. The contractility in three-dimensional collagen matrices (e) and extracellular acid-soluble collagen production (f) of fibroblasts were examined (mean±s.e.m., n=4 independent experiments; *P<0.05; **P<0.01; ***P<0.001. P values were obtained using two-tailed Student's t-tests). nc, negative control.
Figure 7
Figure 7. IL-4 upregulates miR-142-5p via STAT6.
(a) MM6 cells were transfected with whole length or several deletion miR142-luc constructs, incubated with IL-4 and harvested for the luciferase activity assay(mean±s.e.m., n=3; **P<0.01 by two-tailed Student's t-test). (b) A conserved STAT6-binding element on the miR-142 promoter across species predicted by JASPAR. (c) MM6 cells were transfected with a wild-type or mutant reporter construct of miR-142, exposed to IL-4 with or without pretreatment with DMSO or STAT6 inhibitors or pretransfection with GFP-siRNA or STAT6-siRNAs, and harvested for the luciferase assay (mean±s.e.m, n=3; *P<0.05, **P<0.01 by two-tailed Student's t-test). (d) Lysate of human macrophages with indicated treatments was prepared for the ChIP assay using anti-STAT6 Ab or control IgG (n=3). (e) The nuclear extract of human macrophages with indicated treatments was prepared for EMSA. A mutated probe for STAT6, a competition experiment using 50-fold unlabelled STAT6 oligonucleotide and a supershift experiment with anti-STAT6 Ab were performed. Oct-1 is used as a loading control (n=2). RLU, relative light units.
Figure 8
Figure 8. IL-4 downregulates miR-130a-3p by inducing histone deacetylation.
(a) A conserved Sp1-binding element on the miR-130a promoter across species predicted by JASPAR. (b) Lysates of human macrophages with indicated treatments were prepared for the ChIP assay using anti-Sp1 Ab (n=3). (c) The nuclear extract of human macrophages with indicated treatments was prepared for EMSA(n=3). (d,e) Human macrophages were stimulated with IL-4 for indicated time and kinetics of RNA pol II (d) or AcH4 (e) on the miR-130a promoter were analysed by ChIP. The results are presented as enrichment (percentage of input DNA) of RNA pol II or AcH4 promoter occupancy(n=3). (f) Human macrophages were stimulated with IL-4 with or without pretreatment of DMSO or TSA.miR-130a expression was determined by qRT–PCR 24 h afterwards (n=3). (g) Human macrophages were stimulated with IL-4 for 24 h. The expression of the indicated HDACs was quantitated by qRT–PCR(n=3). (h) Human macrophages were stimulated with IL-4 for 48 h and the protein level of HADC2 was determined by western blot(n=3). (i) Binding of HDAC2 on the miR-130a promoter in human macrophages was analysed by ChIP(n=3). (j) Representative western blotting for HADC2 of IL-4-treated human macrophages transduced with HADC2-shRNAs(n=3). (k) Binding of AcH4 on the miR-130a promoter was analysed by ChIP (left) and the expression of miR-130a-3p (right) was analysed by qRT–PCR in cells treated as in (j) (n=3). (l) Representative western blotting for HADC2 of IL-4-treated human macrophages pretreated with STAT6 inhibitors or transduced with STAT6-shRNAs (n=3). (m) Binding of AcH4 on the miR-130a promoter was analysed by ChIP and expression of miR-130a-3p was analysed by qRT–PCR in cells treated as in (l) (n=3). (mean±s.e.m.; *P<0.05; **P<0.01 compared with control. #P<0.05, #P<0.01 compared with M(IL-4) for all the experiments above. The numbers above the blots present the intensity ratio of the indicated protein/GAPDH analysed by ImageJ).
Figure 9
Figure 9. Dyregulated Mϕ miR-142-5p and miR-130a-3p enhance liver fibrosis.
(af) Mice were intravenously injected with LNA-modified miR-142-5p ASO, miR-130a-3p mimic or both every 3 days after CCL4 challenge. Mice were sacrificed after 6 weeks (mean±s.e.m., n=8 mice/group; *P<0.05, **P<0.01 by two-tailed Student's t-test). (a) Representative images of Sirius Red staining and α-SMA immunochemical staining of mouse liver sections. Inserts show higher magnification. Scale bar, 50 μm. (b) Expression of miR-142-5p and miR-130a-3p in hepatic macrophages was evaluated by qRT–PCR. (c) SOCS1 level, STAT6 phosphorylation and PPARγ level in hepatic macrophages were determined by western blot analysis (n=3). (d) Expression of CD206 in hepatic macrophages was evaluated by flow cytometry analysis. (e) Expression of CCL17, FIZZ1 and TGF-β1 in hepatic macrophages was evaluated by qRT–PCR. (f) Hydroxyproline in the livers of mice was measured by the Sircol assay (g) C57BL/6 wild-type or Ccr2−/− mice were gavaged with CCL4 every 5 days for 6 weeks.1 × 106 bone marrow-derived monocytes were treated with IL-13 for 24 h, and injected intravenously into CCL4-treated Ccr2−/− mice either at weeks 0, 1, and 2 (0–2 weeks) or at weeks 3, 4 and 5 (3–5 weeks) of treatment. Hydroxyproline was measured in the livers 6 weeks after CCL4 challenge (mean±s.e.m., n=8 mice/group P<0.05, **P<0.01, ***P<0.001 by two-tailed Student's t-test). (h) Bone marrow-derived monocytes were transduced with control, miR-142-5p ASO or miR-130a-3p mimics or both. After 24 h, the monocytes were stimulated with IL-13 for 24 h and injected intravenously into CCL4-treated Ccr2−/− mice at weeks 3–5 of treatment. (left) Schematics of experimental designs. (right) Mice were killed 6 weeks after CCL4 challenge and hydroxyproline was measured in the livers. (Mean±s.e.m., n=8 mice/group P<0.05, **P<0.01, ***P<0.001 by two-tailed Student's t-test.) (i) Representative H&E staining, FISH for miR-142-5p, miR-130a-3p or scramble control and co-immunostaining for CD68 in normal and cirrhotic human liver tissues. Scale bars, 50 μm. Quantification of miR-142-5p+ and miR-130a-3p+macrophages (normal liver group, n=24; cirrhotic liver group, n=39, mean±s.e.m., **P<0.01, ***P<0.001 by two-tailed Student's t-test.).
Figure 10
Figure 10. Dyregulated Mϕ miR-142-5p and miR-130a-3p enhance lung fibrosis.
(a) C57BL/6 wild-type or Ccr2−/− mice were intratracheally administered 0.15 U bleomycin.1 × 106 bone marrow-derived monocytes were treated with IL-13 for 24h, and injected intravenously into bleomycin-treated Ccr2−/− mice either at days 0, 4, 8,12,16,20 or 24 after the treatment. (left) Schematics of experimental designs. (right) Hydroxyproline was measured in the lungs 28 days after bleomycin challenge. (mean±s.e.m., n=8 mice/group; #P<0.05, ##P<0.01, ###P<0.001 compared with Ccr2−/− mice without monocyte transfer.*P<0.05, **P<0.01 by two-tailed Student's t-test). (b) Bone marrow-derived monocytes were transduced with control, miR-142-5p ASO or miR-130a-3p mimics or both. After 24 h, the monocytes were stimulated with IL-13 for 24 h and injected intravenously into Ccr2−/− mice 16 days after bleomycin challenge. Mice were killed 28 days after bleomycin challenge, and hydroxyproline was measured in the lungs (mean±s.e.m., n=8 mice/group; *P<0.05, **P<0.01, ***P<0.001 by two-tailed Student's t-test). (cf) C57BL/6 wild type were intravenously injected with LNA-modified miR-142-5p ASO, miR-130a-3p mimic or both 16 days following intratracheal administration of bleomycin and repeated every 3 days. Mice were killed 28 days after the bleomycin challenge (mean±s.e.m., n=8 mice/group; *P<0.05, **P<0.01 by two-tailed Student's t-test). (c) Representative images of Masson trichrome staining and α-SMA immunostaining of mouse lung sections. Inserts show higher magnification. Scale bar, 50 μm. (d) Hydroxyproline in the lungs of mice was measured by the Sircol assay. (e) Expression of CCL17, FIZZ1 and TGF-β1 in pulmonary macrophages was evaluated by qRT–PCR. (f) SOCS1 level, STAT6 phosphorylation and PPARγ level in pulmonary macrophages were determined by western blot analysis (n=3). (g) Expression of miR-142-5p and miR-130a-3p in macrophages from BAL fluids of normal volunteers and IPF patients was evaluated by qRT–PCR (normal volunteers group, n=7; IPF patients group, n=9; mean±s.e.m., **P<0.01 by two-tailed Student's t-test). (h) Schematics highlighting the primary findings of this study. IL-4/IL-13 increases miR-142-5p via STAT6 and reduces miR-130a-3p by histone deacetylation in macrophages. These miRNAs target SOCS1 and PPARγ, respectively, and modulate a profibrogenic macrophage program.

References

    1. Wynn T. A. & Barron L. Macrophages: master regulators of inflammation and fibrosis. Semin. Liver Dis. 30, 245–257 (2010). - PMC - PubMed
    1. Gordon S. & Martinez F. O. Alternative activation of macrophages: mechanism and functions. Immunity 32, 593–604 (2010). - PubMed
    1. Su S. et al.. A positive feedback loop between mesenchymal-like cancer cells and macrophages is essential to breast cancer metastasis. Cancer Cell 25, 605–620 (2014). - PubMed
    1. Hasegawa M., Fujimoto M., Kikuchi K. & Takehara K. Elevated serum levels of interleukin 4 (IL-4), IL-10, and IL-13 in patients with systemic sclerosis. J. Rheumatol. 24, 328–332 (1997). - PubMed
    1. Chiaramonte M. G. et al.. Regulation and function of the interleukin 13 receptor alpha 2 during a T helper cell type 2-dominant immune response. J. Exp. Med. 197, 687–701 (2003). - PMC - PubMed

Publication types

MeSH terms