. 2015 Nov;47(11):1316-1325.
doi: 10.1038/ng.3413. Epub 2015 Oct 5.

DNA methylome analysis in Burkitt and follicular lymphomas identifies differentially methylated regions linked to somatic mutation and transcriptional control

Helene Kretzmer #  1   2   3   4 Stephan H Bernhart #  1   2   3   4 Wei Wang #  5 Andrea Haake #  4   6 Marc A Weniger #  4   7 Anke K Bergmann #  6   8   9 Matthew J Betts  10 Enrique Carrillo-de-Santa-Pau  9   11 Gero Doose  1   2   3   4 Jana Gutwein  6 Julia Richter  4   6 Volker Hovestadt  5 Bingding Huang  12 Daniel Rico  9   11 Frank Jühling  1   2   3 Julia Kolarova  6 Qianhao Lu  10 Christian Otto  1   2   3 Rabea Wagener  4   6 Judith Arnolds  13 Birgit Burkhardt  4   14 Alexander Claviez  4   8 Hans G Drexler  15 Sonja Eberth  4   15   16 Roland Eils  4   12   17 Paul Flicek  9   18 Siegfried Haas  4   19 Michael Humme  4   20 Dennis Karsch  4   21 Hinrik H D Kerstens  9   22 Wolfram Klapper  4   23 Markus Kreuz  4   9   24 Chris Lawerenz  4   12 Dido Lenzek  4   20 Markus Loeffler  4   9   24 Cristina López  4   6 Roderick A F MacLeod  15 Joost H A Martens  9   22 Marta Kulis  9   22 José Ignacio Martín-Subero  9   25 Peter Möller  4   26 Inga Nage  4   6 Simone Picelli  5 Inga Vater  4   6 Marius Rohde  4   27 Philip Rosenstiel  4   28 Maciej Rosolowski  4   24 Robert B Russell  10 Markus Schilhabel  4   28 Matthias Schlesner  4   12 Peter F Stadler  1   2   3   4   29   30   31 Monika Szczepanowski  4 Lorenz Trümper  4   16 Hendrik G Stunnenberg  9   22 Ralf Küppers  4   7   9 Ole Ammerpohl  4   6 Peter Lichter  4   5 Reiner Siebert  4   6   9 Steve Hoffmann  1   2   3   4   9 Bernhard Radlwimmer  4   5
Affiliations

DNA methylome analysis in Burkitt and follicular lymphomas identifies differentially methylated regions linked to somatic mutation and transcriptional control

Helene Kretzmer et al. Nat Genet. 2015 Nov.

Abstract

Although Burkitt lymphomas and follicular lymphomas both have features of germinal center B cells, they are biologically and clinically quite distinct. Here we performed whole-genome bisulfite, genome and transcriptome sequencing in 13 IG-MYC translocation-positive Burkitt lymphoma, nine BCL2 translocation-positive follicular lymphoma and four normal germinal center B cell samples. Comparison of Burkitt and follicular lymphoma samples showed differential methylation of intragenic regions that strongly correlated with expression of associated genes, for example, genes active in germinal center dark-zone and light-zone B cells. Integrative pathway analyses of regions differentially methylated in Burkitt and follicular lymphomas implicated DNA methylation as cooperating with somatic mutation of sphingosine phosphate signaling, as well as the TCF3-ID3 and SWI/SNF complexes, in a large fraction of Burkitt lymphomas. Taken together, our results demonstrate a tight connection between somatic mutation, DNA methylation and transcriptional control in key B cell pathways deregulated differentially in Burkitt lymphoma and other germinal center B cell lymphomas.


Conflict of interest statement

Competing financial interests

The authors declare that they have no competing interests as defined by Nature Publishing Group, or other interests that might be perceived to influence the results and/or discussion reported in this paper.

Figures

Figure 1
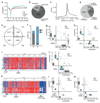
Figure 1. Loss of methylation in lymphoma.
(a) Circular plot for genome-wide group-average DNA methylation signals. A gradual loss of methylation in comparison to normal germinal center B-cells is observed (1: germinal center B-cells, n=4; 2: follicular lymphoma, n=9; 3: Burkitt lymphoma, n=13). (b) Boxplot of average methylation levels for lymphoma and normal controls. Methylation differences are significant (<0.05) for all pairwise comparisons except for follicular lymphoma vs. Burkitt lymphoma (p=0.13). Boxes indicate medians, 25th and 27th percentiles. Whiskers indicate the 1.5-fold inter-quartile ranges. GC-B, germinal center B-cells; BL, Burkitt lymphoma; FL; follicular lymphoma. (c) Correlation of DNA methylation levels in Burkitt lymphoma, follicular lymphoma and germinal center B-cells at CpG resolution (blue=low density, orange=high density). (d) Average methylation difference (average of Burkitt lymphoma and follicular lymphoma vs. germinal center B-cells) in GM12878 chromatin segments. (e) Scatter plots of DNA methylation of poised promoters versus RNA expression of the associated genes.
Figure 2
Figure 2. Differentially methylated regions (DMRs).
(a) Interdependence of DNA methylation and RNA expression levels across gene regions (mean of germinal center B-cells, follicular lymphoma and Burkitt lymphoma is shown). Genes were grouped by expression level (not: RPKM<0.1; low: 0.1<=RPKM<1; medium: 1<=RPKM<10; high: 10<=RPKM) (b) Proportion of DMRs in promoters, transcribed- and intergenic regions. (c) Density plot of DMRs with respect to distance from the TSS (n = 22 samples). (d) Proportion of DMRs in intragenic regions (1,500 nt upstreams of TSS to TES) that showed no, positive or negative correlations of DMR methylation and expression of the associated gene. (e) Types and distribution of correlating DMRs (cDMRs). For about one-third of DMRs (n=8,207; upper panel) degrees of methylation and RNA expression of associated genes correlated (p<0.05; Spearman). Of these cDMR-gene pairs, 67% showed negative correlation (Q2 and Q4). (f) Proportion of germinal center dark zone (DZ) and light zone (LZ) genes with negatively correlating DMR-gene pairs in Burkitt lymphoma and in follicular lymphoma. (g, h) Scatter and box plots of correlating DMRs of the DZ and LZ-associated genes MDM1 and JAK3, respectively. (i) DNA methylation plot for STAT3, showing a cDMR in intron 6; red, methylated; blue, unmethylated (j) Correlations of cDMR methylation and expression for STAT3. (k) DNA methylation plot for TCF3, showing two cDMRs within the gene body. cDMR1 in intron 2 contains a TCF3 binding site. (l, m) Correlations of cDMR methylation and expression for TCF3. GC-B, germinal center B-cells; BL, Burkitt lymphoma; FL; follicular lymphoma.
Figure 3
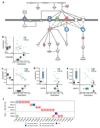
Figure 3. Sphingosine-1-phosphate signaling is affected by complementary DNA mutation and methylation in germinal center B-lymphomas.
(a) Pathway of sphingosine-1-phosphate and related G-protein-coupled signaling. RNA expression of genes differentially expressed between lymphoma (Burkitt lymphoma and follicular lymphoma) and germinal center B-cells are indicated in red and green for up- and downregulation, respectively. Genes marked with blue outlines are associated with cDMRs. (b-e) Scatter and box plots of negatively correlating DMR methylation and RNA expression affecting genes involved in sphingosine-1-phosphate and G-protein signaling. (b) PDGFRB (c) GNA11 (d) S1PR1 (e) GNA12 (f) Mutations identified in Burkitt lymphoma samples affecting the G12/13 (above dashed line) and Gαi (below dashed line) complexes. GC-B, germinal center B-cells; BL, Burkitt lymphoma; FL, follicular lymphoma.
Figure 4
Figure 4. Enrichment of transcription factor binding sites (TFBS) in cDMRs.
(a) Radar plot showing the enrichment of binding sites of 46 transcription factors in cDMRs. Quadrants (Q1-Q4) classify cDMRs by correlation type (positive or negative) and direction of methylation and expression in Burkitt lymphoma vs. follicular lymphoma. Negatively and positively correlating DMR-gene pairs are located in Q2/Q4, and Q1/Q3, respectively. Concentric circles indicate levels of TFBS enrichment measured as percent binding sites of a particular TF found in cDMRs relative to all binding sites of this TF found in DMRs. Stars indicate TFBS that are significantly enriched (permutation test) in cDMRs. Red stars indicate the 10 TFs showing the best correlation of TF and average target gene expression. (b) Correlations of sample-wise average cDMR methylation and average target gene expression for the 9 of the top 10 TFs showing negative correlations. (c) Activity map integrating the correlation of TFBS methylation and differential expression of target genes. Color and hue indicate the strength of inactivation (red) or activation (blue) in Burkitt lymphoma compared to follicular lymphoma samples. The top 40 target genes are shown for quadrants Q2 and Q4, each. (d,e) RNA expression of TCF3 (d) and SMARCA4 (e) in Burkitt lymphoma, follicular lymphoma and germinal center B-cells determined by microarray analysis in an extended lymphoma cohort. (f) Correlations of sample-wise average cDMR methylation and average target gene expression for SMARCA4. GC-B, germinal center B-cells; BL, Burkitt lymphoma; FL; follicular lymphoma.
Figure 5
Figure 5. SMARCA4 genome architecture and protein expression.
(a) Genome browser view of the SMARCA4 locus. Chromatin segmentations of GM12878, BL2, DG-75 and KARPAS-422 cell lines (top), and average CpG methylation (middle) and RNA expression (bottom) of Burkitt lymphoma, follicular lymphoma and germinal center B-cell samples. (b,c) Staining of SMARCA4 (BRG1) by immunohistochemistry in (b) a normal reactive follicle (tonsil), and (c) a Burkitt lymphoma with SMARCA4 R973W mutation (infiltrated lymph node; original magnification 400x; scale bar = 200 µm). (d) Accumulation of missense mutations in the SMARCA4 DEXDc helicase (cyan) and helicase conserved C-terminal (grey) domains in Burkitt lymphoma samples. Heights of lollipops indicate relative numbers of mutations at that position. Red squares indicate severe changes in physico-chemical properties (score<0); yellow: 0<score<4. (e) Distribution of somatic mutations (SNVs or indels) of the SWI/SNF complex in Burkitt lymphomasuggests mutually exclusive mechanisms of inactivation. (f) Unsupervised analysis of SWI/SNF complex RNA-expression data (Affymetrix hgu133a) segregates Burkitt lymphoma and follicular lymphoma. (g) Model of SMARCA4 interaction with a DNA helix. Amino acid residues mutated in Burkitt lymphoma are indicated. but the model suggests them to ablate helicase function rather than DNA binding by interfering with ATP-binding, either directly or by obstructing the interaction of the helicase N and C-terminal domains. Cyan, DEXDc domain; grey, C-terminal helicase domain. ATP is shown with sticks colored by atom types. GC-B, germinal center B-cells; BL, Burkitt lymphoma; FL; follicular lymphoma.

Similar articles

Cited by

References

    1. Lai AY, et al. DNA methylation profiling in human B cells reveals immune regulatory elements and epigenetic plasticity at Alu elements during B-cell activation. Genome Res. 2013;23:2030–41. - PMC - PubMed
    1. Lee ST, et al. A global DNA methylation and gene expression analysis of early human B-cell development reveals a demethylation signature and transcription factor network. Nucleic Acids Res. 2012;40:11339–51. - PMC - PubMed
    1. Shaknovich R, et al. DNA methyltransferase 1 and DNA methylation patterning contribute to germinal center B-cell differentiation. Blood. 2011;118:3559–69. - PMC - PubMed
    1. Basso K, Dalla-Favera R. Germinal centres and B cell lymphomagenesis. Nat Rev Immunol. 2015;15:172–84. - PubMed
    1. Lenz G, Staudt LM. Aggressive lymphomas. N Engl J Med. 2010;362:1417–29. - PMC - PubMed

Publication types

MeSH terms

Substances