. 2015 Oct 13;6(31):30500-15.
doi: 10.18632/oncotarget.5921.

Induction of KIAA1199/CEMIP is associated with colon cancer phenotype and poor patient survival

Affiliations

Induction of KIAA1199/CEMIP is associated with colon cancer phenotype and poor patient survival

Stephen P Fink et al. Oncotarget. .

Abstract

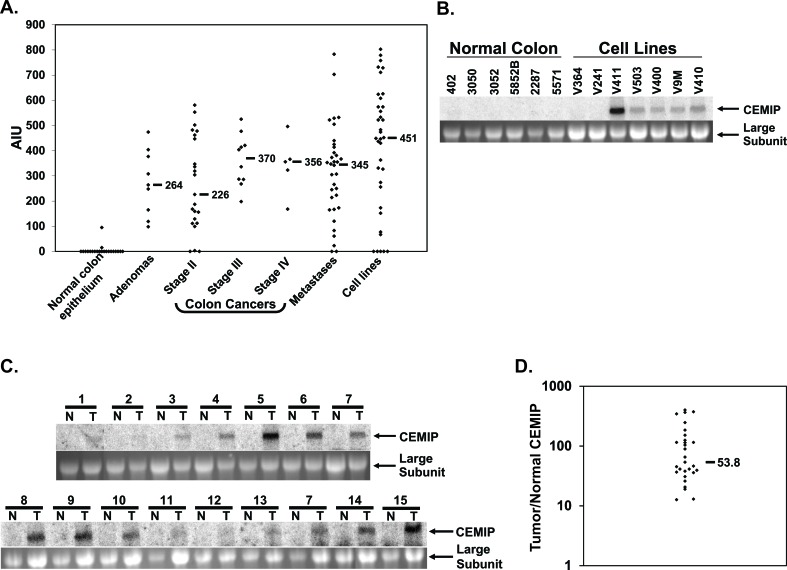
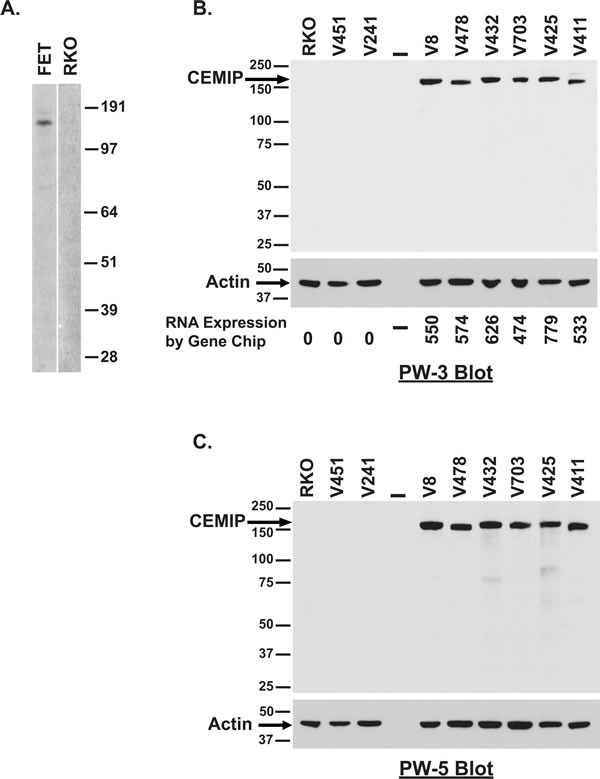
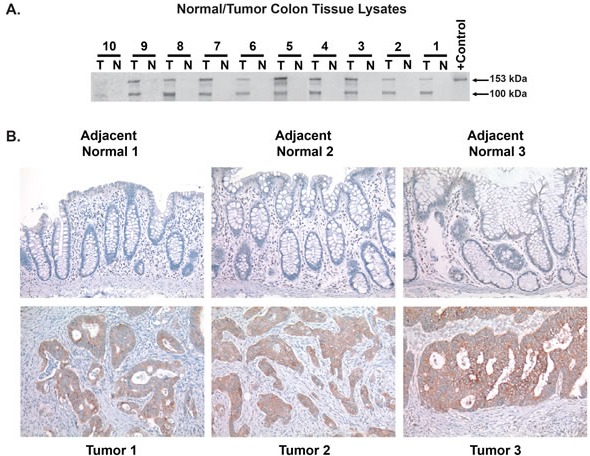
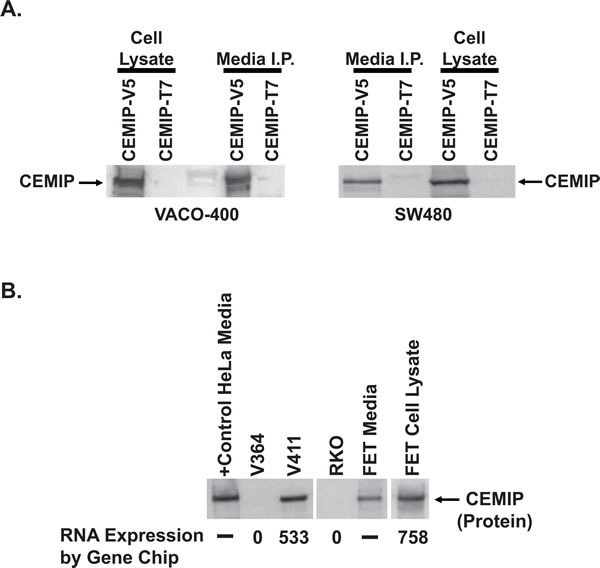
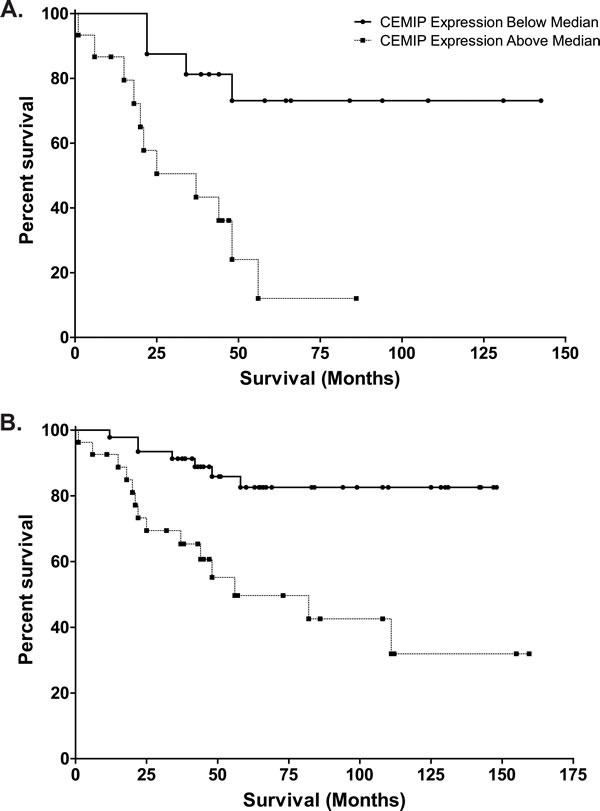
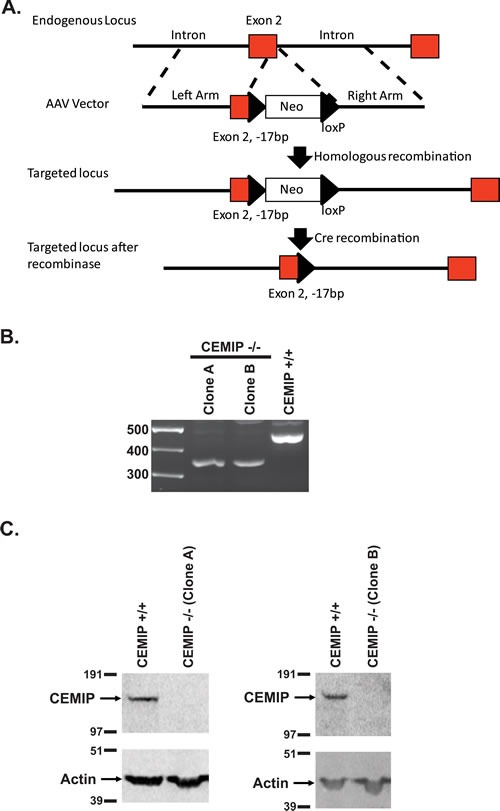
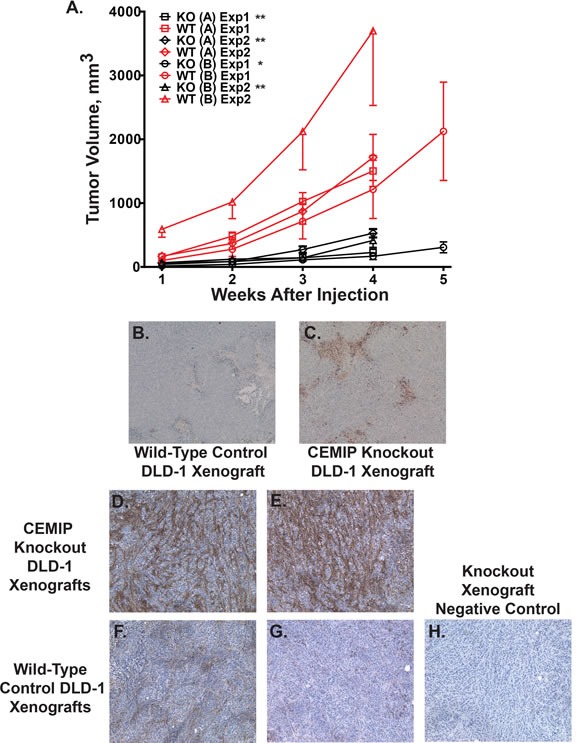
Genes induced in colon cancer provide novel candidate biomarkers of tumor phenotype and aggressiveness. We originally identified KIAA1199 (now officially called CEMIP) as a transcript highly induced in colon cancer: initially designating the transcript as Colon Cancer Secreted Protein 1. We molecularly characterized CEMIP expression both at the mRNA and protein level and found it is a secreted protein induced an average of 54-fold in colon cancer. Knockout of CEMIPreduced the ability of human colon cancer cells to form xenograft tumors in athymic mice. Tumors that did grow had increased deposition of hyaluronan, linking CEMIP participation in hyaluronan degradation to the modulation of tumor phenotype. We find CEMIP mRNA overexpression correlates with poorer patient survival. In stage III only (n = 31) or in combined stage II plus stage III colon cancer cases (n = 73), 5-year overall survival was significantly better (p = 0.004 and p = 0.0003, respectively) among patients with low CEMIP expressing tumors than those with high CEMIP expressing tumors. These results demonstrate that CEMIP directly facilitates colon tumor growth, and high CEMIP expression correlates with poor outcome in stage III and in stages II+III combined cohorts. We present CEMIP as a candidate prognostic marker for colon cancer and a potential therapeutic target.

Keywords: CEMIP; colon cancer; metastasis; prognostic marker; secreted protein.


Conflict of interest statement

CONFLICTS OF INTEREST

Doctors Markowitz, Fink and Myeroff are inventors on a patent application regarding CEMIP. The remaining authors disclose no conflicts.

Figures

Figure 1
Figure 1. CEMIP mRNA expression in normal colon epithelium and colon cancer samples
A. Expression levels of CEMIP measured on GeneChip microarrays for samples of normal colon epithelium, colon adenomas, colon cancer primary tumors of stages II, III and IV, colon cancer hepatic metastases, and colon cancer cell lines. Horizontal bars denote median expression values within each group. Transcript hybridization to expression microarrays is measured in Average Intensity units (AIU). B. Northern blot analysis of CEMIP expression in 6 normal colon epithelium samples versus colon cancer cell lines (upper panel). C. Northern blot analysis of CEMIP expression in 15 samples of colon cancer tissue (T) and paired normal colonic mucosa (N), upper panels. The lower panels are the ethidium bromide stains of the 28S ribosomal RNA subunit for each of the corresponding samples. D. Real-time PCR measurement of CEMIP transcript expression. Shown is the ratio of CEMIP expression in colon cancer versus matched normal colon mucosa for 29 patients. CEMIP values are normalized against expression of the house-keeping gene Beta-2-microglobulin. Horizontal black bar denotes mean value.
Figure 2
Figure 2. Detection of endogenous CEMIP protein in colon cancer cell lines
A. Western blot analysis of lysates from CEMIP transcript expressing FET colon cancer cells versus CEMIP non-expressing RKO colon cancer cells using anti-CEMIP monoclonal antibody PW-3. B.-C. Western blot analysis of lysates for CEMIP transcript expressing lines versus non-expressing lines using anti-CEMIP monoclonal antibody PW-3 B. or anti-CEMIP monoclonal antibody PW-5 C.. Blotting for actin was used to control for sample loading. Corresponding mRNA expression levels are indicated below panel 2B.
Figure 3
Figure 3. Induction of CEMIP protein in patient colon tumor samples
A. Detection of endogenous CEMIP protein by serial immunoprecipitation and Western blot analysis using monoclonal antibody PW-3 on lysates from colon cancer tumor tissues (T) versus matched normal colonic mucosa (N)from 10 different colon cancer patients. Purified T7 epitope tagged CEMIP protein serves as a positive (+) control. B. Immunostaining of CEMIP protein using anti-CEMIP monoclonal antibody, PW-3, in 3 cases of colon cancer tumors versus adjacent normal colonic mucosa.
Figure 4
Figure 4. Secretion of CEMIP protein
A. Western blot assay of CEMIP protein in lysates of CEMIP transfected cells (Cell Lysate) versus in the immunoprecipitates from a corresponding amount of cell culture media (Media I.P.). SW480 and VACO-400 cells were transfected with expression vectors encoding either V5 epitope tagged CEMIP (CEMIP-V5) or T7 epitope tagged CEMIP (CEMIP-T7). Immunoprecipitation and Western blotting were performed using antibodies against the V5 epitope-tag, with CEMIP-T7 samples serving as a negative control. An arrowhead denotes the position of the ∼150kDa CEMIP protein detected in both cell culture medium and lysates of CEMIP transfected cells. B. Detection of endogenous CEMIP protein secreted from colon cancer cells using serial immunoprecipitation and Western blot analysis. Shown are assays of CEMIP protein from 1 ml of cell culture media from colon cancer cell lines FET and V411 that express CEMIP transcript, versus from cell lines V364 and RKO that are negative for CEMIP transcript expression. Corresponding RNA expression levels are indicated below the panel. Also shown is an assay of cell culture media and matched cell pellet lysate from CEMIP expressing FET cells. Samples of FET cells assayed represent 3% of the total FET cell pellet and 2% of the corresponding FET media. Media from CEMIP transfected HeLa cells, which do not endogenously express CEMIP, serves as a positive control.
Figure 5
Figure 5. Kaplan-Meier analyses of survival in CEMIP high (values greater than 1.024, selected as median of stage III colon cancer cases) versus CEMIP low (values less than 1.024) colon cancer cases
A. Survival curve of 31 stage III colon cancer patients with tumor CEMIP expression levels above (dashed line, n = 16) or below (solid line, n = 15) the median value of 1.024, demonstrating decreased survival in those with high tumor CEMIP transcript levels (P = 0.004). B. Survival curve of 73 stage II and stage III colon cancer patients with tumor CEMIP expression levels above (dashed line) or below (solid line) 1.024, demonstrating decreased survival in those with high tumor CEMIP transcript levels (P = 0.0003).
Figure 6
Figure 6. Gene knockout of CEMIP in DLD-1 cells
A. Schematic diagram for targeting exon 2 for deletion in CEMIP. B. RT-PCR confirmation for deletion of exon 2 in CEMIP deleted DLD-1 clones (Clone A and Clone B). The PCR primers span exon 2 and the expected band size for exon 2 deleted cells is 343bp versus 453bp for non-targeted DLD-1 cells (CEMIP +/+). C. Western blot for CEMIP protein in deleted clones A and B showing a lack of a 150 kDa band, whereas a band is detected in non-targeted DLD-1 cells (CEMIP +/+). Blotting for actin was used to control for sample loading.
Figure 7
Figure 7. Reduced tumor growth and increased apoptosis in CEMIP negative tumor xenografts
A. Xenograft growth curves in athymic mice injected with CEMIP knockout DLD-1 cells (black lines) or wild-type DLD-1 cells (red lines). Two separate knockout clone lines were derived and xenograft growth for each line was tested in two separate experiments. The symbols for respective experiments are as follows, (square) CEMIP knockout clone A experiment 1, (diamond) knockout clone A experiment 2, (circle) CEMIP knockout clone B experiment 1, (triangle) knockout clone B experiment 2. Matched wild-type DLD-1 xenograft controls for each experiment have the corresponding symbol, but in red. Error bars are standard errors of the mean. (*) Denotes P < 0.05 for knockout versus matched control for all time points while (**) denotes P < 0.01 for all time points. B.-C. Shown is immunostaining for cleaved caspase-3 in harvested xenografts from mice injected with wild-type, CEMIP expressing DLD-1 cells B., or CEMIP knockout DLD-1 cells C.. D.-H. Shown is histochemical staining for HA in harvested xenografts from mice injected with CEMIP knockout DLD-1 cells D.-E., or CEMIP expressing DLD-1 cells F.-G. H. HA negative control stain of CEMIP knockout DLD-1 cells in which the biotinylated HA binding protein is omitted.

References

    1. Siegel R, Ma J, Zou Z, Jemal A. Cancer Statistics, 2014. CA: a cancer journal for clinicians. 2014 - PubMed
    1. Siegel R, Desantis C, Jemal A. Colorectal cancer statistics, 2014. CA: a cancer journal for clinicians. 2014;64:104–117. - PubMed
    1. Venook AP, Niedzwiecki D, Lenz H-J, Innocenti F, Mahoney MR, O'Neil BH, Shaw JE, Polite BN, Hochster HS, Atkins JN, Goldberg RM, Mayer RJ, Schilsky RL, et al. CALGB/SWOG 80405: Phase III trial of irinotecan/5-FU/leucovorin (FOLFIRI) or oxaliplatin/5-FU/leucovorin (mFOLFOX6) with bevacizumab (BV) or cetuximab (CET) for patients (pts) with KRAS wild-type (wt) untreated metastatic adenocarcinoma of the colon or rectum (MCRC) J Clin Oncol. 2014;32(suppl; abstr LBA3)
    1. Kelley RK, Venook AP. Prognostic and predictive markers in stage II colon cancer: is there a role for gene expression profiling? Clin Colorectal Cancer. 2011;10:73–80. - PMC - PubMed
    1. Birkenkamp-Demtroder K, Maghnouj A, Mansilla F, Thorsen K, Andersen CL, Oster B, Hahn S, Orntoft TF. Repression of KIAA1199 attenuates Wnt-signalling and decreases the proliferation of colon cancer cells. Br J Cancer. 2011;105:552–561. - PMC - PubMed

Publication types

MeSH terms