. 2016 Feb;183(2):248-57.
doi: 10.1111/cei.12720. Epub 2015 Nov 24.

Respiratory syncytial virus induces phosphorylation of mTOR at ser2448 in CD8 T cells from nasal washes of infected infants

Affiliations

Respiratory syncytial virus induces phosphorylation of mTOR at ser2448 in CD8 T cells from nasal washes of infected infants

A P Duarte de Souza et al. Clin Exp Immunol. 2016 Feb.

Abstract

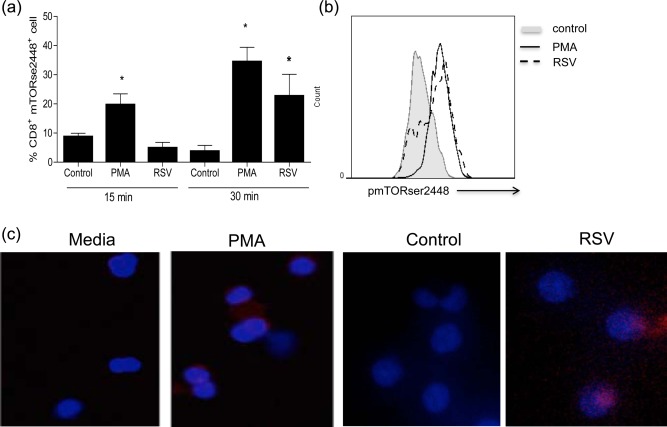
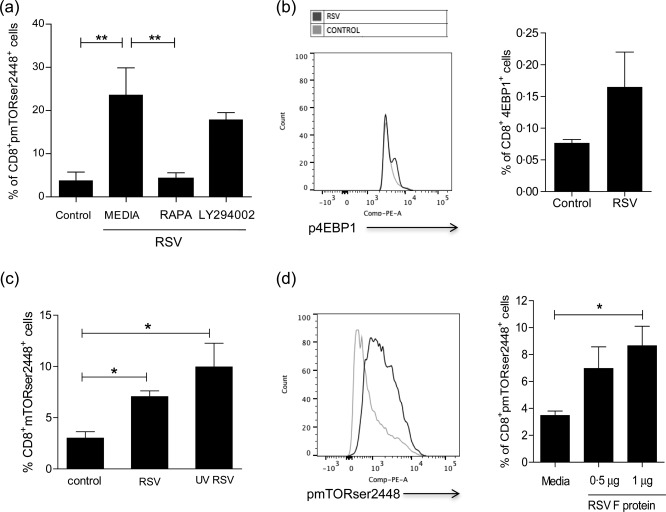
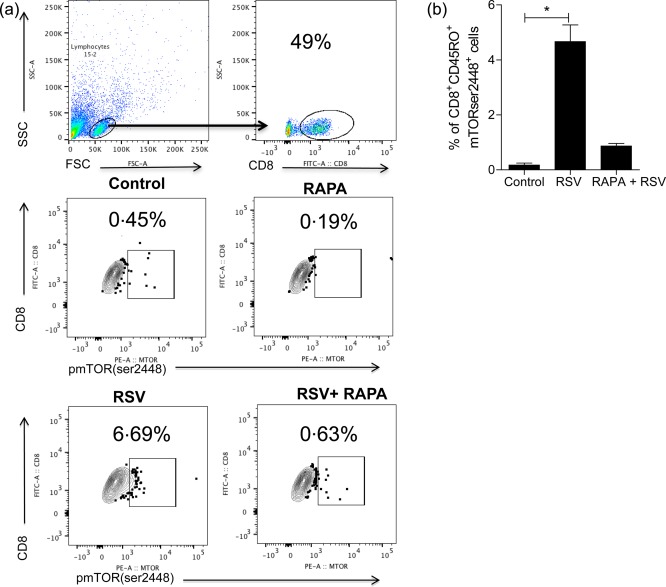
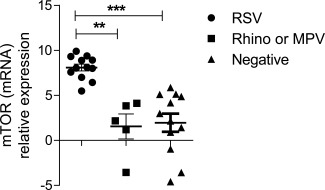
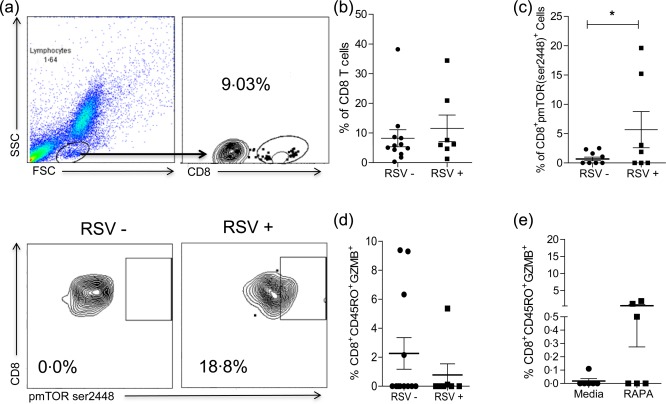
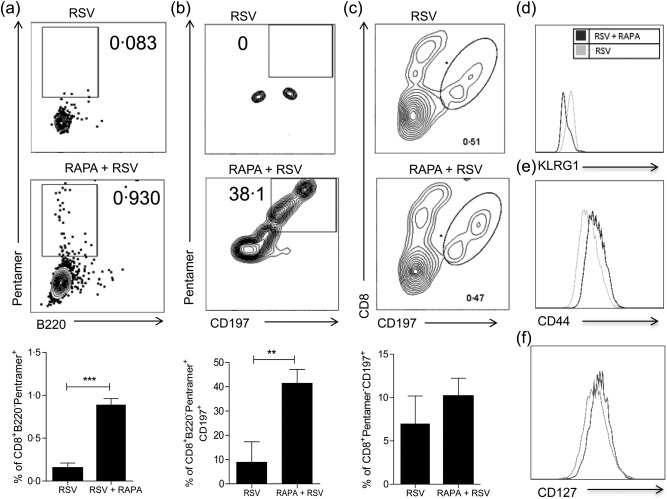
Respiratory syncytial virus (RSV)-specific CD8(+) T cell responses do not protect against reinfection. Activation of mammalian target of rapamycin (mTOR) impairs memory CD8(+) T cell differentiation. Our hypothesis was that RSV inhibits the formation of CD8(+) T cells memory responses through mTOR activation. To explore this, human and mouse T cells were used. RSV induced mTOR phosphorylation at Ser2448 in CD8 T cells. mTOR activation by RSV was completely inhibited using rapamycin. RSV-infected children presented higher mTOR gene expression on nasal washes comparing to children infected with metapneumovirus and rhinovirus. In addition, RSV-infected infants presented a higher frequency of CD8(+) pmTORser2448(+) T cells in nasal washes compared to RSV-negative infants. Rapamycin treatment increased the frequency of mouse CD8 RSV-M282-90 pentamer-positive T cells and the frequency of RSV-specific memory T cells precursors. These data demonstrate that RSV is activating mTOR directly in CD8 T cells, indicating a role for mTOR during the course of RSV infection.

Keywords: CD8+ T cells; RSV; RSV-infected infants; mTOR; nasal washes.


Figures

Figure 1
Figure 1
Respiratory syncytial virus (RSV) induced mammalian target of rapamycin (mTOR) phosphorylation on CD8 T cells. Peripheral blood mononuclear cells (PBMCs) (4 × 10⁵/well) were culture in RPMI 2% of fetal calf serum (FCS) with 102 plaque‐forming units (PFU) of RSV, phorbol myristate acetate (PMA) or control [uninfected human epithelial type 2 (Hep‐2) cells processed similarly to RSV‐infected Hep2 cells) for 15 or 30 min, then cells were fixed, permeabilized and stained with anti‐phospho mTOR Ser2448, followed by anti‐rabbit immunoglobulin (Ig)G cyanin 3 (Cy3) and analysed on a flow cytometer or the fluorescence microscope after cytospin and mTOR staining. (a) Graph showing the frequency of CD8+mTORser2448+ cells. (b) Histograms showing mTOR phosphorylation when cells were incubated with RSV compared to control and PMA. (b) Images of mTOR phosphorylation at ser2448 in BMCs incubated with RSV or control (blue = nuclei staining, red = mTORser2448 staining).
Figure 2
Figure 2
Rapamycin inhibited respiratory syncytial virus (RSV) induction of mammalian target of rapamycin (mTOR) phosphorylation on CD8 T cells. (a) Frequency of CD8+mTORser2448+ cells after peripheral blood mononuclear cell (PBMC) incubation with 20 ηg/ml of rapamycin or 50 µM of phosphoinositide 3‐kinase/protein kinase B (PI3K/AKT) inhibitor (LY294002) 1 h before RSV incubation for 30 min. (b) PBMC were incubated with 102 plaque forming units (PFU), RSV or control for 30 min and stained with anti‐4EPB1. Graph shows mean fluorescence intensity (MFI) of 4BP1 on RSV‐stimulated cells comparing to control. (c) Frequency of CD8+mTORser2448+ cells after PBMC incubation with ultraviolet (UV)‐inactivated RSV, RSV and control for 30 min. (d) Frequency of CD8+mTORser2448+ T cells after incubation with 0·5 μg or 1 μg of RSV F protein and media for 30 min. One‐way analysis of variance (anova) with Bonferroni's multiple comparison post‐test (*P < 0·05 and **P < 0·01).
Figure 3
Figure 3
Respiratory syncytial virus (RSV) induced mammalian target of rapamycin (mTOR) directly on CD8 memory T cells. Human CD8+CD45RO+CD45RACD56CD57 memory T cells were purified from peripheral blood mononuclear cells (PBMCs) by depletion of non‐CD8+ T cells and CD8+ T cells with a different phenotype using magnetic isolation. The purified cells were incubated with RSV for 30 min, following mTOR phosphorylation analysis with or without previous incubation with rapamycin for 1 h. (a) Dot‐plots show the frequency of CD8+mTORser2448+ cells. (b) Graph shows the frequency of CD8+CD45RO+mTORser2448+ cells. One‐way analysis of variance (anova) with Bonferroni's multiple comparison post‐test (*P < 0·05).
Figure 4
Figure 4
Mammalian target of rapamycin (mTOR) expression on nasal washes of respiratory syncytial virus (RSV)‐infected and non‐infected infants. mTOR gene expression was determined in nasal washes of RSV‐infected infants (n = 12), metapneumovirus (MPV)‐ or rhinovirus‐ infected infants (n = 5) and controls (negative to all viruses tested) (n = 12) using the delta‐cycle threshold (CT) method. The delta value was calculated by subtracting the CT value for the endogenous control gene glyceraldehyde‐3‐phosphate dehydrogenase (GAPDH) from the CT value for mTOR of each sample amplified by real‐time polymerase chain reaction (PCR). One‐way analysis of variance (anova) with Bonferroni's multiple comparison post‐test (**P < 0·001 and ***P < 0·0001).
Figure 5
Figure 5
CD8 T cell analysis of nasal washes from respiratory syncytial virus (RSV)‐infected and non‐infected infants. (a) Representative dot‐plots showing the gate strategy of CD8 T cell analysis on nasal washes and dot‐plots showing the frequency of CD8+mammalian target of rapamycin (mTOR)ser2448+ cells on nasal wash of an RSV‐negative () (n = 7) and an RSV‐positive (+) (n = 12) infant. (b) Graph shows the frequency of CD8+ T cells. (c) Graph shows the frequency of CD8+mTORser2448+ cells on nasal washes of RSV and RSV+ infants. (d) Graph shows the frequency of CD8+CD45RO+GZMB+ T cell on nasal washes of RSV – and RSV + infants. (e) Graph shows the frequency of CD8+CD45RO+granzyme B (ZMB)+ T cells from RSV+ infants after 1 h of rapamycin treatment or media only. Unpaired t‐test (*P < 0·05).
Figure 6
Figure 6
Rapamycin‐treated purified T cell co‐culture with respiratory syncytial virus (RSV)‐infected bone marrow‐derived dendritic cells (BMDCs) better differentiated to memory precursors. T cells were purified from BALB/c splenocytes and treated or not with rapamycin (20 ηg/ml) for 1 h, then 5 × 104 T cells were co‐cultured with 1·5 × 103 of BMDC cells infected with 102 plaque‐forming units (PFU) of RSV for 4 days. (a) Graph shows the frequency of CD8+B220pentamer+ cells. (b) Graph shows the frequency of CD8+B220pentamer+CD197+ cells. (c) Graph shows the frequency of CD8+pentamerCD197+ cells. (d) Histogram shows CD8+B220pentamer+KLRG1high cells. (e) Histogram shows CD8+CD44+ cells. (f) Histogram shows CD8+CD127+ cells. Unpaired t‐test (*P < 0·05; **P < 0·005; ***P < 0·0005).

References

    1. Glezen WP, Taber LH, Frank AL, Kasel JA. Risk of primary infection and reinfection with respiratory syncytial virus. Am J Dis Child 1986; 140:543–6. - PubMed
    1. Nair H, Nokes DJ, Gessner BD et al Global burden of acute lower respiratory infections due to respiratory syncytial virus in young children: a systematic review and meta‐analysis. Lancet 2010; 375:1545–55. - PMC - PubMed
    1. Bueno SM, Gonzalez PA, Pacheco R et al Host immunity during RSV pathogenesis. Int Immunopharmacol 2008; 8:1320–9. - PubMed
    1. Tregoning JS, Schwarze J. Respiratory viral infections in infants: causes, clinical symptoms, virology, and immunology. Clin Microbiol Rev 2010; 23:74–98. - PMC - PubMed
    1. DeVincenzo JP, Wilkinson T, Vaishnaw A et al Viral load drives disease in humans experimentally infected with respiratory syncytial virus. Am J Respir Crit Care Med 2010; 182:1305–14. - PMC - PubMed

Publication types

MeSH terms