. 2016 Jun;76(6):673-87.
doi: 10.1002/dneu.22352. Epub 2015 Oct 30.

Intraspinal serotonergic neurons consist of two, temporally distinct populations in developing zebrafish

Affiliations

Intraspinal serotonergic neurons consist of two, temporally distinct populations in developing zebrafish

Jacob E Montgomery et al. Dev Neurobiol. 2016 Jun.

Abstract

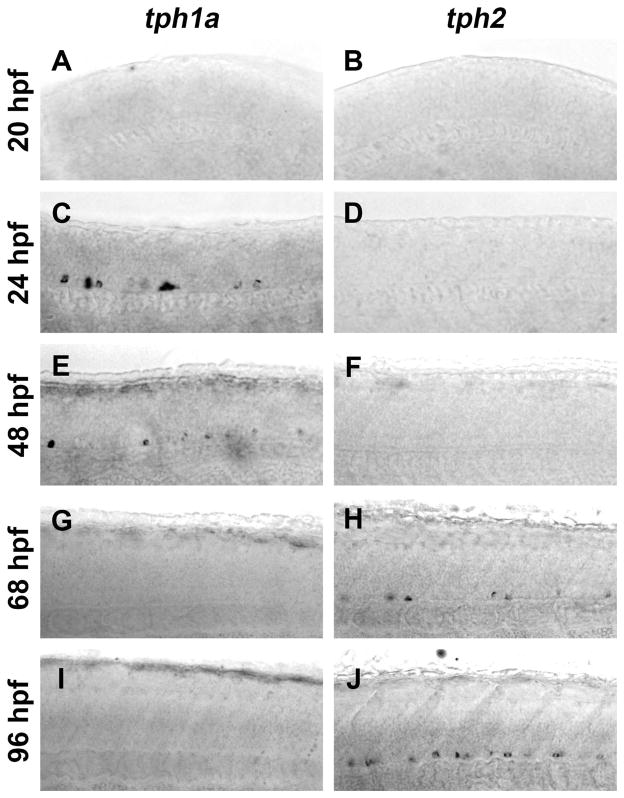
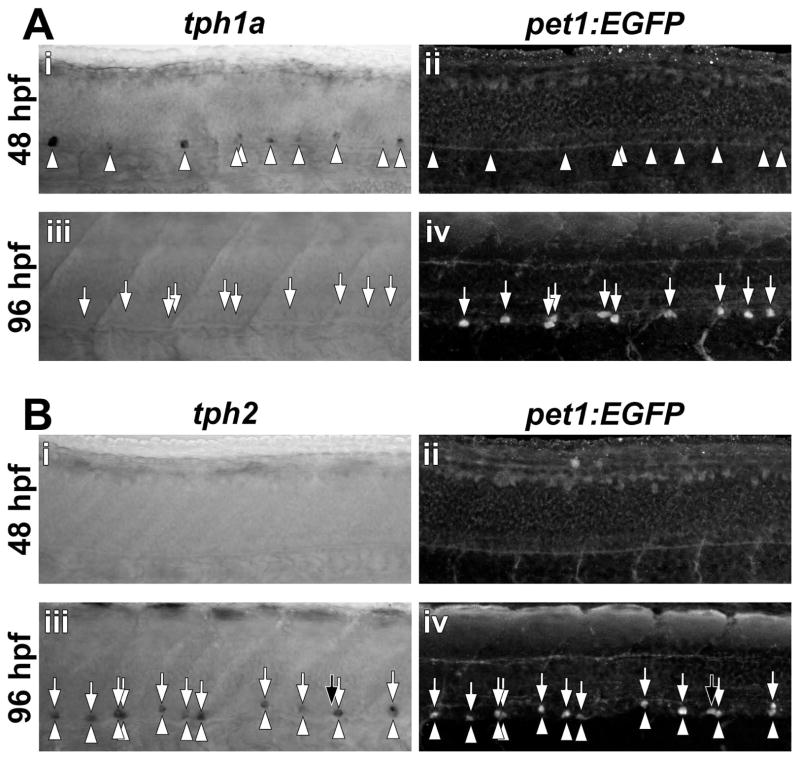
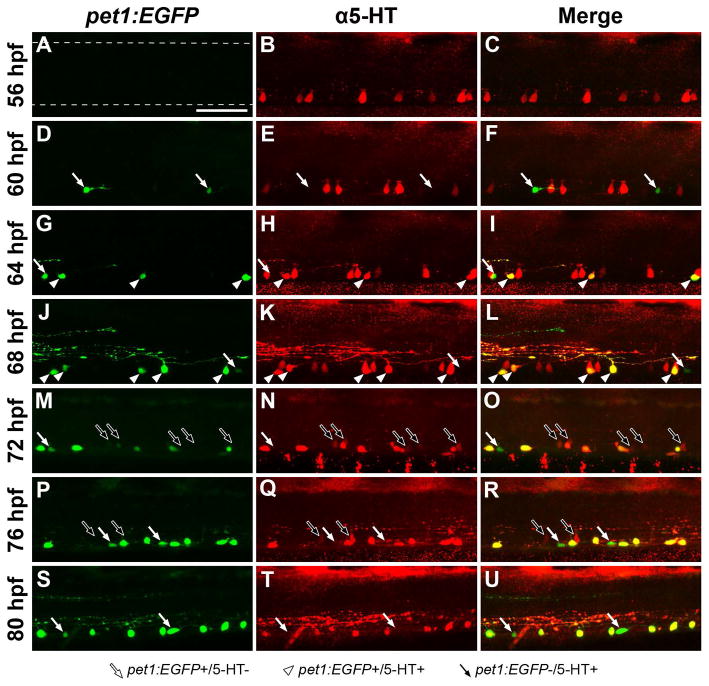
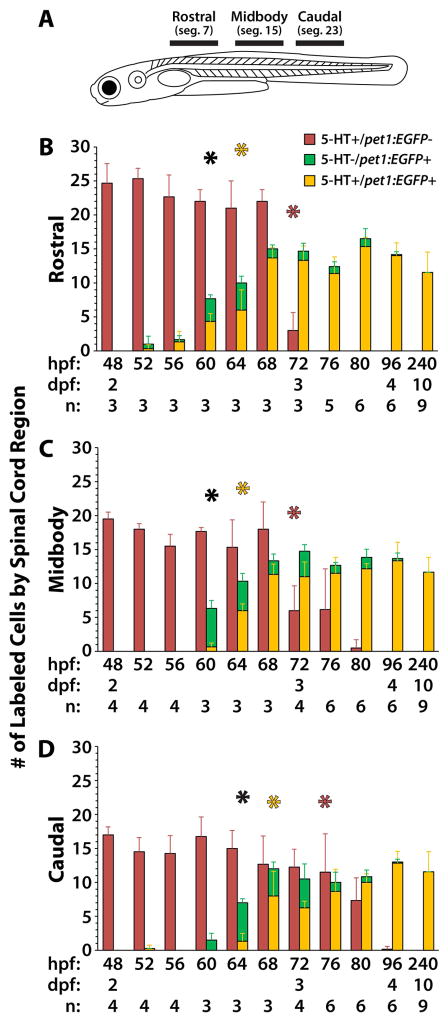
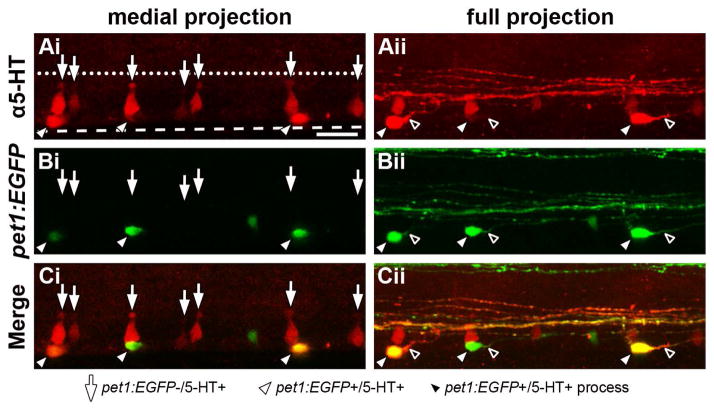
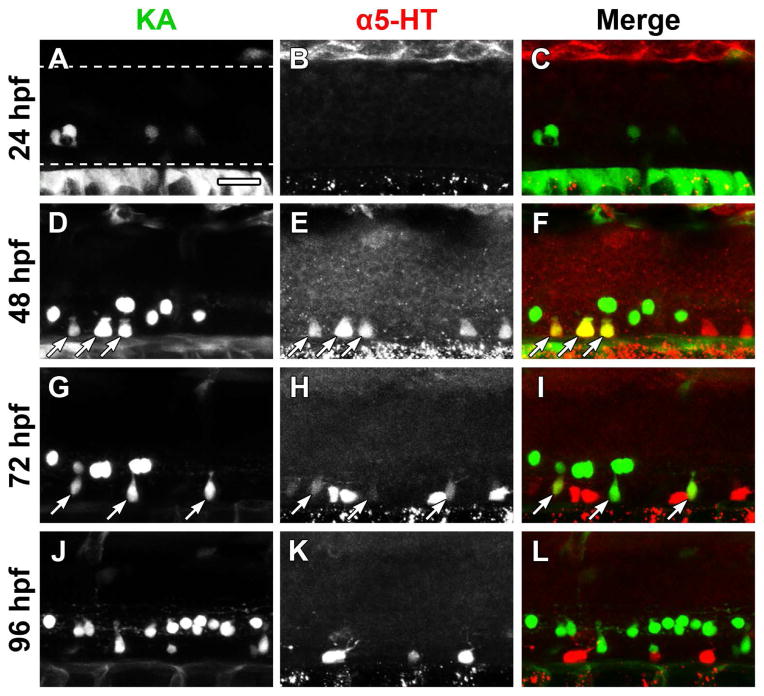
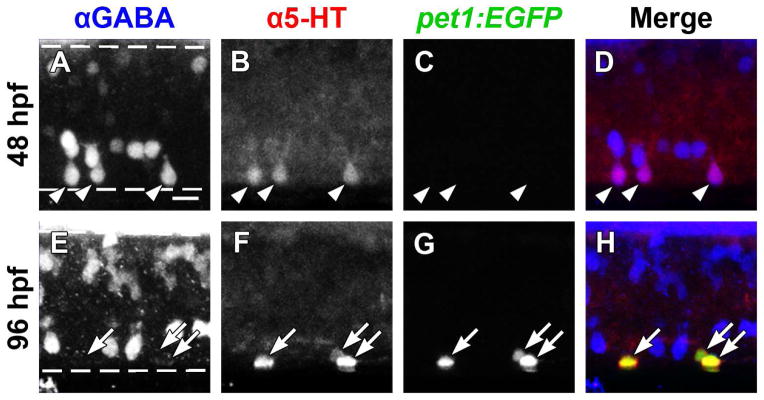
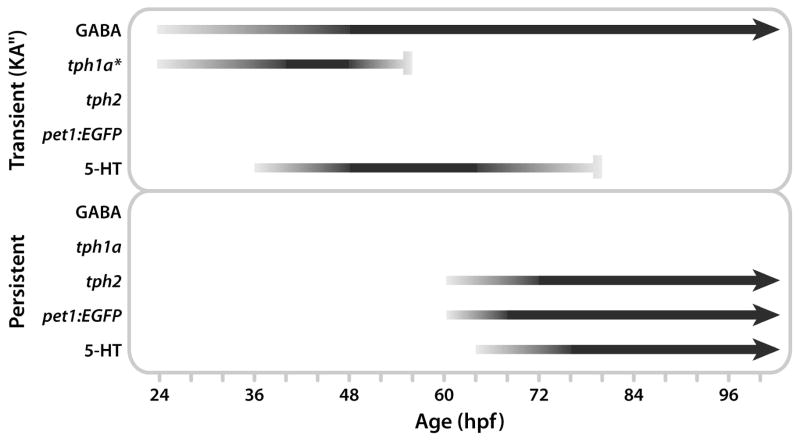
Zebrafish intraspinal serotonergic neuron (ISN) morphology and distribution have been examined in detail at different ages; however, some aspects of the development of these cells remain unclear. Although antibodies to serotonin (5-HT) have detected ISNs in the ventral spinal cord of embryos, larvae, and adults, the only tryptophan hydroxylase (tph) transcript that has been described in the spinal cord is tph1a. Paradoxically, spinal tph1a is only expressed transiently in embryos, which brings the source of 5-HT in the ISNs of larvae and adults into question. Because the pet1 and tph2 promoters drive transgene expression in the spinal cord, we hypothesized that tph2 is expressed in spinal cords of zebrafish larvae. We confirmed this hypothesis through in situ hybridization. Next, we used 5-HT antibody labeling and transgenic markers of tph2-expressing neurons to identify a transient population of ISNs in embryos that was distinct from ISNs that appeared later in development. The existence of separate ISN populations may not have been recognized previously due to their shared location in the ventral spinal cord. Finally, we used transgenic markers and immunohistochemical labeling to identify the transient ISN population as GABAergic Kolmer-Agduhr double-prime (KA″) neurons. Altogether, this study revealed a novel developmental paradigm in which KA″ neurons are transiently serotonergic before the appearance of a stable population of tph2-expressing ISNs.

Keywords: Kolmer-Agduhr; pet1; serotonin; spinal cord; tryptophan hydroxylase.


Figures

Figure 1
Figure 1. Expression of tph1a precedes expression of tph2 in the developing spinal cord
Spinal expression of tph1a (A, C, E, G, and I) and tph2 (B, D, F, H, and J) were compared by in situ hybridization in whole-mount embryos and larvae. A and B: Whole-mount in situ hybridization did not detect tph1a (A) or tph2 (B) transcripts in 20 hpf larvae. C–F: At 24 and 48 hpf tph1a (C and E), but not tph2 (D and F), was detected in the ventral spinal cord. G–J: Expression of tph1a was not observed after 68 hpf (G and I). Tph2-expressing cells were observed in the ventral spinal cord at 68 hpf (H) and labeling became more prominent at 96 hpf (J).
Figure 2
Figure 2. Spinal expression of pet1:EGFP corresponds to tph2, but not tph1a expression
Transcripts for tph1a (A) and tph2 (B) were detected by in situ hybridization (arrowheads) and EGFP was detected by immunohistochemistry (arrows) in whole-mount Tg(-3.2pet1:EGFP)ne0214 larvae. A: At 48 hpf, in situ hybridization revealed tph1a mRNA that was localized to cells distributed along the ventral spinal cord (Ai) and preceded pet1:EGFP transgene expression (Aii). Spinal tph1a expression was not observed at 96 hpf (Aiii) and EGFP was detected in single cells in the ventral spinal cord (Aiv). B: Neither tph2 nor pet1:EGFP was expressed at 48 hpf (Bi and Bii). At 96 hpf, the majority of labeled cells were double-positive for tph2 and pet1:EGFP (Biii and Biv; Colabeling indicated by the presence of vertically aligned arrowheads and arrows). Black arrows indicate a single cell that expressed pet1:EGFP, but not tph2.
Figure 3
Figure 3. Spinal 5-HT antibody labeling transitions from pet1:EGFP− to pet1:EGFP+ cells during development
Tg(-3.2pet1:EGFP)ne0214 larvae were labeled with antibodies to 5-HT every four hours between 56 and 80 hpf. Confocal Z-stacks were collected from the midbody region of the spinal cord (centered on body segment 15; dashed lines in A represent the dorsal and ventral boundaries of the spinal cord, approximately the same location in all panels). White arrows indicate cells that expressed pet1:EGFP and were not labeled with 5-HT antibodies, white arrowheads indicate cells in which pet1:EGFP expression and 5-HT colocalized, and black arrows indicate cells that did not express pet1:EGFP but were faintly labeled with 5-HT antibodies. A–C: 5-HT (B) was detected in cells in the ventral spinal cord prior to expression of pet1:EGFP (A, merge in C). D–F: Pet1:EGFP expression (D) was initially observed at 60 hpf in cells that did not colabel with 5-HT (E, merge in F; white arrows). G–L: At 64 and 68 hpf, a subset of pet1:EGFP+ cells (G, J) were 5-HT+ (H, K, merge in I, L; white arrowheads). 5-HT antibodies continued to detect pet1:EGFP− cells in the ventral spinal cord at 64 and 68 hpf (red cells in merged panels I, L). M–R: Colabeling of cells with pet1:EGFP (M, P) and 5-HT antibodies (N, Q) continued at 72 and 76 hpf (merge in O, R). The number of pet1:EGFP−/5-HT+ cells detected, and the intensity of 5-HT antibody labeling in these cells, were both reduced (black arrows). S–U: 5-HT antibody labeling (T) of cell somas was restricted to pet1:EGFP+ cells (S) in the ventral spinal cord at 80 hpf (merge in U). Scale Bar = 50 μm.
Figure 4
Figure 4. Quantification of 5-HT antibody labeled cells in pet1:EGFP transgenic larvae reveals a rostrocaudal progression of ISN development
Tg(-3.2pet1:EGFP)ne0214 larvae were fixed and labeled with antibodies to 5-HT every four hours between the ages of 48 and 80 hpf and at 96 and 240 hpf. A: Confocal Z-stacks were collected from regions of the spinal cord (represented by black bars in A) centered on body segments 7 (rostral), 15 (midbody), and 23 (caudal). B–D: The number of 5-HT+ cells that did not express pet1:EGFP (red bars), 5-HT− cells that expressed pet1:EGFP (green bars), and cells that were 5-HT and pet1:EGFP double-positive (yellow bars) were quantified in each region of the spinal cord. Black asterisks indicate the earliest age at which there was a significant increase in the total number of pet1:EGFP+ cells (combined pet1:EGFP+/5-HT− and pet1:EGFP+/5-HT+) compared to 48 hpf. Yellow asterisks indicate the earliest age at which there was a significant increase in the number of pet1:EGFP/5-HT double-positive cells compared to 48 hpf. Red asterisks indicate the earliest age at which there was a significant decrease in the number of pet1:EGFP−/5-HT+ cells compared to 48 hpf. Error bars represent SD.
Figure 5
Figure 5. ISNs that express pet1:EGFP are morphologically distinct from those that do not express pet1:EGFP
A 64 hpf Tg(-3.2pet1:EGFP)ne0214 larva was labeled with antibodies to 5-HT, mounted laterally, and a confocal Z-stack was collected through the mediolateral extent of the spinal cord. The morphological structure of ISN somas (red) was examined in a confocal projection restricted to the medial spinal cord (Ai–Ci, medial projection) and a projection through the entire width of the spinal cord (Aii–Cii; full projection). A: 5-HT was detected in cell bodies near the ventral boundary of the spinal cord (dashed line, same position in all panels) that possessed two distinct shapes; dorsoventrally elongated conical cell bodies with apical terminals (Ai, arrows) and round or ovoid cell bodies (Aii, white arrowheads) that each possessed a single, prominent projection (Aii, black arrowheads). Apical terminals of the conically-shaped cells were positioned near the central canal (represented by a dotted line, same position in all panels). B and C: Pet1:EGFP (B, green) was expressed in ISNs with ovoid (white arrowheads), but not conical somas (arrows; merge in C). Scale bar = 20 μm.
Figure 6
Figure 6. Kolmer-Agduhr (KA) neurons are 5-HT immunoreactive at 48 and 72 hpf
The Et(-1.5hsp70l:Gal4-VP16)s1003t and Tg(UAS-E1b:Kaede)s1999t lines were crossed to express Kaede in KA neurons (green) of progeny, which were immunolabeled for 5-HT (red). The Et(-1.5hsp70l:Gal4-VP16)s1003t line did not drive transgene expression in all KA neurons. A–C: Kaede expression (A), but not 5-HT antibody labeling (B, merge in C), was detected at 24 hpf (dashed lines represent the dorsal and ventral boundaries of the spinal cord, approximately the same location in all panels). D–F: A subset of ventral KA neurons (D) were labeled with 5-HT antibodies (E, merge in F; arrows indicate colocalization). G–I: 5-HT antibody labeling (H) of KA neurons (G) was faint at 72 hpf (arrows) and Kaede-negative cells were more strongly labeled with 5-HT antibodies (H, merge in I). J–L: Kaede expression (J) and 5-HT antibody labeling (K) did not overlap at 96 hpf (L). Scale bar = 20 μm.
Figure 7
Figure 7. GABA and 5-HT immunolabeling overlap in ISNs that do not express pet1:EGFP
Whole-mount Tg(-3.2pet1:EGFP)ne0214 larvae were double-labeled with antibodies to GABA (blue) and 5-HT (red; dashed lines represent the dorsal and ventral spinal cord boundaries, same in A–D and E–H). A–D: A subset of ventral GABA-positive neurons (A) colabeled with 5-HT antibodies (B, merge in D; arrowheads indicate colocalization of GABA and 5-HT) at 48 hpf. Expression of pet1:EGFP (green) was not detected at 48 hpf (C). E–H: GABA (E) ceased to colocalize with 5-HT (F) at 96 hpf, as 5-HT became restricted to non-GABAergic pet1:EGFP+ (G; merge in H; arrows indicate colocalization of pet1:EGFP and 5-HT). Scale bar = 10 μm.
Figure 8
Figure 8. Schematic model of marker labeling in transient and persistent serotonergic spinal cell populations
Horizontal lines indicate marker labeling and line intensity represents labeling intensity (black represents strongest labeling). Arrowheads indicate the hypothesized persistence of a label beyond the ages included in this study (10 dpf), and vertical bars indicate the last age that a marker was detected in a cell population. Top: Tph1a was expressed from 24 hpf until approximately 56 hpf (detected at 48, but not 68 hpf) and GABAergic KA neurons contained 5-HT from 36 hpf (estimate based on previous reports) until 80 hpf. The model predicts that tph1a is expressed in KA neurons, although localization of tph1a to the KA neurons has not yet been demonstrated (indicated by the asterisk). Bottom: Tph2 and pet1:EGFP expression began at 60 hpf and 5-HT was first detected in a second population of ISNs at 64 hpf. Colabeling of these makers persisted until at least 10 dpf.

References

    1. Airhart MJ, Lee DH, Wilson TD, Miller BE, Miller MN, Skalko RG. Movement disorders and neurochemical changes in zebrafish larvae after bath exposure to fluoxetine (PROZAC) Neurotoxicol Teratol. 2007;29:652–664. - PubMed
    1. Airhart MJ, Lee DH, Wilson TD, Miller BE, Miller MN, Skalko RG, Monaco PJ. Adverse effects of serotonin depletion in developing zebrafish. Neurotoxicol Teratol. 2012;34:152–160. - PubMed
    1. Akitake CM, Macurak M, Halpern ME, Goll MG. Transgenerational analysis of transcriptional silencing in zebrafish. Dev Biol. 2011;352:191–201. - PMC - PubMed
    1. Barnes NM, Sharp T. A review of central 5-HT receptors and their function. Neuropharmacology. 1999;38:1083–1152. - PubMed
    1. Bellipanni G, Rink E, Bally-Cuif L. Cloning of two tryptophan hydroxylase genes expressed in the diencephalon of the developing zebrafish brain. Mech Dev. 2002;119(Suppl 1):S215–220. - PubMed

Publication types

MeSH terms

LinkOut - more resources