

The impact of parametrized convection on cloud feedback
- PMID: 26438278
- PMCID: PMC4608036
- DOI: 10.1098/rsta.2014.0414
The impact of parametrized convection on cloud feedback
Abstract
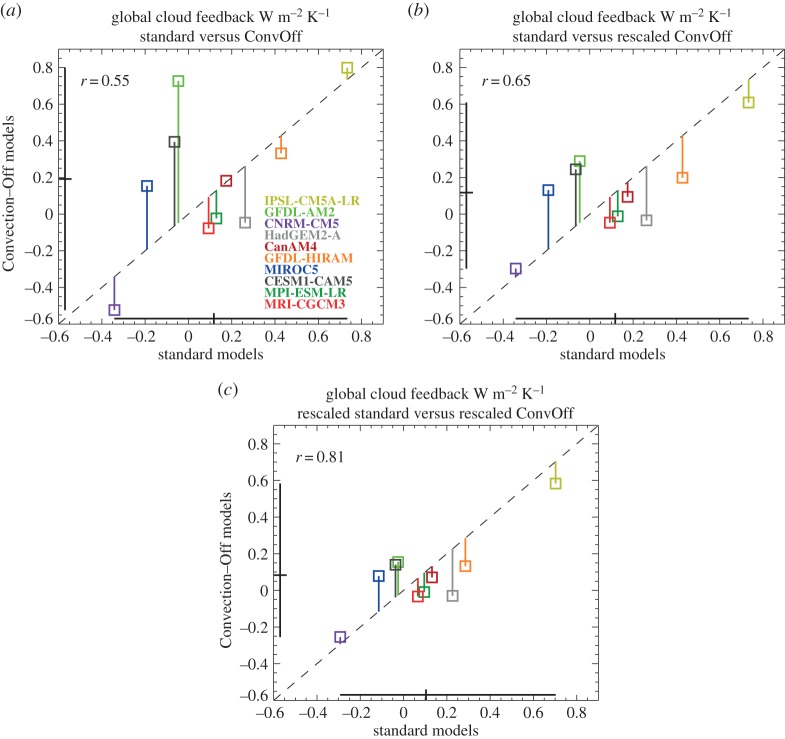
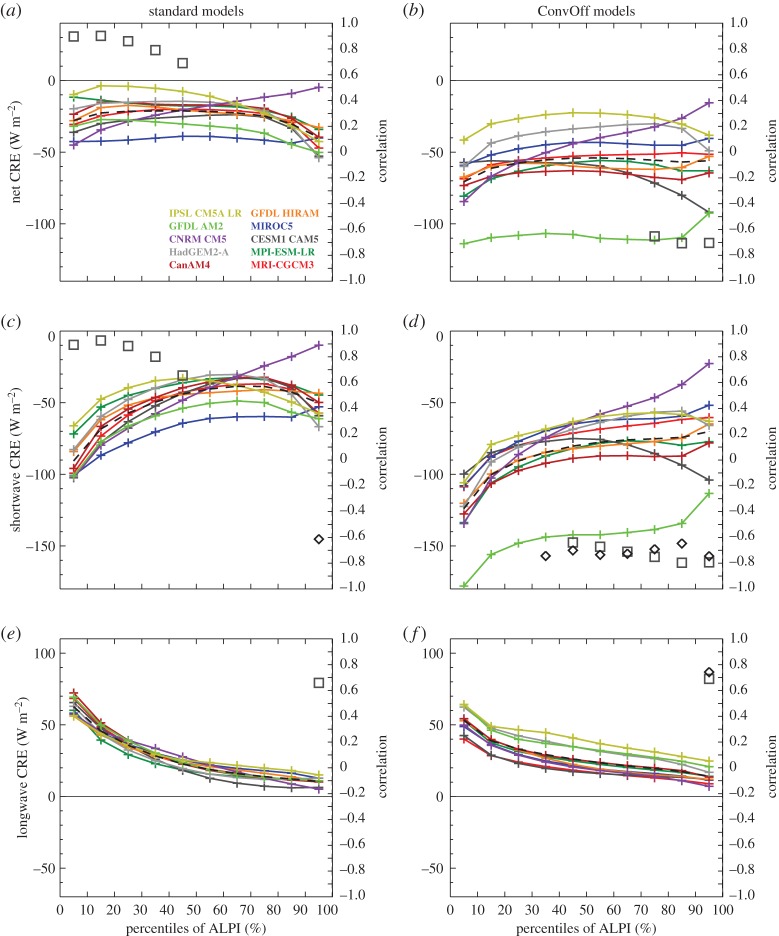
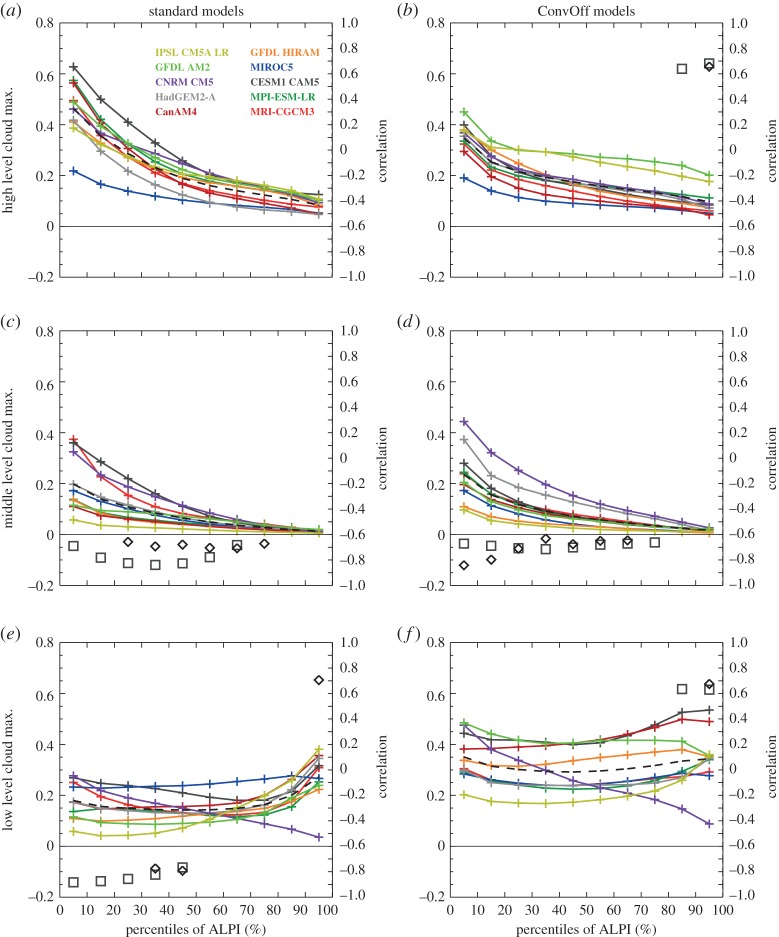
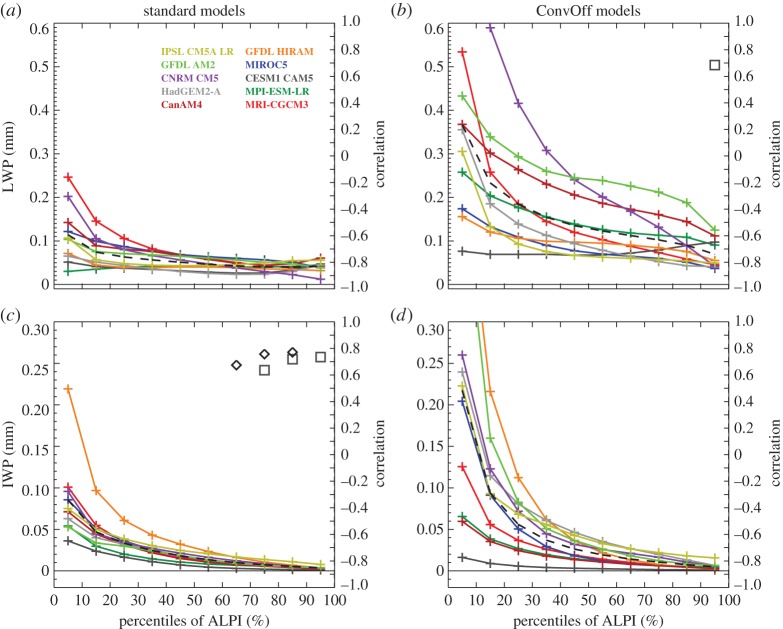
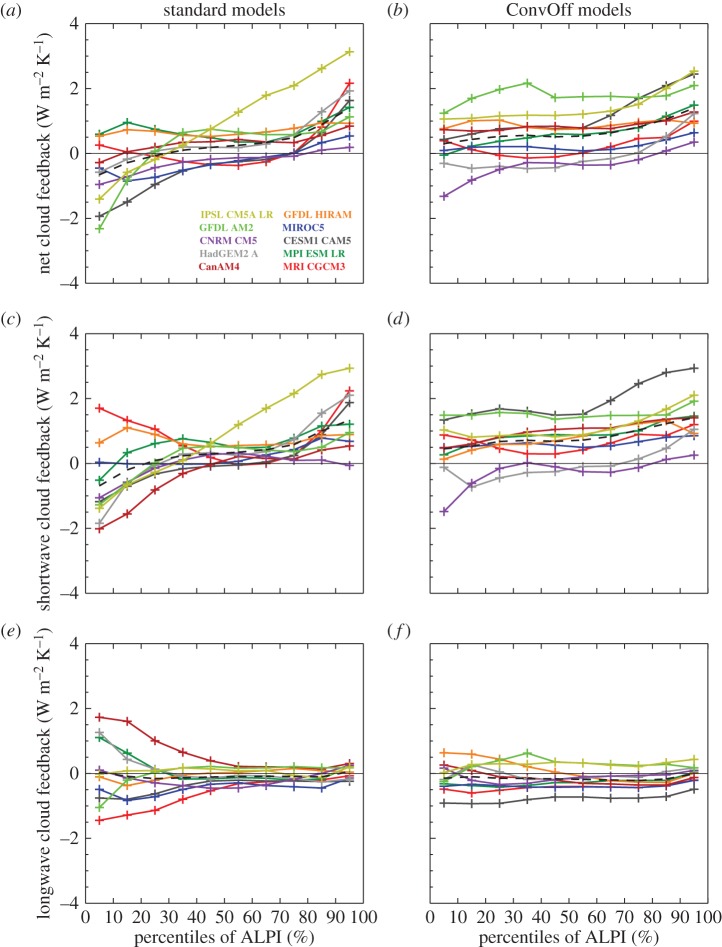
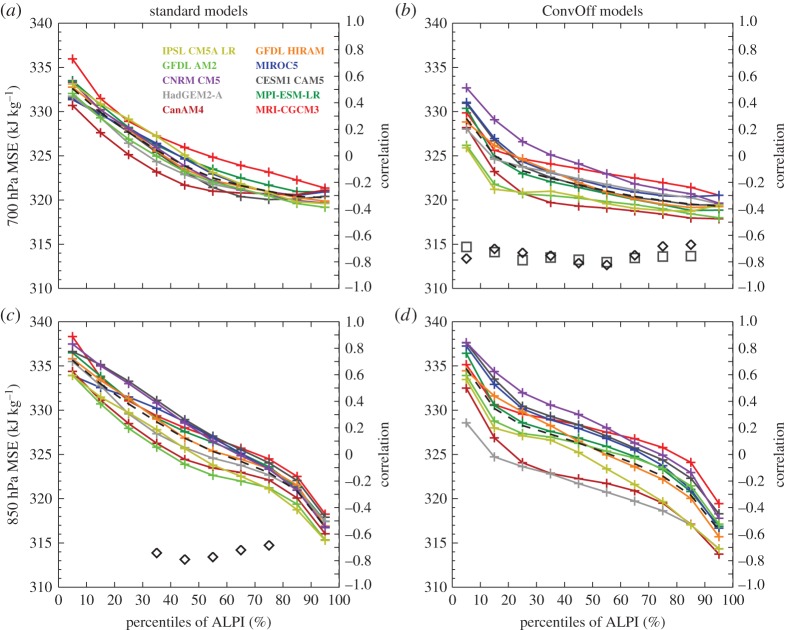
We investigate the sensitivity of cloud feedbacks to the use of convective parametrizations by repeating the CMIP5/CFMIP-2 AMIP/AMIP + 4K uniform sea surface temperature perturbation experiments with 10 climate models which have had their convective parametrizations turned off. Previous studies have suggested that differences between parametrized convection schemes are a leading source of inter-model spread in cloud feedbacks. We find however that 'ConvOff' models with convection switched off have a similar overall range of cloud feedbacks compared with the standard configurations. Furthermore, applying a simple bias correction method to allow for differences in present-day global cloud radiative effects substantially reduces the differences between the cloud feedbacks with and without parametrized convection in the individual models. We conclude that, while parametrized convection influences the strength of the cloud feedbacks substantially in some models, other processes must also contribute substantially to the overall inter-model spread. The positive shortwave cloud feedbacks seen in the models in subtropical regimes associated with shallow clouds are still present in the ConvOff experiments. Inter-model spread in shortwave cloud feedback increases slightly in regimes associated with trade cumulus in the ConvOff experiments but is quite similar in the most stable subtropical regimes associated with stratocumulus clouds. Inter-model spread in longwave cloud feedbacks in strongly precipitating regions of the tropics is substantially reduced in the ConvOff experiments however, indicating a considerable local contribution from differences in the details of convective parametrizations. In both standard and ConvOff experiments, models with less mid-level cloud and less moist static energy near the top of the boundary layer tend to have more positive tropical cloud feedbacks. The role of non-convective processes in contributing to inter-model spread in cloud feedback is discussed.
Keywords: climate; cloud; convection; feedback; parametrization.
© 2015 The Authors.
Figures
References
-
- Field CB. et al. 2014. IPCC summary for policymakers. In Climate change 2014: impacts, adaptation, and vulnerability. Part A: global and sectoral aspects. Contribution of Working Group II to the Fifth Assessment Report of the Intergovernmental Panel on Climate Change, pp. 1–32. Cambridge, UK: Cambridge University Press.
-
- Collins M. et al. 2013. Long-term climate change: projections, commitments and irreversibility. In Climate change 2013: the physical science basis. Contribution of Working Group I to the Fifth Assessment Report of the Intergovernmental Panel on Climate Change. Cambridge, UK: Cambridge University Press.
-
- Boucher O. et al. 2013. Clouds and aerosols. In Climate change 2013: the physical science basis. Contribution of Working Group I to the Fifth Assessment Report of the Intergovernmental Panel on Climate Change. Cambridge, UK: Cambridge University Press.
-
- Bony S, Webb M, Bretherton CS, Klein SA, Siebesma P, Tselioudis G, Zhang M. 2011. CFMIP: towards a better evaluation and understanding of clouds and cloud feedbacks in CMIP5 models. Clivar Exchanges 56, 20–22.
-
- Medeiros B, Stevens B, Bony S. 2014. Using aquaplanets to understand the robust responses of comprehensive climate models to forcing. Clim. Dyn. 44, 1957–1977. (10.1007/s00382-014-2138-0) - DOI
LinkOut - more resources
Full Text Sources
Other Literature Sources