

Estimating Trait Heritability in Highly Fecund Species
- PMID: 26438295
- PMCID: PMC4683637
- DOI: 10.1534/g3.115.020701
Estimating Trait Heritability in Highly Fecund Species
Abstract
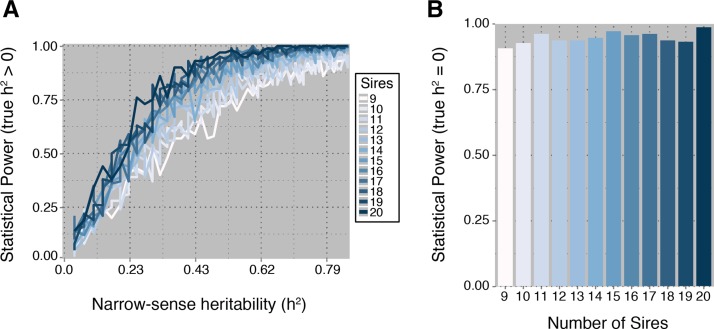
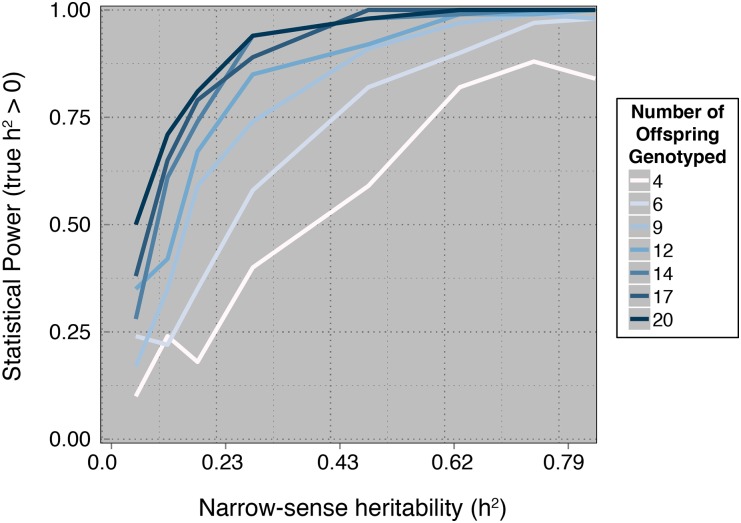
Increasingly, researchers are interested in estimating the heritability of traits for nonmodel organisms. However, estimating the heritability of these traits presents both experimental and statistical challenges, which typically arise from logistical difficulties associated with rearing large numbers of families independently in the field, a lack of known pedigree, the need to account for group or batch effects, etc. Here we develop both an empirical and computational methodology for estimating the narrow-sense heritability of traits for highly fecund species. Our experimental approach controls for undesirable culturing effects while minimizing culture numbers, increasing feasibility in the field. Our statistical approach accounts for known issues with model-selection by using a permutation test to calculate significance values and includes both fitting and power calculation methods. We further demonstrate that even with moderately high sample-sizes, the p-values derived from asymptotic properties of the likelihood ratio test are overly conservative, thus reducing statistical power. We illustrate our methodology by estimating the narrow-sense heritability for larval settlement, a key life-history trait, in the reef-building coral Orbicella faveolata. The experimental, statistical, and computational methods, along with all of the data from this study, are available in the R package multiDimBio.
Keywords: binary variable traits; common garden; coral settlement; heritability; nonmodel organisms.
Copyright © 2015 Davies et al.
Figures


References
-
- Baird A. H., Guest J. R., Willis B. L., 2009. Systematic and biogeographical patterns in the reproductive biology of scleractinian corals. Annu. Rev. Ecol. Evol. Syst. 40: 551–571.
-
- Bates, D., M. Maechler, B. Bolker, and S. Walker, 2015 lme4: Linear mixed-effects models using eigen and s4. R package version 11–8. Available at: https://cran.r-project.org/web/packages/lme4/lme4.pdf. Accessed October 20, 2015.
-
- Baums I. B., Johnson M. E., Devlin-Durante M. K., Miller M. W., 2010. Host population genetic structure and zooxanthellae diversity of two reef-building coral species along the Florida Reef Tract and wider Caribbean. Coral Reefs 29: 835–842.
-
- Bay L. K., Choat J. H., van Herwerden L., Robertson D. R., 2004. High genetic diversities and complex genetic structure in an indo-pacific tropical reef fish (Chlorurus sordidus): evidence of an unstable evolutionary past? Mar. Biol. 144: 757–767.
Publication types
MeSH terms
LinkOut - more resources
Full Text Sources
Other Literature Sources