. 2015 Oct 19;212(11):1833-50.
doi: 10.1084/jem.20151323. Epub 2015 Oct 5.

Cohesin loss alters adult hematopoietic stem cell homeostasis, leading to myeloproliferative neoplasms

Affiliations

Cohesin loss alters adult hematopoietic stem cell homeostasis, leading to myeloproliferative neoplasms

Jasper Mullenders et al. J Exp Med. .

Abstract

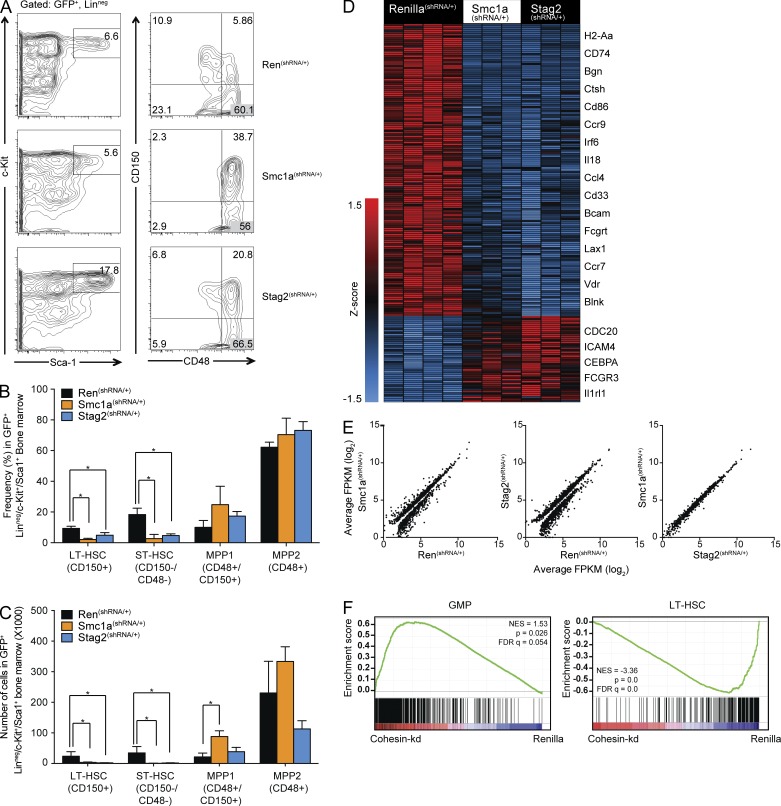
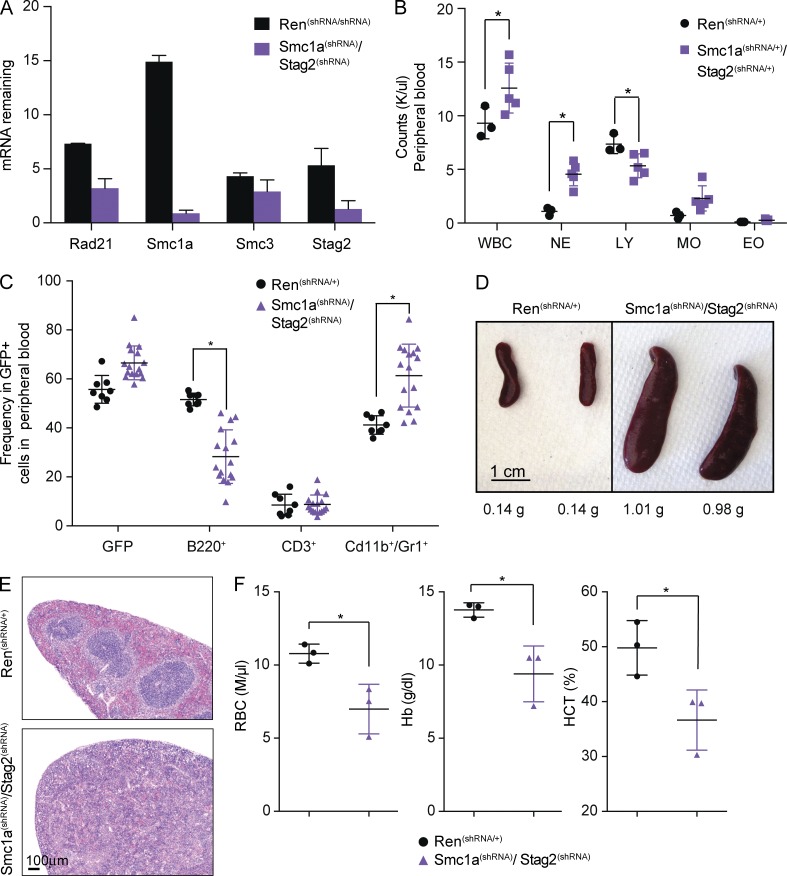
The cohesin complex (consisting of Rad21, Smc1a, Smc3, and Stag2 proteins) is critically important for proper sister chromatid separation during mitosis. Mutations in the cohesin complex were recently identified in a variety of human malignancies including acute myeloid leukemia (AML). To address the potential tumor-suppressive function of cohesin in vivo, we generated a series of shRNA mouse models in which endogenous cohesin can be silenced inducibly. Notably, silencing of cohesin complex members did not have a deleterious effect on cell viability. Furthermore, knockdown of cohesin led to gain of replating capacity of mouse hematopoietic progenitor cells. However, cohesin silencing in vivo rapidly altered stem cells homeostasis and myelopoiesis. Likewise, we found widespread changes in chromatin accessibility and expression of genes involved in myelomonocytic maturation and differentiation. Finally, aged cohesin knockdown mice developed a clinical picture closely resembling myeloproliferative disorders/neoplasms (MPNs), including varying degrees of extramedullary hematopoiesis (myeloid metaplasia) and splenomegaly. Our results represent the first successful demonstration of a tumor suppressor function for the cohesin complex, while also confirming that cohesin mutations occur as an early event in leukemogenesis, facilitating the potential development of a myeloid malignancy.


Figures

Figure 1.
Figure 1.
Cohesin mutations in AML cause loss of function and disrupt core complex formation. (A) Flag-tagged wild-type and AML patient mutants of Rad21 were transfected in 293T cells. After immunoprecipitation with Flag-beads, Western blot analysis was performed for endogenous Smc1a, Smc3, and Stag2 protein. Some Rad21 fragments (E212* and L255*) are poorly expressed, possibly because of degradation (Zhang et al., 2013). (B) Flag-tagged wild-type and AML patient mutants of Stag2 were transfected in 293T cells. After immunoprecipitation with Flag-beads, Western blot analysis was performed for endogenous Rad21, Smc1a, and Smc3 protein. Stag2 mutants R614* and H738* are known to be aberrantly localized to the cytoplasm; this is possibly the case for Q801* as well (Solomon et al., 2011). (C) Flag-tagged wild-type and AML patient mutants of Smc3 were transfected in 293T cells. After immunoprecipitation with Flag-beads, Western blot analysis was performed for endogenous Rad21, Smc1a, and Stag2 protein. Dashed line indicates intervening lanes were spliced out.
Figure 2.
Figure 2.
Cohesin knockdown cells acquire replating capacity in vitro. (A) Mouse c-Kit+ cells were infected with retroviral shRNA vectors targeting Rad21, Smc1a, Smc3, and Stag2. Infected cells were seeded in methylcellulose and replated for five passages. (B) qRT-PCR to assess knockdown of Rad21, Smc1a, Smc3, and Stag2 shRNA–infected cells after the first plating in methylcellulose. (C and D) Quantification of flow cytometry analysis of Smc1a knockdown cells after the first (P1) and fourth plating (P4). Cells were stained for myeloid differentiation markers (Cd11b and Gr1; C) and stem cells markers c-Kit and Sca1 (D). (E) Morphology of Renilla and cohesin knockdown cells (as indicated) after the first and third plating in methylcellulose. (F) RNA-seq analysis of cohesin knockdown cells after the first (CFU P1) and fifth (CFU P5) plating in methylcellulose. Heat map shows genes that are significantly differently expressed (P < 0.05). (G) Metaphase spreads of control and Smc1a knockdown cells after the first plating in methylcellulose. (H) Quantification of fraction of metaphases that show loss of SCC in control and cohesin knockdown cells after the first plating in methylcellulose. (I) Quantification of number of chromosomes as counted in metaphase spreads of control and cohesin knockdown cells after the first plating in methylcellulose. Error bars indicate SD.
Figure 3.
Figure 3.
Creation of mouse models for in vivo cohesin loss of function. (A) qRT-PCR for cohesin core subunits (Rad21, Smc1a, Smc3, and Stag2) in the stem cell and progenitor compartment of mouse bone marrow. Cells were sorted as follows: LT-HSC (Lin/c-Kit+/Sca1+/CD150+), short-term HSC (ST-HSC; Lin/c-Kit+/Sca1+/CD48/CD150), MPP1 (Lin/c-Kit+/Sca1+/CD48+/CD150+), MPP2 (Lin/c-Kit+/Sca1+/CD48+/CD150), GMP (Lin/c-Kit+/Sca1/FcRII/III+/CD34+), common myeloid progenitor (CMP; Lin/c-Kit+/Sca1/FcRII/III/CD34+), megakaryocyte-erythrocyte progenitor (MEP; Lin/c-Kit+/Sca1/FcRII/III/CD34), and megakaryocyte progenitor (MkP; Lin/c-Kit+/Sca1/CD150+/CD41+). (B) qRT-PCR for the cohesin subunits in bone marrow myeloid, erythroid, and B cells (n = 3). Cells were sorted from mouse bone marrow as follows: B cells (B220+), myeloid cells (Cd11b+/Gr1+), and erythroblasts (CD71+/Ter119+). RNA was extracted and qRT-PCR performed for the indicated genes. (C) Schematic of loci used in an shRNA mouse. The ROSA26 locus drives constitutive expression of an M2rtTA transgene. Upon addition of doxycycline, the TRE in the Col1a1 locus is activated, which leads to expression of the shRNA, which is located in the 3′ UTR of GFP. (D) GFP expression after 10 d of doxycycline exposure in mouse total bone marrow of the indicated genotypes as measured by flow cytometry. (E) Mean frequency of GFP-expressing cells as measured by flow cytometry in the organs indicated. (F) Western blot analysis of total thymocytes from two to three individual animals (treated with doxycycline for 10 d) per genotype (Ren(shRNA/+), Rad21(shRNA/+), Smc1a(shRNA/+), and Stag2(shRNA/+)). Error bars indicate SD.
Figure 4.
Figure 4.
Efficient in vivo silencing of cohesin does not lead to acute phenotypes. (A) GFP+ cells were sorted from total bone marrow from Renilla(shRNA/+), Rad21(shRNA/+), Smc1a(shRNA/+), and Stag2(shRNA/+) mice (n = 2). Protein was extracted and blotted for the indicated antibodies. (B) Erythroid progenitors (GFP+, CD71+/Ter119+) were FACS sorted from bone marrow of mice (n = 3) that were exposed to doxycycline for 10 d. qRT-PCR was performed (using Actin B as reference), and cohesin knockdown was compared with Renilla control animals. (C) Animals (n = 9) were exposed to doxycycline for 10 d and blood was drawn. FACS analysis is shown for B (B220+), T (CD3+), and myeloid cells (Cd11b+/Gr1+). (D) c-Kit+ cells from Renilla(shRNA/+) and Smc1a(shRNA/+) mice were cultured for 6 d. Smc1a protein was immunoprecipitated and blotted for indicated antibodies (IP, immunoprecipitation; FT, flow through). (E) Bone marrow of Renilla(shRNA/+), Rad21(shRNA/+), Smc1a(shRNA/+), and Stag2(shRNA/+) mice (n = 3) was plated in methylcellulose containing doxycycline and replated for four passages. Error bars indicate SD.
Figure 5.
Figure 5.
Cohesin knockdown leads to changes in the myeloid/erythroid lineage in blood and spleen. (A) Frequency of GFP+ cells as measured by flow cytometry (*, P < 0.05). (B) Flow cytometry analysis of peripheral blood from Renilla(shRNA/+), Rad21(shRNA/+), Smc1a(shRNA/+), and Stag2(shRNA/+) mice (n = 3) for the indicated antibodies. (C) Absolute numbers of lymphocytes and neutrophils/monocytes are plotted for the indicated genotypes (*, P < 0.05). (D) Representative spleens from Smc1a(shRNA/+) mice exposed to doxycycline for 30 d. (E) Flow cytometry analysis of spleen from Renilla(shRNA/+), Rad21(shRNA/+), Smc1a(shRNA/+), and Stag2(shRNA/+) mice (n = 3; *, P < 0.05) for the indicated antibodies. (F) Representative FACS analysis of the spleen of GFP+ basophilic erythroblasts (CD71+/Ter119+) and orthochromatophilic erythroblasts (Ter119+) for the indicated genotypes. (G) Quantification of GFP+ basophilic erythroblasts (CD71+/Ter119+) and orthochromatophilic erythroblasts (Ter119+) in spleens (n = 3) in animals of the indicated genotype that were exposed to doxycycline for 30 d (*, P < 0.05). (H) Frequencies of GFP+/Lineage/c-Kit+ cells as measured in the spleens of the indicated genotypes (n = 3; *, P < 0.05). Error bars indicate SD.
Figure 6.
Figure 6.
Cohesin knockdown induces myeloid progenitor skewing and increases the size of the nucleus. (A) Quantification of flow cytometry of bone marrow of animals (n = 3) of the indicated genotype (*, P < 0.05). (B) FACS analysis of bone marrow of cohesin knockdown mice (doxycycline 30 d, n = 3) for myeloid progenitors (GFP+/Lin/c-Kit+/Sca1). (C) Quantification of myeloid progenitors in the bone marrow of mice (n = 3) with the indicated genotype (*, P < 0.05). (D) GFP+/c-Kit+ cells were sorted from mouse (n = 3) bone marrow of control and cohesin knockdown (10 d of doxycycline). Cells were fixed on glass slides and stained with DAPI. (E) Quantification of nuclear size of GFP+/c-Kit+ cells for the indicated genotypes. Surface area of nuclei was measured using DAPI intensity with ImageJ (National Institutes of Health; *, P < 0.05). Error bars indicate SD.
Figure 7.
Figure 7.
Rapid skewing of HSCs induced by cohesin knockdown. (A) Mouse bone marrow (n = 3; genotype is indicated) was isolated and stained with antibodies for lineage markers, c-Kit, Sca1, CD48, and CD150. The stem cell compartment was visualized by gating as follows: GFP+ > Lineage > c-Kit+/Sca1+ (LSK). Left panels indicate the frequency of LSK cells in the indicated genotype. Right panels show stem cell and MPP compartment, CD150+ LT-HSCs, CD150/CD48 short-term HSCs, CD150+/CD48+ MPP1, and CD48+ MPP2. (B) Quantification of changes in stem cell compartment of Smc1a(shRNA/+) and Stag2(shRNA/+) mice (n = 3; *, P < 0.05). (C) Quantification of absolute cell number of HSCs and MPPs in the bone marrow of cohesin knockdown mice (n = 3; *, P < 0.05). (D) Gene expression analysis by RNA sequencing of sorted LSK cells of cohesin knockdown bone marrow. GFP+/Lin/Sca1+/c-Kit+ cells were sorted from bone marrow of mice (n = 3 or 4) exposed to doxycycline for 10 d. Heat map shows genes that are significantly (P < 0.05) differentially expressed with a cutoff of 1.5 FC. (E) Scatter plots of FPKM obtained from RNA-seq results from Renilla(shRNA/+), Smc1a(shRNA/+), and Stag2(shRNA/+) LSK cells. (F) GSEA of RNA-seq data comparing Renilla with cohesin knockdown. Cohesin knockdown LSK cells are enriched for a GMP signature and depleted for an LT-HSC signature. Error bars indicate SD.
Figure 8.
Figure 8.
Cohesin silencing leads to changes in chromatin accessibility in LSK cells. (A) Venn diagrams of ATAC-seq peaks (peak score > 25) found in LSK cells isolated from Renilla(shRNA/+) and Stag2(shRNA/+) mice. (B) Heat map of peaks found significantly enriched (FC(abs) > 2, P < 0.05) Renilla(shRNA/+) and Stag2(shRNA/+) ATAC-seq centered on the peak maximum. (C) Changes in chromatin accessibility in key myeloid differentiation genes (Mpo, Fcgr3/4, and GATA1). Tracks showing increase in ATAC-seq signal on MPO and FCGR3/4 genes in LSK cells from Renilla(shRNA/+) and Stag2(shRNA/+) mice. Loss of ATAC-seq signal in the stem cell gene CD74 in LSK cells from Renilla(shRNA/+) and Stag2(shRNA/+) mice. (D) Changes in gene expression in LSK cells from cohesin knockdown mice. Indicated are FPKM values for MPO, FCGR3, and CD74 as obtained from RNA sequencing in LSK cells for the indicated genotypes (*, P < 0.05). (E) RNA expression correlates with chromatin accessibility. Changes in RNA expression (RNA sequencing) of genes that have either increased (Up) or decreased (Down) chromatin accessibility (ATAC-sequencing) at their promoter are plotted (*, P < 0.05). (F) GSEA of Stag2 knockdown enriched ATAC-seq peaks. (G) GO term enrichment of biological processes with peaks (FC(abs) > 2, P < 0.05) that are unique in the Stag2(shRNA/+) ATAC-seq. (H) Result from transcription factor motif enrichment in peaks (FC(abs) > 2, P < 0.05) unique in the Stag2(shRNA/+) ATAC-seq. Error bars indicate SD.
Figure 9.
Figure 9.
MPNs in aged Smc1a(shRNA/+) mice. (A) FACS analysis of peripheral blood of age-matched Renilla(shRNA/+) control and Smc1a(shRNA/+) mouse (antibodies are indicated). (B) Histological analysis of peripheral blood, spleen, and bone marrow from Smc1a(shRNA/+) mouse. Peripheral blood was stained with Wright-Giemsa. Spleen and bone marrow were stained with H&E. (C) Representative spleen of aged Smc1a(shRNA/+) mouse. (D) Representative femur and tibia of aged Smc1a(shRNA/+) mouse. (E) Blood count of diseased Smc1a(shRNA/+) mice. WBC, white blood cells; NE, neutrophils; LY, lymphocytes; and MO, monocytes (*, P < 0.05). (F and G) FACS analysis of bone marrow and spleen of representative aged Smc1a(shRNA/+) mice. (left) GFP expression. (middle) Antibody staining for myeloid (Cd11b+/Gr1+), B (B220+), T (CD3+), and erythroid cells (CD71+/Ter119+ and Ter119+) is indicated. (right) FACS staining for myeloid progenitors (GFP+/Lin/c-Kit+/Sca1) is plotted. Error bars indicate SD.
Figure 10.
Figure 10.
MPNs and splenomegaly in Smc1a-Stag2 shRNA compound animals. (A) qRT-PCR of sorted erythroblasts (GFP+/CD71+/Ter119+) from the bone marrow of Smc1a(shRNA)/Stag2(shRNA) mice (n = 3) exposed to doxycycline for 22 d. (B) Changes in absolute numbers of white blood cells of Smc1a(shRNA)/Stag2(shRNA) mice (n = 5) exposed to doxycycline for 22 d. Blood was analyzed by Hemavet. WBC, white blood cells; NE, neutrophils; LY, lymphocytes; MO, monocytes; and EO, eosinophils (*, P < 0.05). (C) Quantification of FACS analysis of Renilla(shRNA/+) (n = 8) and Smc1a(shRNA)/Stag2(shRNA) (n = 16) mice for the indicated antibodies (*, P < 0.05). (D) Representative spleens of Smc1a(shRNA)/Stag2(shRNA) animals after doxycycline exposure for 2–3 mo. Spleen weight is indicated below the organs. (E) H&E stain of a representative section of spleen of Renilla(shRNA/+) and Smc1a(shRNA)/Stag2(shRNA) animals treated with docycycline for 2 mo. (F) Blood counts of Smc1a(shRNA)/Stag2(shRNA) mice (n = 3) on doxycycline for 2–3 mo (*, P < 0.05). Error bars indicate SD.

References

    1. Anders S., and Huber W.. 2010. Differential expression analysis for sequence count data. Genome Biol. 11:R106 10.1186/gb-2010-11-10-r106 - DOI - PMC - PubMed
    1. Anders S., Pyl P.T., and Huber W.. 2015. HTSeq—a Python framework to work with high-throughput sequencing data. Bioinformatics. 31:166–169. 10.1093/bioinformatics/btu638 - DOI - PMC - PubMed
    1. Balbás-Martínez C., Sagrera A., Carrillo-de-Santa-Pau E., Earl J., Márquez M., Vazquez M., Lapi E., Castro-Giner F., Beltran S., Bayés M., et al. 2013. Recurrent inactivation of STAG2 in bladder cancer is not associated with aneuploidy. Nat. Genet. 45:1464–1469. 10.1038/ng.2799 - DOI - PMC - PubMed
    1. Bolden J.E., Tasdemir N., Dow L.E., van Es J.H., Wilkinson J.E., Zhao Z., Clevers H., and Lowe S.W.. 2014. Inducible in vivo silencing of Brd4 identifies potential toxicities of sustained BET protein inhibition. Cell Reports. 8:1919–1929. 10.1016/j.celrep.2014.08.025 - DOI - PMC - PubMed
    1. Buenrostro J.D., Wu B., Chang H.Y., and Greenleaf W.J.. 2015. ATAC-seq: A method for assaying chromatin accessibility genome-wide. Curr. Protoc. Mol. Biol. 109:1–9. 10.1002/0471142727.mb2129s109 - DOI - PMC - PubMed

Publication types