

Profiling of somatic mutations in acute myeloid leukemia with FLT3-ITD at diagnosis and relapse
- PMID: 26438511
- PMCID: PMC4661172
- DOI: 10.1182/blood-2015-05-646240
Profiling of somatic mutations in acute myeloid leukemia with FLT3-ITD at diagnosis and relapse
Abstract
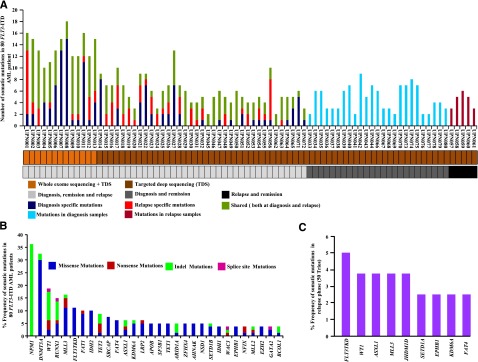
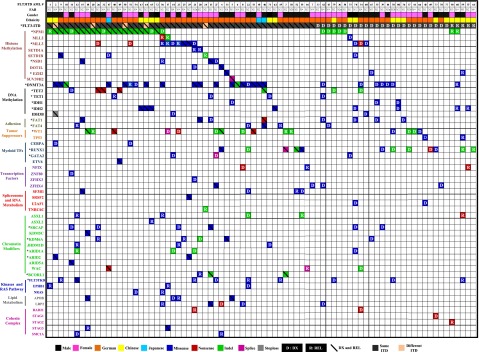
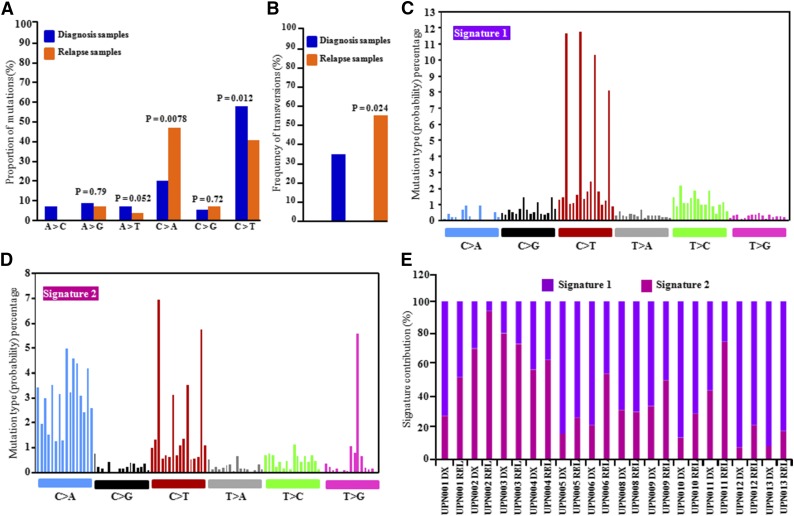
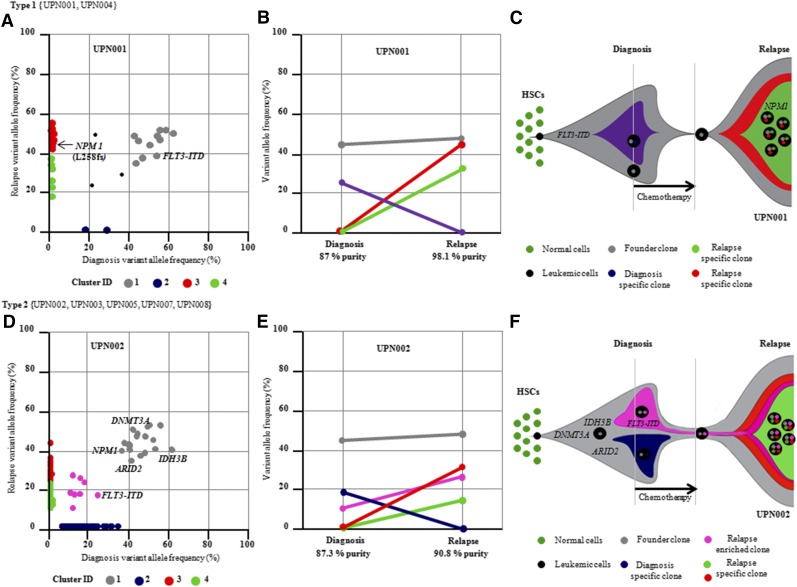
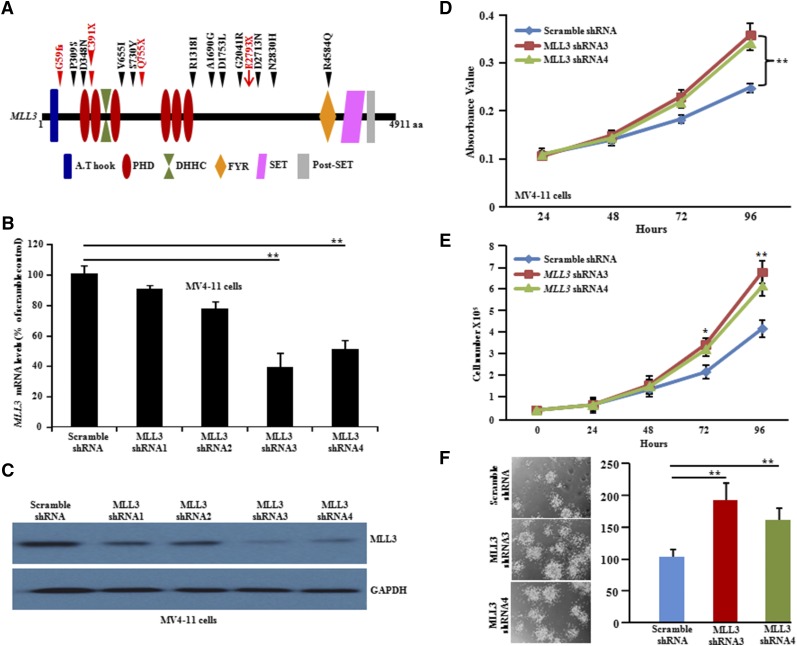
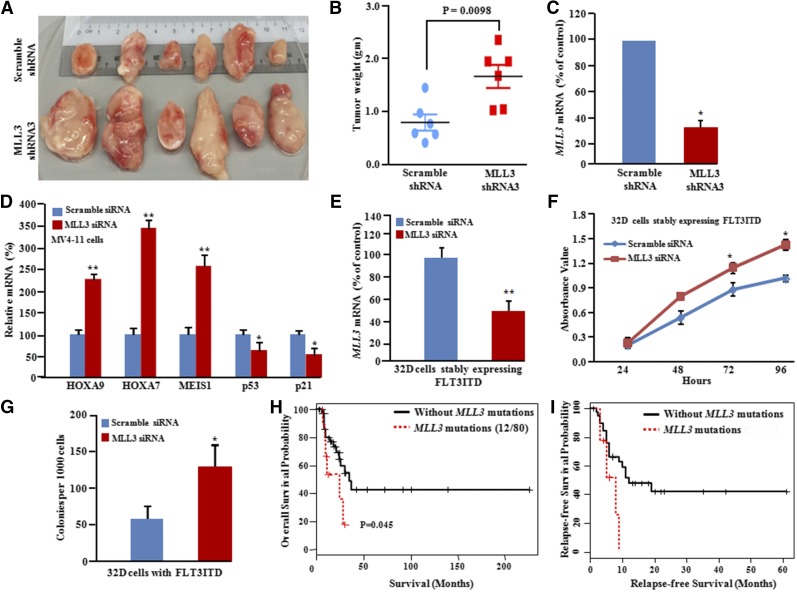
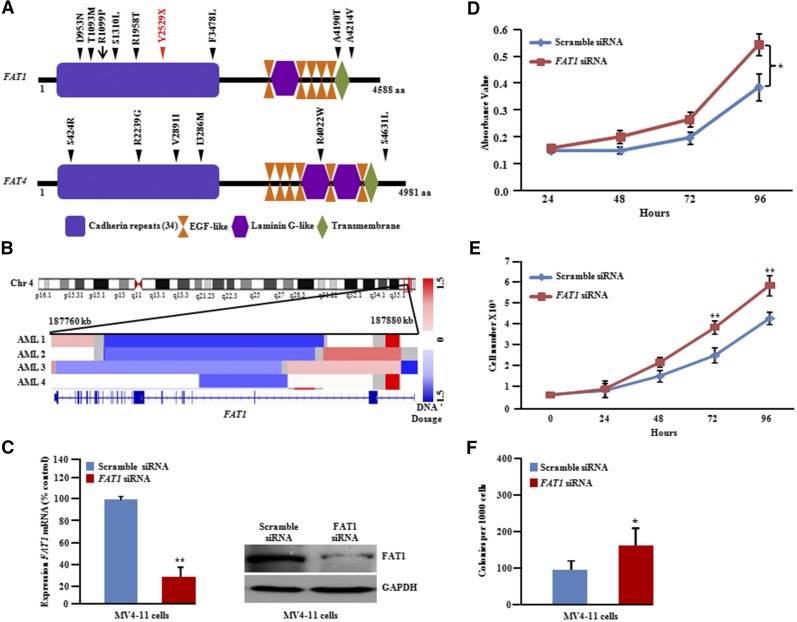
Acute myeloid leukemia (AML) with an FLT3 internal tandem duplication (FLT3-ITD) mutation is an aggressive hematologic malignancy with a grave prognosis. To identify the mutational spectrum associated with relapse, whole-exome sequencing was performed on 13 matched diagnosis, relapse, and remission trios followed by targeted sequencing of 299 genes in 67 FLT3-ITD patients. The FLT3-ITD genome has an average of 13 mutations per sample, similar to other AML subtypes, which is a low mutation rate compared with that in solid tumors. Recurrent mutations occur in genes related to DNA methylation, chromatin, histone methylation, myeloid transcription factors, signaling, adhesion, cohesin complex, and the spliceosome. Their pattern of mutual exclusivity and cooperation among mutated genes suggests that these genes have a strong biological relationship. In addition, we identified mutations in previously unappreciated genes such as MLL3, NSD1, FAT1, FAT4, and IDH3B. Mutations in 9 genes were observed in the relapse-specific phase. DNMT3A mutations are the most stable mutations, and this DNMT3A-transformed clone can be present even in morphologic complete remissions. Of note, all AML matched trio samples shared at least 1 genomic alteration at diagnosis and relapse, suggesting common ancestral clones. Two types of clonal evolution occur at relapse: either the founder clone recurs or a subclone of the founder clone escapes from induction chemotherapy and expands at relapse by acquiring new mutations. Relapse-specific mutations displayed an increase in transversions. Functional assays demonstrated that both MLL3 and FAT1 exert tumor-suppressor activity in the FLT3-ITD subtype. An inhibitor of XPO1 synergized with standard AML induction chemotherapy to inhibit FLT3-ITD growth. This study clearly shows that FLT3-ITD AML requires additional driver genetic alterations in addition to FLT3-ITD alone.
© 2015 by The American Society of Hematology.
Figures
Similar articles
-
Identification of emerging FLT3 ITD-positive clones during clinical remission and kinetics of disease relapse in acute myeloid leukaemia with mutated nucleophosmin.Br J Haematol. 2013 May;161(4):533-40. doi: 10.1111/bjh.12288. Epub 2013 Mar 11. Br J Haematol. 2013. PMID: 23480665
-
Activating internal tandem duplication mutations of the fms-like tyrosine kinase-3 (FLT3-ITD) at complete response and relapse in patients with acute myeloid leukemia.Haematologica. 2012 Aug;97(8):1242-5. doi: 10.3324/haematol.2012.062638. Epub 2012 Apr 24. Haematologica. 2012. PMID: 22532519 Free PMC article.
-
Clinical Effect of Combined Mutations in DNMT3A, FLT3-ITD, and NPM1 Among Egyptian Acute Myeloid Leukemia Patients.Clin Lymphoma Myeloma Leuk. 2019 Jun;19(6):e281-e290. doi: 10.1016/j.clml.2019.02.001. Epub 2019 Feb 14. Clin Lymphoma Myeloma Leuk. 2019. PMID: 30926392
-
Emerging DNA Methylome Targets in FLT3-ITD-Positive Acute Myeloid Leukemia: Combination Therapy with Clinically Approved FLT3 Inhibitors.Curr Treat Options Oncol. 2024 Jun;25(6):719-751. doi: 10.1007/s11864-024-01202-7. Epub 2024 May 2. Curr Treat Options Oncol. 2024. PMID: 38696033 Free PMC article. Review.
-
Targeting FLT3 mutations in AML: review of current knowledge and evidence.Leukemia. 2019 Feb;33(2):299-312. doi: 10.1038/s41375-018-0357-9. Epub 2019 Jan 16. Leukemia. 2019. PMID: 30651634 Free PMC article. Review.
Cited by
-
Molecular Features and Treatment Paradigms of Acute Myeloid Leukemia.Biomedicines. 2024 Aug 6;12(8):1768. doi: 10.3390/biomedicines12081768. Biomedicines. 2024. PMID: 39200232 Free PMC article. Review.
-
Mutational interactions define novel cancer subgroups.Nat Commun. 2018 Oct 19;9(1):4353. doi: 10.1038/s41467-018-06867-x. Nat Commun. 2018. PMID: 30341300 Free PMC article.
-
Epigenetic Alterations and Inflammation as Emerging Use for the Advancement of Treatment in Non-Small Cell Lung Cancer.Front Immunol. 2022 Apr 20;13:878740. doi: 10.3389/fimmu.2022.878740. eCollection 2022. Front Immunol. 2022. PMID: 35514980 Free PMC article. Review.
-
Mutant p53 enhances leukemia-initiating cell self-renewal to promote leukemia development.Leukemia. 2019 Jun;33(6):1535-1539. doi: 10.1038/s41375-019-0377-0. Epub 2019 Jan 23. Leukemia. 2019. PMID: 30675010 Free PMC article. No abstract available.
-
UBE2C promotes the proliferation of acute myeloid leukemia cells through PI3K/AKT activation.BMC Cancer. 2024 Apr 18;24(1):497. doi: 10.1186/s12885-024-12212-x. BMC Cancer. 2024. PMID: 38637730 Free PMC article.
References
-
- Estey E, Döhner H. Acute myeloid leukaemia. Lancet. 2006;368(9550):1894–1907. - PubMed
-
- Fröhling S, Scholl C, Levine RL, et al. Identification of driver and passenger mutations of FLT3 by high-throughput DNA sequence analysis and functional assessment of candidate alleles. Cancer Cell. 2007;12(6):501–513. - PubMed
-
- Stirewalt DL, Radich JP. The role of FLT3 in haematopoietic malignancies. Nat Rev Cancer. 2003;3(9):650–665. - PubMed
-
- Levis M, Small D. FLT3: ITDoes matter in leukemia. Leukemia. 2003;17(9):1738–1752. - PubMed
Publication types
MeSH terms
Substances
Grants and funding
LinkOut - more resources
Full Text Sources
Other Literature Sources
Medical
Miscellaneous
