. 2015 Dec;169(4):2684-99.
doi: 10.1104/pp.15.00769. Epub 2015 Oct 5.

A Conserved Core of Programmed Cell Death Indicator Genes Discriminates Developmentally and Environmentally Induced Programmed Cell Death in Plants

Affiliations

A Conserved Core of Programmed Cell Death Indicator Genes Discriminates Developmentally and Environmentally Induced Programmed Cell Death in Plants

Yadira Olvera-Carrillo et al. Plant Physiol. 2015 Dec.

Abstract

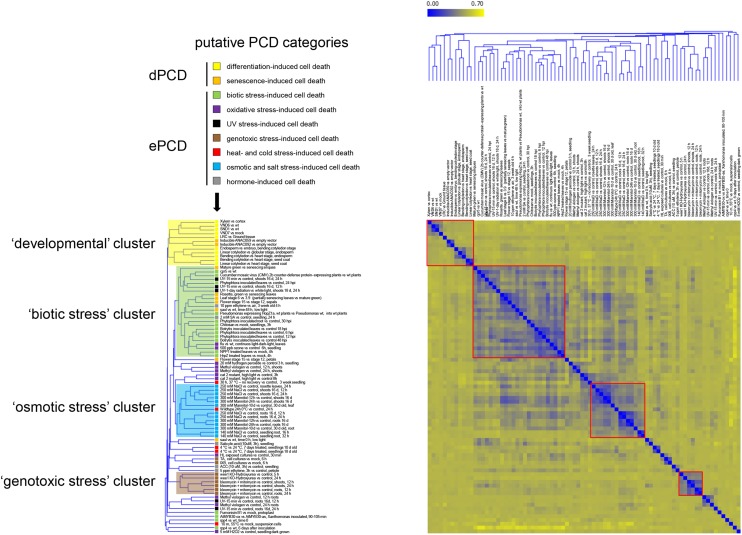
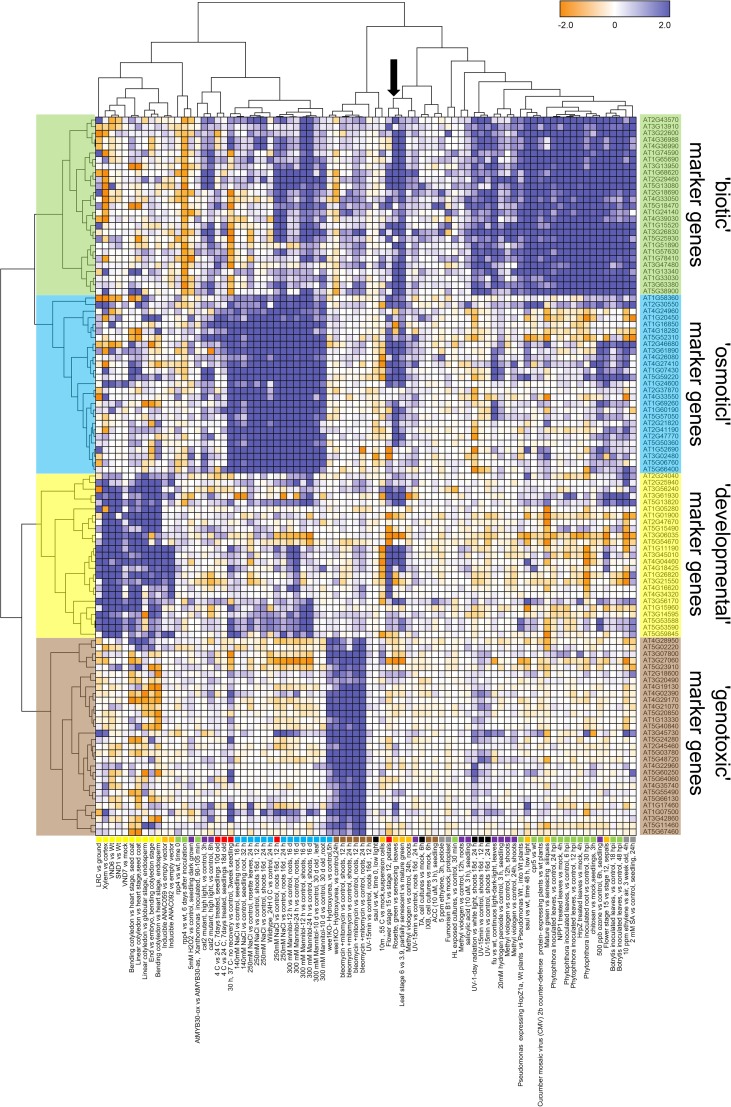
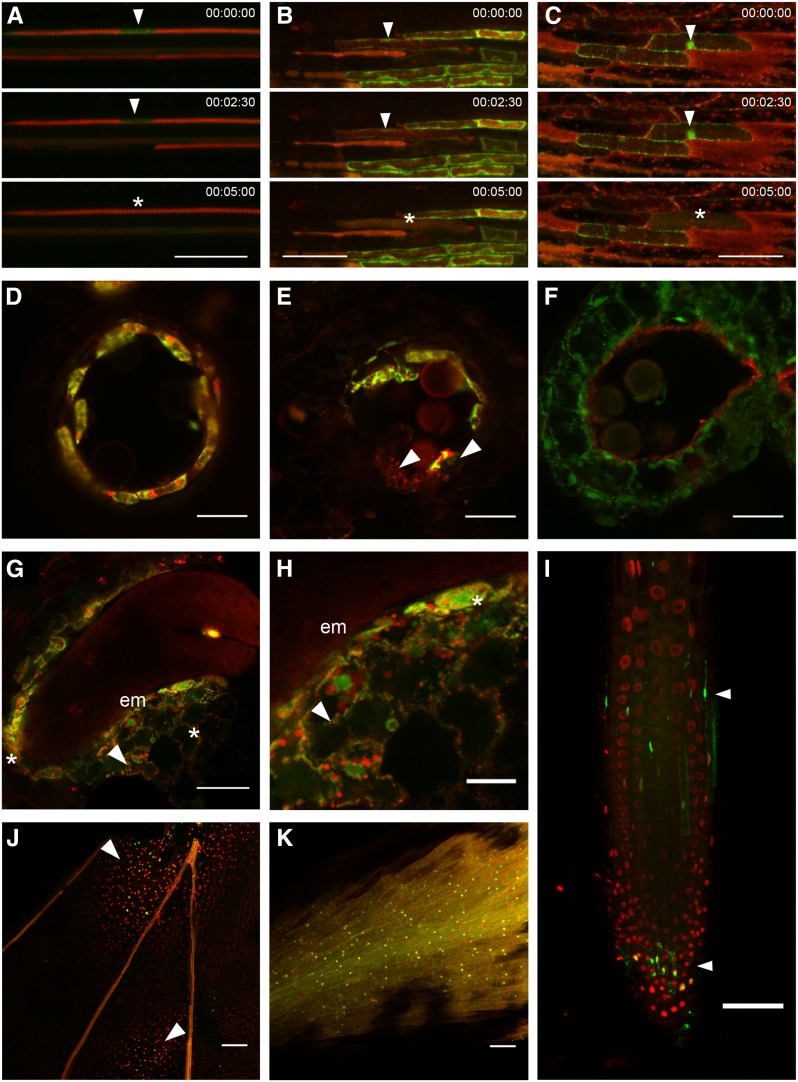
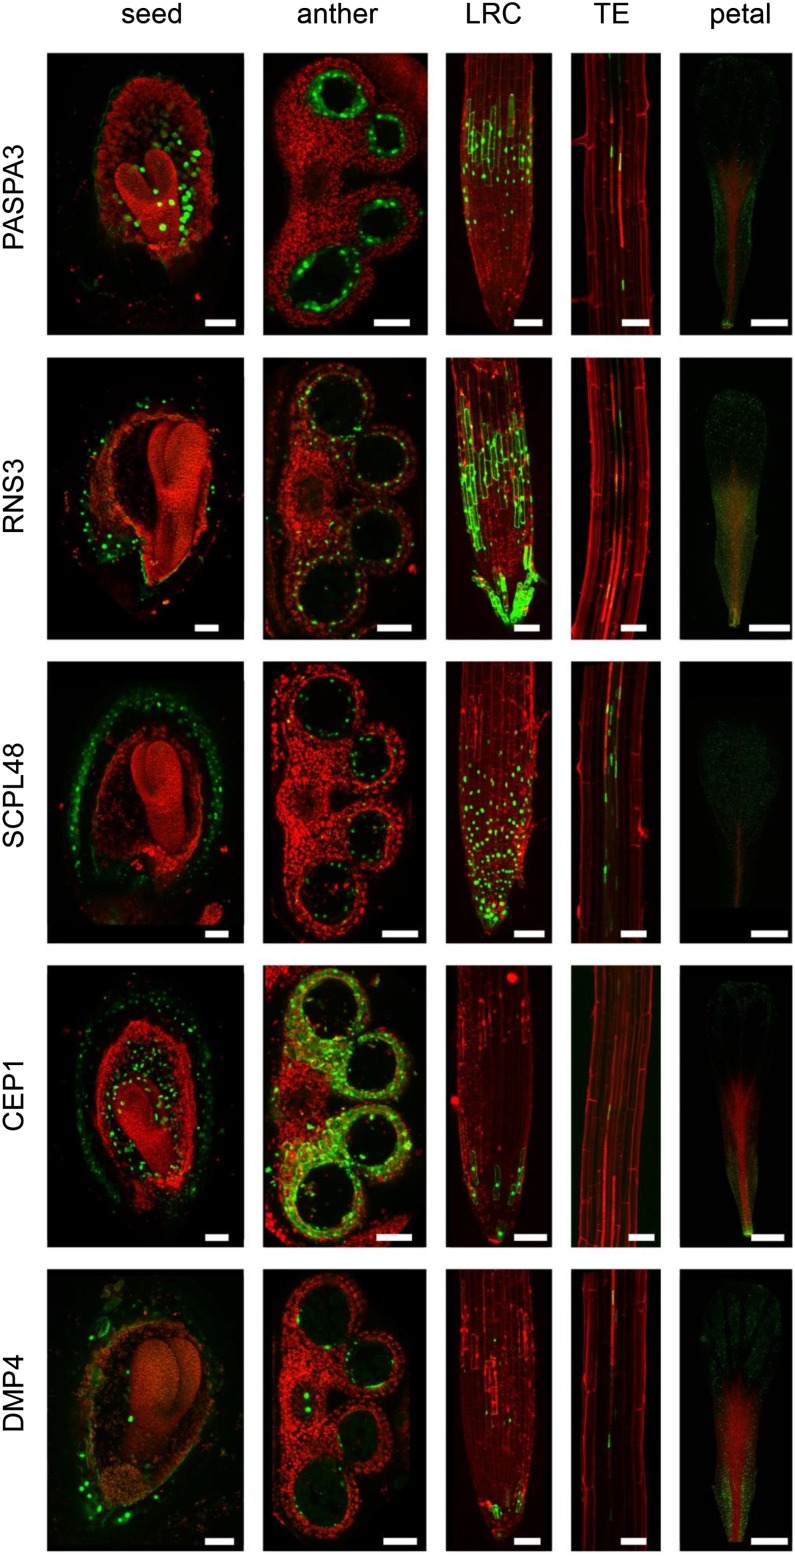
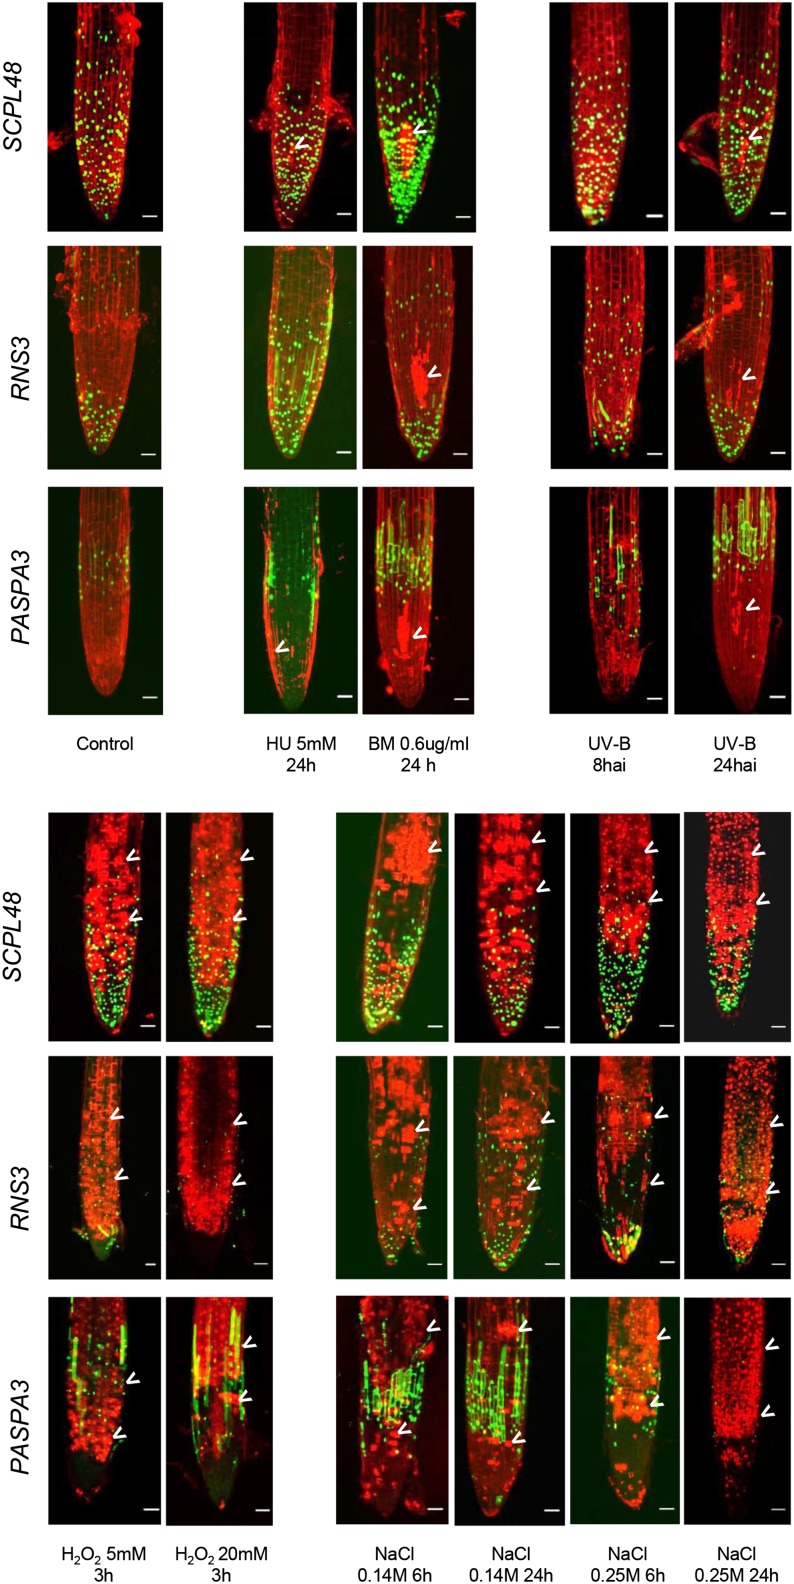
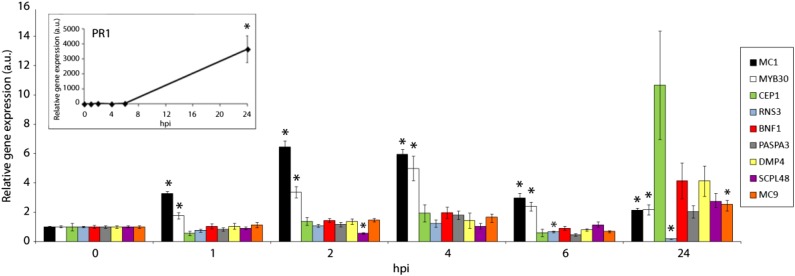
A plethora of diverse programmed cell death (PCD) processes has been described in living organisms. In animals and plants, different forms of PCD play crucial roles in development, immunity, and responses to the environment. While the molecular control of some animal PCD forms such as apoptosis is known in great detail, we still know comparatively little about the regulation of the diverse types of plant PCD. In part, this deficiency in molecular understanding is caused by the lack of reliable reporters to detect PCD processes. Here, we addressed this issue by using a combination of bioinformatics approaches to identify commonly regulated genes during diverse plant PCD processes in Arabidopsis (Arabidopsis thaliana). Our results indicate that the transcriptional signatures of developmentally controlled cell death are largely distinct from the ones associated with environmentally induced cell death. Moreover, different cases of developmental PCD share a set of cell death-associated genes. Most of these genes are evolutionary conserved within the green plant lineage, arguing for an evolutionary conserved core machinery of developmental PCD. Based on this information, we established an array of specific promoter-reporter lines for developmental PCD in Arabidopsis. These PCD indicators represent a powerful resource that can be used in addition to established morphological and biochemical methods to detect and analyze PCD processes in vivo and in planta.


Figures

Figure 1.
Figure 1.
PCD-associated ATH1 transcriptome data sets group in distinct clusters. HCA showing the clustering of 82 putative dPCD and ePCD conditions based on the log-fold expression values of differentially regulated genes and indicating their affiliation to different putative PCD categories (arrow). Four clusters are highlighted indicating the relatedness of data sets falling in the developmental, the biotic stress, the osmotic stress, and the genotoxic stress clusters. The color coding from blue to yellow indicates an increase in the Pearson’s correlation distance.
Figure 2.
Figure 2.
Commonly up-regulated genes within PCD clusters are largely distinct between clusters. Two-dimensional clustering of the gene-condition matrix plotting the expression profiles of the most commonly regulated genes of the four clusters highlighted in Figure 1 over all conditions. The separate blocks of dark blue fields indicate that the regulation of commonly expressed marker genes is largely distinct for each cluster. The arrow indicates a cluster of senescence-related data sets that show up-regulation of biotic, osmotic, and developmental marker genes.
Figure 3.
Figure 3.
Cell death processes occur in different developmental contexts. A ToIM combines expression of a free GFP accumulating in the cytoplasm and the nucleus (green) and of a vacuolar-localized tagRFP (a monomeric derivative of a red fluorescent protein from Entacmaea quadricolor; red). Vacuolar rupture is indicated by the loss of compartmentalization and the merging of the two fluorescent signals. Note that in some dPCD cases, cytoplasmic acidification dampens the GFP signal, making the tagRFP signal more prominent. The ToIM is expressed under the control of the pPASPA3 promoter. A, Time lapse imaging of dPCD in a protoxylem element. The arrowheads indicate the cytoplasm around the cell’s nucleus, which is invaded by tagRFP upon vacuolar rupture (asterisk). B, Time lapse imaging of dPCD in a root cap cell. The arrowheads indicate the cell with intact vacuole, while the asterisk marks the cell once vacuolar rupture has occurred. C, Time lapse imaging of dPCD in petal cells at the base of a petal. The arrowheads indicate the cell with intact vacuole, while the asterisk marks the cell once vacuolar rupture has occurred. D to F, Vibratome sections through developing anthers around the time point of tapetum dPCD. D shows a locule lined by pPASPA3::ToIM-expressing, viable tapetum cells. E shows a locule in which dPCD is ongoing; the arrowheads point at partly degenerated cells. F shows a locule after tapetum dPCD in which degraded remains of tapetum cells line the inside of the locule. G and H, Vibratome sections through a seed in the walking stick state of embryo (em) development. H is a detail of G. Arrowheads point at ToIM-expressing but intact endosperm cells, while the asterisks indicate cells in the process of degeneration. I to K, TUNEL of whole-mount petals and root tips. 4′,6-diamidino-2-phenylindole (DAPI) staining is shown in red, and TUNEL signal is shown in green. I, Arrowheads indicate dying or dead TUNEL-positive root cap cells. J, Arrowheads indicate two fields of TUNEL-positive petal cells. K, TUNEL-positive control treated with DNase to induce tissue-wide DNA fragmentation, showing the overlap of TUNEL and DAPI signals. In A to C, time is indicated in minutes. Bars = 50 µm (A–C, G, and I–K) and 20 µm (D–F and H).
Figure 4.
Figure 4.
Selected promoter-reporter lines highlighting cells preparing for dPCD. PASPA3, RNS3, SCPL48, CEP1, and DMP4 expression patterns in developing seeds, developing anthers, the root cap, the xylem, and senescing petals (columns from left to right). pPASPA3 >>H2A-GFP is expressed in the embryo-surrounding region of the endosperm from torpedo stage onwards in the tapetum layer of the anther, in the LRC and the xylem, and in mature petals nearing floral organ senescence. pRNS3 >>H2A-GFP shows a very similar pattern. The SCPL48 promoter confers a broader spatial and temporal expression pattern and is not only restricted to cells preparing for dPCD. pCEP1 >>H2A-GFP shows GFP expression in the endosperm and seed coat of developing seeds, the tapetum and its surrounding anther tissues, cells from the lowest tier of the LRC, differentiating xylem vessels, and the aging petals. pDMP4 >>H2A-GFP is again more similar in expression to pPASPA3 and pRNS3. TE, Tracheary elements. Bar = 50 µm.
Figure 5.
Figure 5.
Abiotic stress treatments cause cell death without the up-regulation of dPCD reporters. Abiotic stress treatments applied to 5-d-old seedlings from dPCD markers SCPL48, RNS3, and PASPA3. Pictures were taken after the indicated time points and treatments at the root tip to show the expression around the LRC and were stained with PI to highlight the cell walls and cells with compromised plasma membrane integrity indicative of cell death (arrowheads). BM, Bleomycin; HU, hydroxyurea.
Figure 6.
Figure 6.
dPCD marker genes are not up-regulated during HR PCD. qRT-PCR of Col-0 wild-type plants inoculated with an avirulent HR-inducing P. syringae strain in a time course experiment after infection. Relative expression of the indicated genes both in the inoculated area and in noninoculated tissue was determined by qRT-PCR at the indicated time points. PATHOGENESIS RELATED1 (PR1), MC1, and MYB DOMAIN PROTEIN30 (MYB30) were used as HR marker genes. Expression values were normalized using the SAND family gene as internal standard. Ratios of the expression values for each gene in the inoculated zone with respect to the noninoculated area are presented for each time point. Mean and se of the mean values were calculated from three independent experiments with three replicates. Statistical significance according to a Student’s t test P value of 0.005 is indicated by asterisks. hpi, Hours after inoculation; a.u., arbitrary units.

References

    1. Appelqvist H, Johansson AC, Linderoth E, Johansson U, Antonsson B, Steinfeld R, Kågedal K, Öllinger K (2012) Lysosome-mediated apoptosis is associated with cathepsin D-specific processing of Bid at Phe24, Trp48, and Phe183. Ann Clin Lab Sci 42: 231–242 - PubMed
    1. Bariola PA, Howard CJ, Taylor CB, Verburg MT, Jaglan VD, Green PJ (1994) The Arabidopsis ribonuclease gene RNS1 is tightly controlled in response to phosphate limitation. Plant J 6: 673–685 - PubMed
    1. Bayles KW. (2014) Bacterial programmed cell death: making sense of a paradox. Nat Rev Microbiol 12: 63–69 - PMC - PubMed
    1. Benhamed M, Martin-Magniette ML, Taconnat L, Bitton F, Servet C, De Clercq R, De Meyer B, Buysschaert C, Rombauts S, Villarroel R, et al. (2008) Genome-scale Arabidopsis promoter array identifies targets of the histone acetyltransferase GCN5. Plant J 56: 493–504 - PubMed
    1. Bollhöner B, Prestele J, Tuominen H (2012) Xylem cell death: emerging understanding of regulation and function. J Exp Bot 63: 1081–1094 - PubMed

Publication types

MeSH terms

LinkOut - more resources