. 2015 Nov 27;290(48):28915-31.
doi: 10.1074/jbc.M115.668244. Epub 2015 Oct 5.

p21-activated Kinases (PAKs) Mediate the Phosphorylation of PREX2 Protein to Initiate Feedback Inhibition of Rac1 GTPase

Affiliations

p21-activated Kinases (PAKs) Mediate the Phosphorylation of PREX2 Protein to Initiate Feedback Inhibition of Rac1 GTPase

Douglas Barrows et al. J Biol Chem. .

Abstract

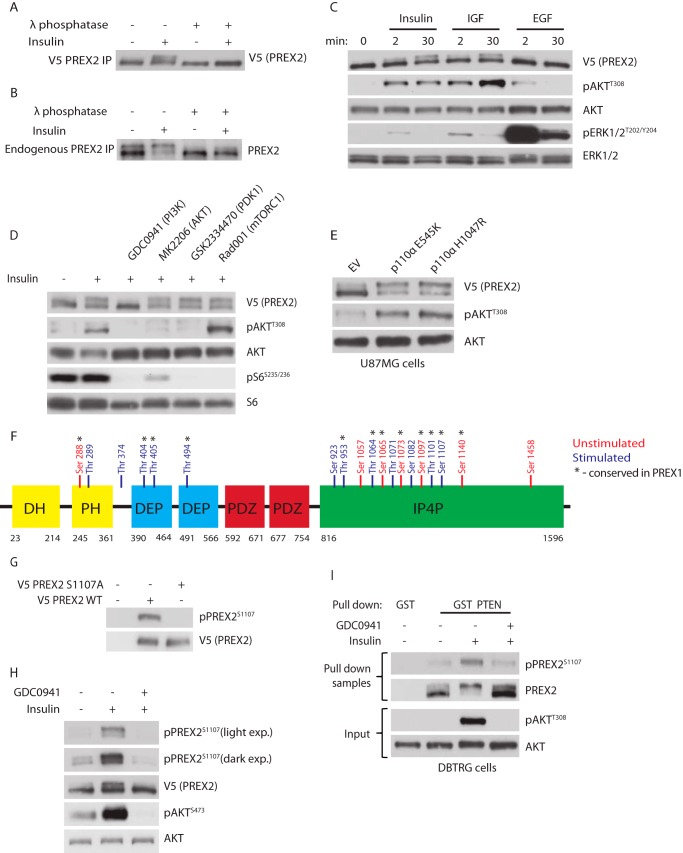
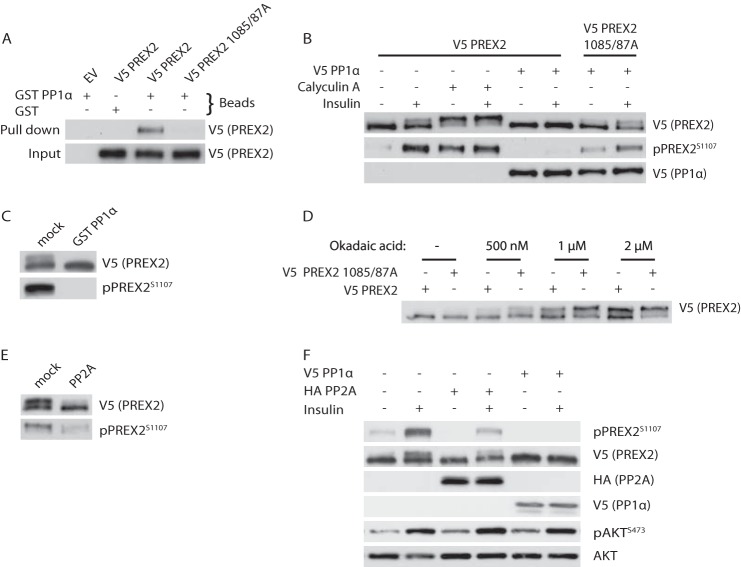
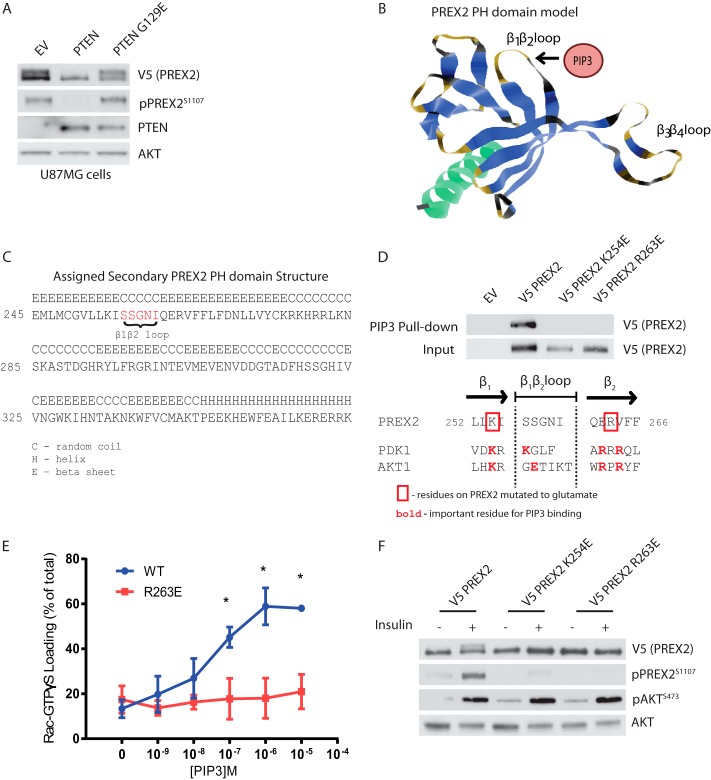
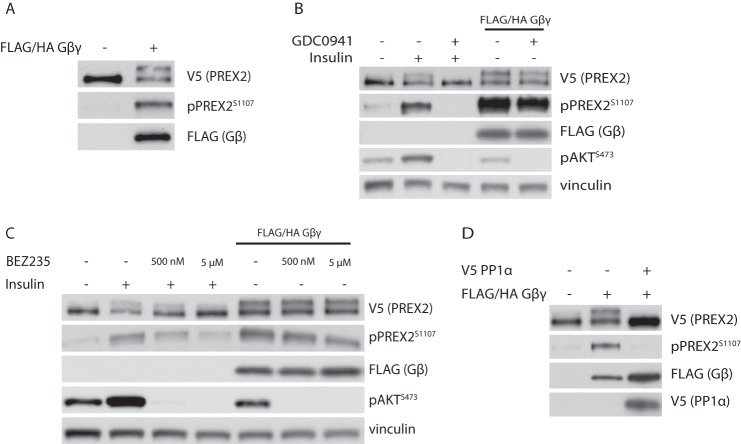
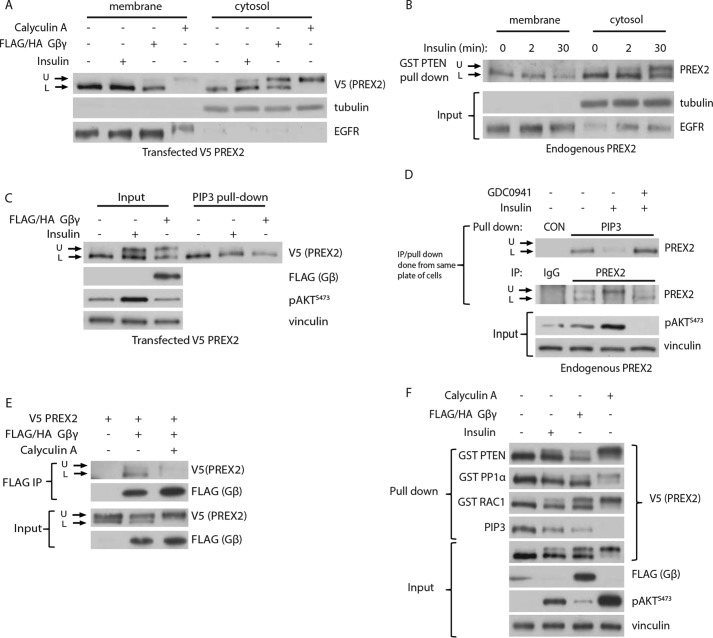
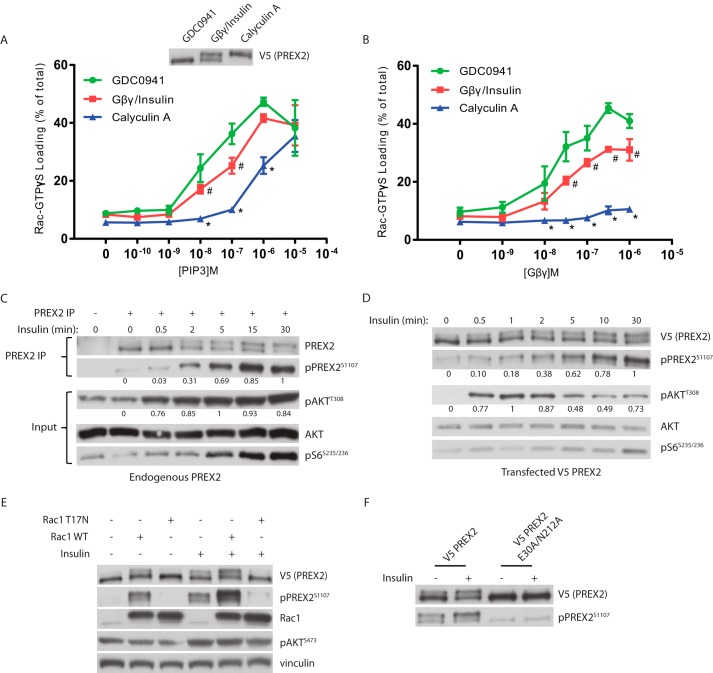
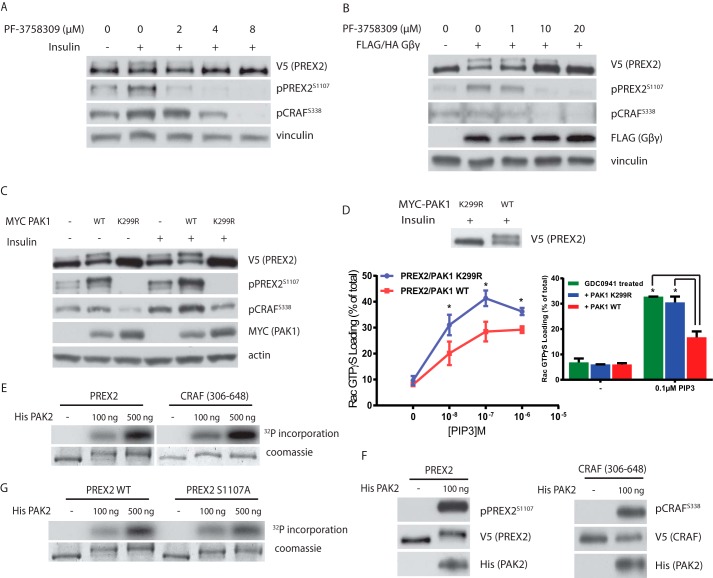
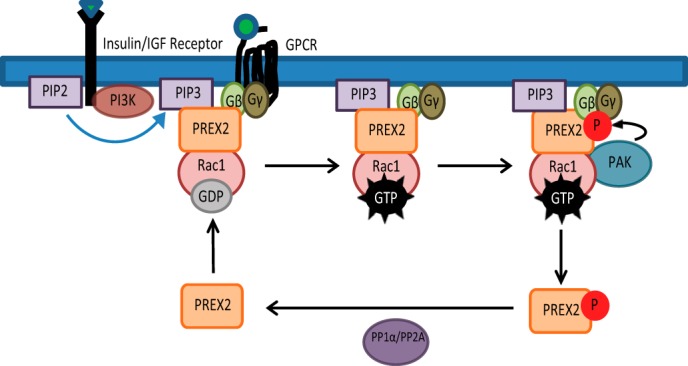
Phosphatidylinositol 3,4,5-trisphosphate (PIP3)-dependent Rac exchanger 2 (PREX2) is a guanine nucleotide exchange factor (GEF) for the Ras-related C3 botulinum toxin substrate 1 (Rac1) GTPase, facilitating the exchange of GDP for GTP on Rac1. GTP-bound Rac1 then activates its downstream effectors, including p21-activated kinases (PAKs). PREX2 and Rac1 are frequently mutated in cancer and have key roles within the insulin-signaling pathway. Rac1 can be inactivated by multiple mechanisms; however, negative regulation by insulin is not well understood. Here, we show that in response to being activated after insulin stimulation, Rac1 initiates its own inactivation by decreasing PREX2 GEF activity. Following PREX2-mediated activation of Rac1 by the second messengers PIP3 or Gβγ, we found that PREX2 was phosphorylated through a PAK-dependent mechanism. PAK-mediated phosphorylation of PREX2 reduced GEF activity toward Rac1 by inhibiting PREX2 binding to PIP3 and Gβγ. Cell fractionation experiments also revealed that phosphorylation prevented PREX2 from localizing to the cellular membrane. Furthermore, the onset of insulin-induced phosphorylation of PREX2 was delayed compared with AKT. Altogether, we propose that second messengers activate the Rac1 signal, which sets in motion a cascade whereby PAKs phosphorylate and negatively regulate PREX2 to decrease Rac1 activation. This type of regulation would allow for transient activation of the PREX2-Rac1 signal and may be relevant in multiple physiological processes, including diseases such as diabetes and cancer when insulin signaling is chronically activated.

Keywords: G-protein-coupled receptor (GPCR); Phosphatidylinositol-3,4,5-trisphosphate-dependent RAC exchanger 2 (PREX2); Rac (Rac GTPase); guanine nucleotide exchange factor (GEF); insulin; phosphatidylinositide 3-kinase (PI 3-kinase); serine/threonine-protein kinase PAK 1 (PAK1); signal transduction.


Figures

FIGURE 1.
FIGURE 1.
Insulin and PI3K induce phosphorylation of PREX2. A, Western blot analysis of V5 PREX2 that was isolated from starved or insulin-treated (5 μg/ml for 30 min) HEK293 cells and then treated with λ-phosphatase. B, Western blot analysis of PREX2 that was immunoprecipitated from starved or insulin-treated HEK293 cell lysates and then treated with λ-phosphatase. C, Western blot analysis of V5 PREX2-expressing HEK293 cells, which were starved and treated with insulin, 50 ng/ml IGF, or 50 ng/ml EGF for the indicated times. D, Western blot analysis of V5 PREX2-expressing HEK293 cells, which were starved and treated with DMSO or 500 nm GDC0941 (PI3Ki), 500 nm MK2206 (AKTi), 5 μm GSK2334470 (PDK1i), or 20 nm Rad001 (mTORC1i) followed by treatment with insulin. E, Western blot analysis of starved V5 PREX2-, p110α E545K-, or H1047R-expressing U87MG cells. EV, empty vector. F, mass spectrometry analysis was performed on V5 PREX2 isolated from HEK293 cells that were unstimulated (starved and treated with 500 nm GDC0941) or stimulated (insulin alone or combined with 100 nm calyculin A). Residues in blue are those only identified in one of the stimulated conditions. G, Western blot analysis of HEK293 cells expressing either V5 PREX2 WT or S1107A. H, Western blot analysis of V5 PREX2-expressing HEK293 cells that were starved and then treated with DMSO or 500 nm GDC0941 followed by treatment with insulin. I, Western blot analysis using indicated anti-PREX2 antibodies of GST or GST PTEN pulldowns from DBTRG cells that were starved and then treated with DMSO or 500 nm GDC0941 followed by insulin treatment. Antibodies used for Western analysis are indicated to the right of each panel. Phospho-specific antibodies to AKT (Thr-308 and Ser-473), ERK1/2 (Thr-202/Tyr-204), S6 (Ser-235/Ser-236), and PREX2 (Ser-1107) were used to detect alterations downstream of receptor tyrosine kinase ligands, small molecule inhibitors, and PI3K activation.
FIGURE 2.
FIGURE 2.
PREX2 is dephosphorylated by PP1α and PP2A. A, Western blot analysis of GST or GST PP1α pulldowns from HEK293 cells expressing either V5 PREX2 WT or 1085/87A. EV, empty vector. B, Western blot analysis of HEK293 cells expressing V5 PREX2 WT or 1085/87A with or without co-expression of V5 PP1α. Cells were starved and then treated with DMSO or 100 nm calyculin A, followed by treatment with insulin. C, ability of GST PP1α to dephosphorylate V5 PREX2 isolated from HEK293 cells was assessed and analyzed by Western blot. D, Western blot analysis of starved V5 PREX2 WT or 1085/87A-expressing HEK293 cells that were treated with the indicated concentrations of okadaic acid for 30 min. E, ability of purified PP2A to dephosphorylate V5 PREX2 isolated from HEK293 cells was assessed and analyzed by Western blot. F, Western blot analysis of HEK293 cells expressing V5 PREX2 with or without co-expression of V5 PP1α or HA PP2A (catalytic subunit). Cells were starved and then treated with insulin.
FIGURE 3.
FIGURE 3.
Phosphorylation of PREX2 downstream of insulin requires PIP3 binding. A, Western blot analysis of U87MG cells expressing V5 PREX2 and either PTEN WT or the lipid phosphatase dead mutant PTEN G129E. EV, empty vector. B, ribbon diagram of the PREX2 PH domain model with the putative PIP3 binding region identified. C, predicted secondary structures of the PREX2 PH domain from model. D, top, Western blot analysis of PIP3 pulldowns from HEK293 cells expressing either V5 PREX2 WT, K254E, or R263E. Bottom, diagram showing the β1β2 loop region of the PREX2 PH domain model aligned with the same region on PDK1 and AKT1. E, V5 PREX2 WT or R263E was purified from HEK293 cell lysates, and the ability of increasing doses of PIP3 to stimulate PREX2 GEF activity toward GST Rac1 was assessed in an in vitro GEF assay. Data are mean ± S.D. for at least two experiments with samples done in duplicate at each PIP3 concentration, and * represents p < 0.001 by t test. F, Western blot analysis of starved or insulin-treated HEK293 cells expressing V5 PREX2 WT, K254E, or R263E.
FIGURE 4.
FIGURE 4.
Gβγ stimulates phosphorylation of PREX2. A, Western blot analysis of starved HEK293 cells where V5 PREX2 was expressed with or without FLAG/HA Gβγ. B, Western blot analysis of HEK293 cells where V5 PREX2 was expressed with or without FLAG/HA Gβγ. Cells were then starved and treated with DMSO or 500 nm GDC0941 followed by treatment with insulin. C, Western blot analysis of HEK293 cells where V5 PREX2 was expressed with or without FLAG/HA Gβγ. Cells were then starved and treated with DMSO or either 500 nm or 5 μm BEZ235 followed by treatment with insulin. D, Western blot analysis of starved HEK293 cells expressing V5 PREX2 with FLAG/HA Gβγ and V5 PP1α.
FIGURE 5.
FIGURE 5.
Phosphorylation of PREX2 prevents binding to the membrane, PIP3, and Gβγ. A, Western blot analysis of cytosolic and membrane fractions from starved or insulin-treated HEK293 cells expressing V5 PREX2 with or without co-expression of FLAG/HA Gβγ. B, Western blot analysis of GST PTEN pulldowns of endogenous PREX2 from cytosolic and membrane fractions of HEK293 cells. Cells were starved and then treated with insulin for indicated times. C, Western blot analysis of PIP3 pulldowns from starved or insulin-treated HEK293 cells expressing V5 PREX2 with or without FLAG/HA Gβγ. D, Western blot analysis of endogenous PREX2 isolated from HEK293 cells with either PIP3 beads (top) or PREX2 antibody (bottom). Cells were starved and then treated with DMSO or 500 nm GDC0941 followed by treatment with insulin. E, Western blot analysis of FLAG immunoprecipitations from HEK293 cells co-expressing FLAG/HA Gβγ and V5 PREX2 with and without 100 nm calyculin A treatment. F, Western blot analysis of pulldowns with GST PTEN, GST PP1α, GST Rac1, or PIP3 beads from HEK293 cells expressing V5 PREX2 with or without FLAG/HA Gβγ. The cells were starved and treated with insulin or 100 nm calyculin A. U, upper band; L, lower band.
FIGURE 6.
FIGURE 6.
Phosphorylation reduces PREX2 GEF activity and is dependent on Rac1. A and B, V5 PREX2 was expressed in HEK293 cells with or without co-expression of FLAG/HA Gβγ and then was purified after being treated with either 500 nm GDC0941, insulin (with co-expression of FLAG/HA Gβγ), or 100 nm calyculin A. The ability of increasing doses of PIP3 in A or Gβγ in B to stimulate PREX2 GEF activity toward GST Rac1 was assessed in an in vitro GEF assay. Data at each PIP3 and Gβγ concentration are means ± S.D. for three experiments, and # represents p < 0.05 for GDC0941 versus Gβγ/insulin, and * represents p < 0.005 for GDC0941 versus calyculin A by t test. C, Western blot analysis of endogenous PREX2 that was immunoprecipitated (IP) from HEK293 cells that were starved and treated with insulin for the indicated times. D, Western blot analysis of V5 PREX2-expressing HEK293 cells that were starved and then treated with insulin for the indicated times. For quantification of phosphorylation in C and D, intensity of the band was normalized to total protein of that sample. The highest value was set to 1, and the remaining samples were normalized to this value. E, Western blot analysis of starved or insulin-treated HEK293 cells expressing V5 PREX2 with or without MYC Rac1 WT or the dominant negative mutant T17N. F, Western blot analysis of starved or insulin-treated HEK293 cells expressing V5 PREX2 WT or the GEF dead E30A/N212A mutant.
FIGURE 7.
FIGURE 7.
PAKs mediate the phosphorylation of PREX2. A, Western blot analysis of V5 PREX2-expressing HEK293 cells that were starved and then treated with DMSO or varying concentrations of the pan-PAK inhibitor PF-3758309 followed by insulin treatment. B, Western blot analysis of HEK293 cells expressing V5 PREX2 with or without Gβγ. Cells were starved and treated with DMSO or varying concentrations of PF-3758309. C, Western blot analysis of starved or insulin-treated HEK293 cells expressing V5 PREX2 with or without MYC PAK1 WT or the kinase dead mutant K299R. D, PREX2 was purified from HEK293 cells co-expressing either MYC PAK1 WT or K299R. The ability of increasing doses of PIP3 to stimulate GEF activity toward GST Rac1 was assessed in an in vitro GEF assay. Data are means ± S.D. for two experiments with samples done in triplicate at each PIP3 concentration. Bar graph at right compares PREX2 purified from GDC0941-treated HEK293 cells to PREX2 from HEK293 cells co-expressing either MYC PAK1 WT or K299R. Data are means ± S.D. for one representative experiment with samples done in triplicate at each PIP3 concentration. For both panels, * represents p < 0.005 by t test. E, in vitro kinase assay with purified His PAK2 and V5 PREX2 or CRAF(306–648) isolated on V5-agarose beads. Incorporation of [γ-32P]ATP was analyzed. F, Western blot analysis of an in vitro kinase assay with purified His PAK2 and V5 PREX2 or CRAF(306–648) isolated on V5-agarose beads using antibodies to detect phosphorylation as indicated. G, in vitro kinase assay with purified His PAK2 and V5 PREX2 WT or S1107A isolated on V5-agarose beads. Incorporation of [γ-32P]ATP was analyzed.
FIGURE 8.
FIGURE 8.
Model for PAK-mediated regulation of PREX2 GEF activity and localization. Upon receptor stimulation, PIP3 and Gβγ recruit PREX2 to the cell membrane and activate PREX2 GEF activity, which promotes GTP loading on Rac1. Rac1-GTP then activates PAKs to propagate the Rac1 signal. PAKs also phosphorylate PREX2, reducing the ability of PREX2 to bind to PIP3, Gβγ, and the membrane, resulting in a decrease in PREX2 GEF activity toward Rac1. PREX2 can then be dephosphorylated by phosphatases such as PP1α and PP2A to complete the circuit and prime PREX2 for future activation by PIP3 or Gβγ. In this model, chronic stimulation of PIP3 or Gβγ could lead to ineffective signaling of PREX2 to Rac1.

References

    1. Donald S., Hill K., Lecureuil C., Barnouin R., Krugmann S., John Coadwell W., Andrews S. R., Walker S. A., Hawkins P. T., Stephens L. R., and Welch H. C. (2004) P-Rex2, a new guanine-nucleotide exchange factor for Rac. FEBS Lett. 572, 172–176 - PubMed
    1. Rosenfeldt H., Vázquez-Prado J., and Gutkind J. S. (2004) P-REX2, a novel PI-3-kinase sensitive Rac exchange factor. FEBS Lett. 572, 167–171 - PubMed
    1. Cherfils J., and Zeghouf M. (2013) Regulation of small GTPases by GEFs, GAPs, and GDIs. Physiol. Rev. 93, 269–309 - PubMed
    1. Abo A., Pick E., Hall A., Totty N., Teahan C. G., and Segal A. W. (1991) Activation of the NADPH oxidase involves the small GTP-binding protein p21rac1. Nature 353, 668–670 - PubMed
    1. Chen Z., Borek D., Padrick S. B., Gomez T. S., Metlagel Z., Ismail A. M., Umetani J., Billadeau D. D., Otwinowski Z., and Rosen M. K. (2010) Structure and control of the actin regulatory WAVE complex. Nature 468, 533–538 - PMC - PubMed

Publication types

MeSH terms

Associated data