

Current extinction rates of reptiles and amphibians
- PMID: 26438855
- PMCID: PMC4620882
- DOI: 10.1073/pnas.1508681112
Current extinction rates of reptiles and amphibians
Abstract
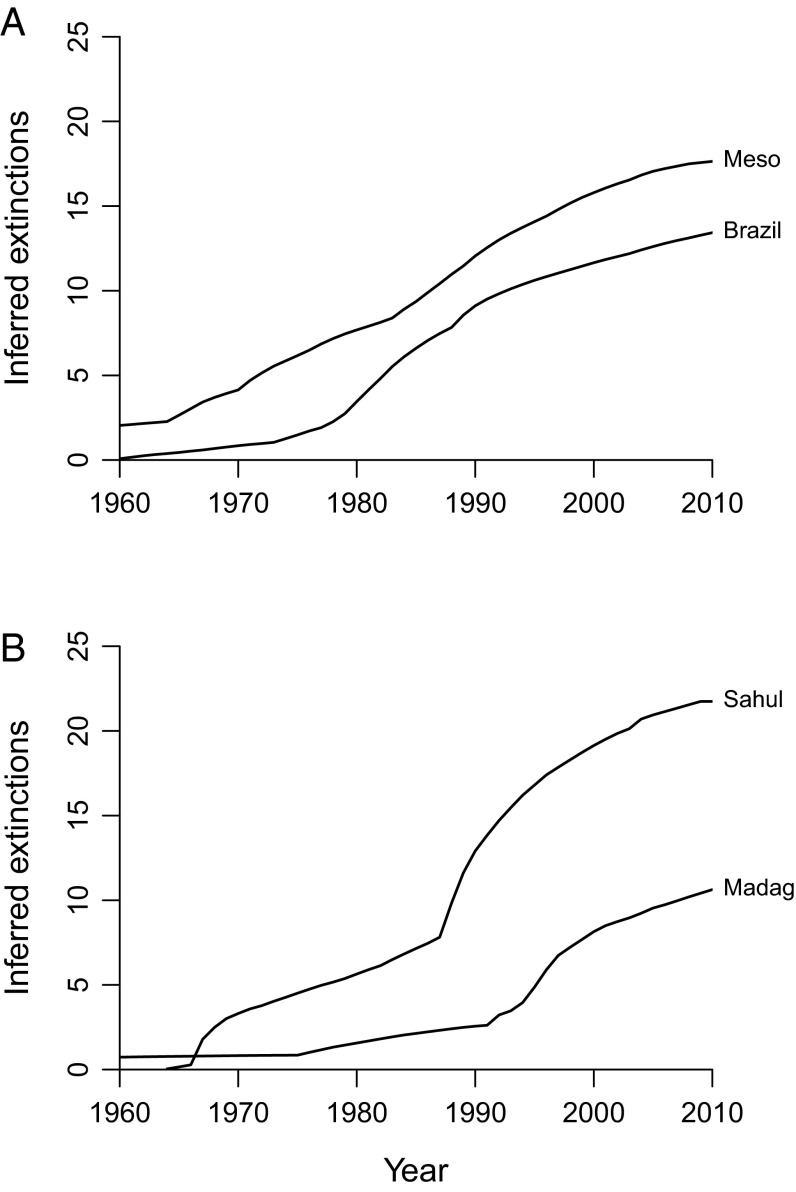
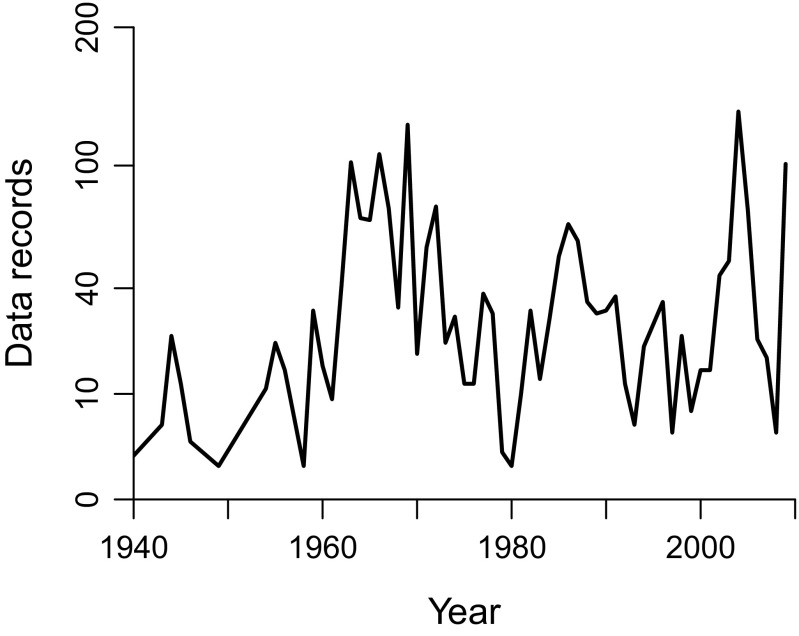
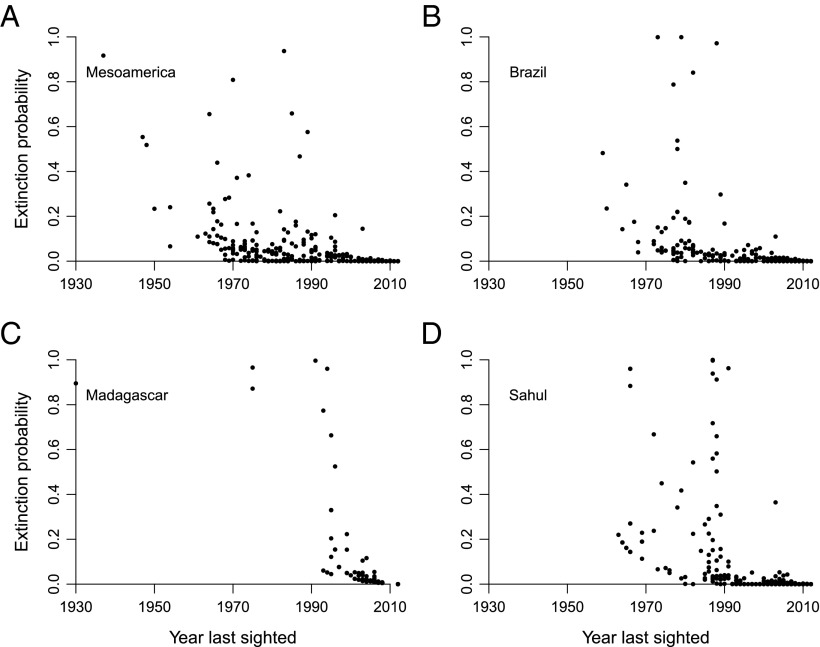
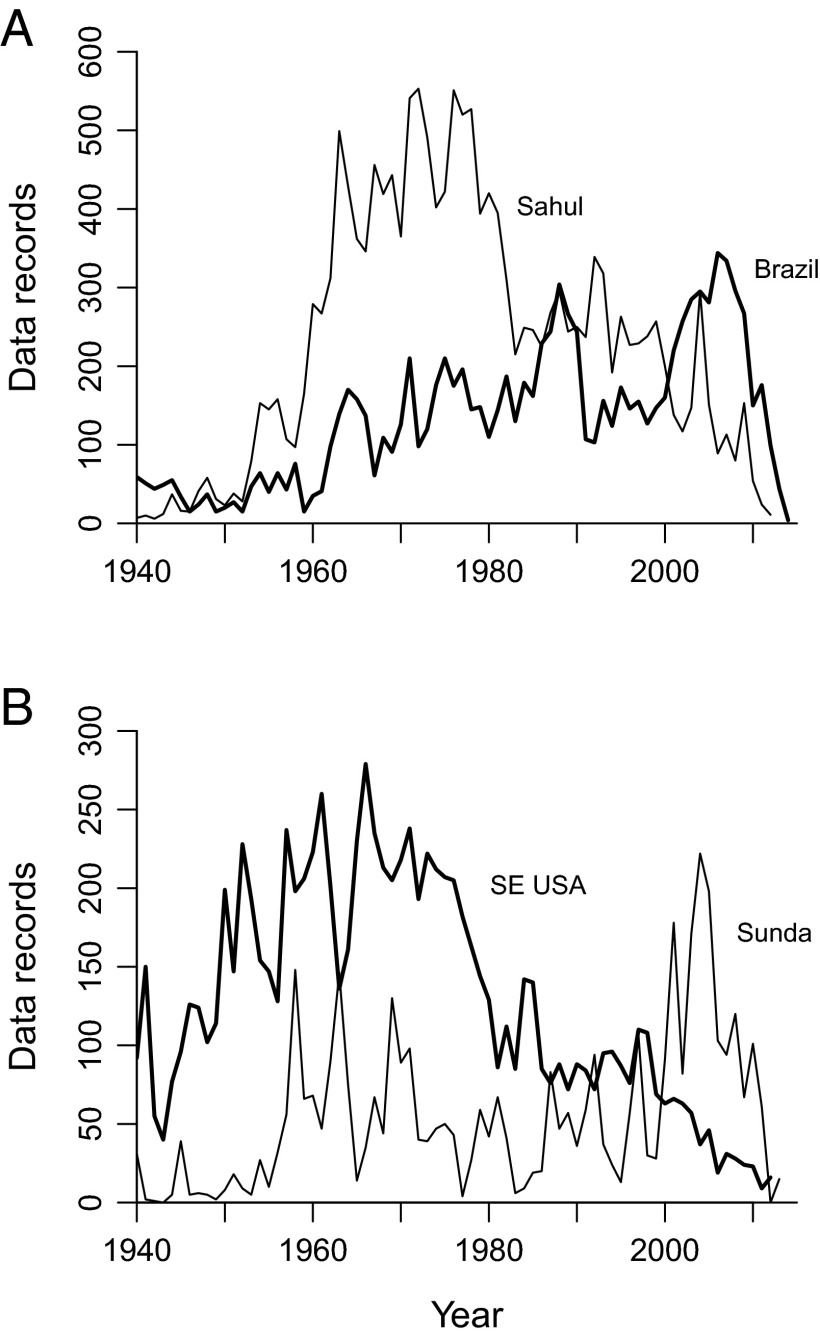
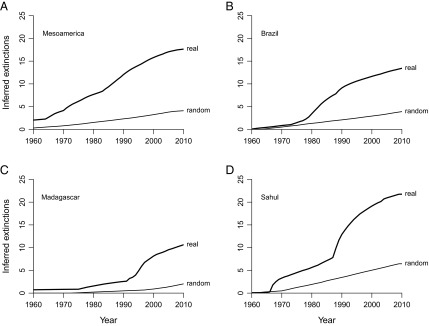
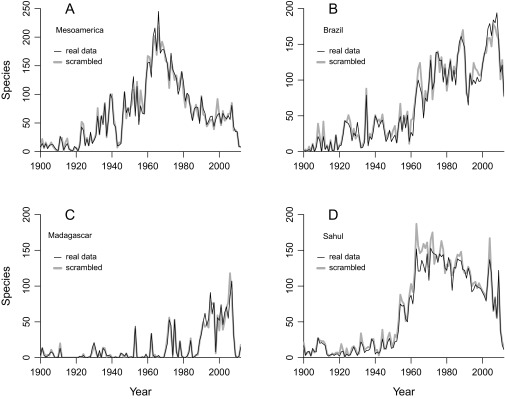
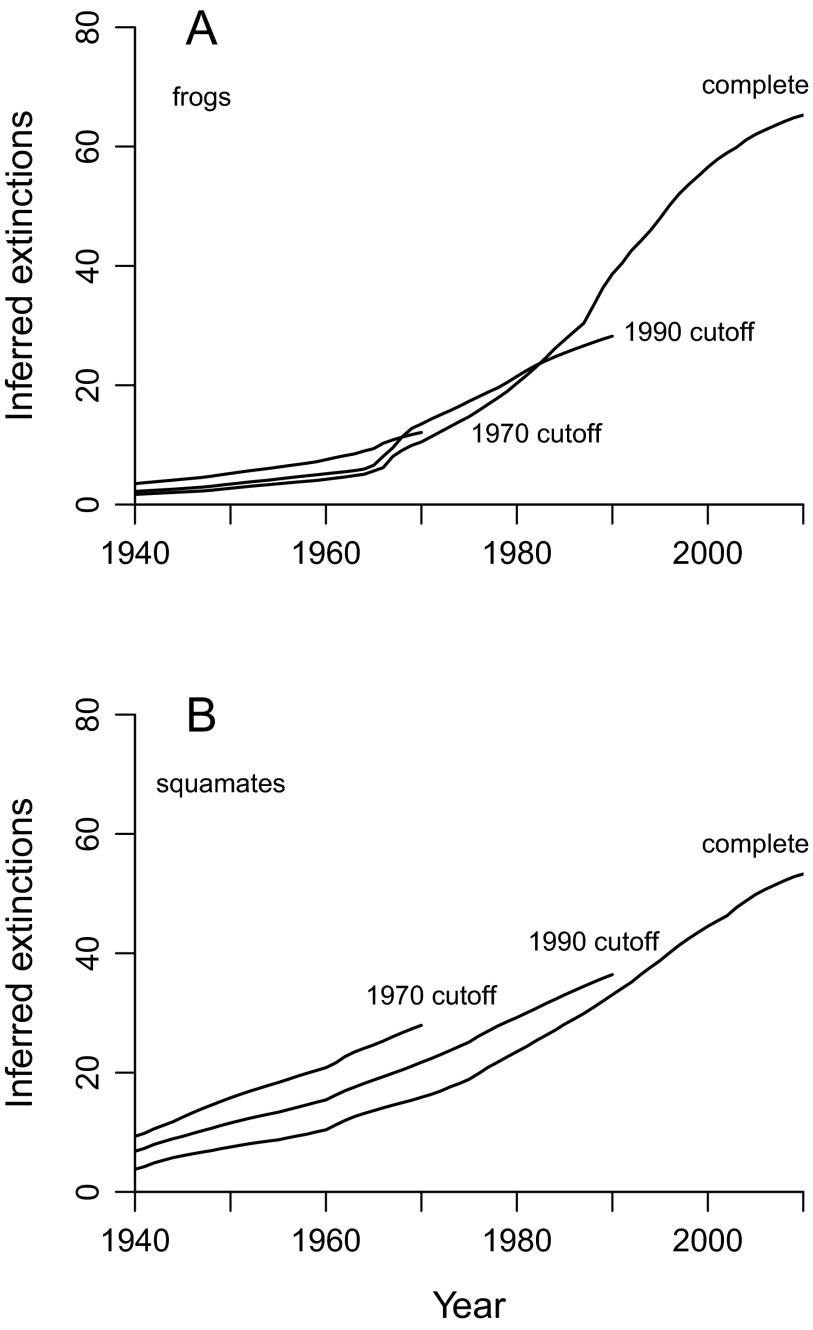
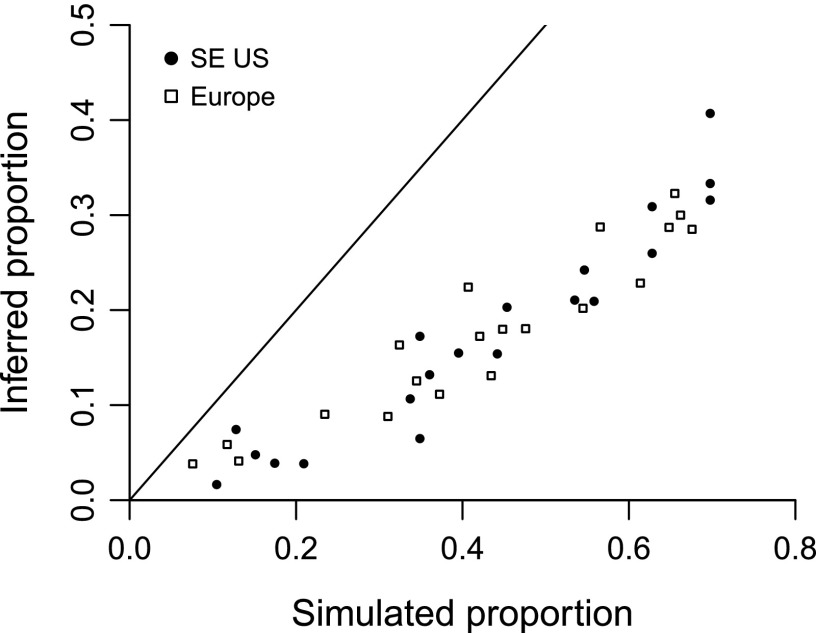
There is broad concern that a mass extinction of amphibians and reptiles is now underway. Here I apply an extremely conservative Bayesian method to estimate the number of recent amphibian and squamate extinctions in nine important tropical and subtropical regions. The data stem from a combination of museum collection databases and published site surveys. The method computes an extinction probability for each species by considering its sighting frequency and last sighting date. It infers hardly any extinction when collection dates are randomized and it provides underestimates when artificial extinction events are imposed. The method also appears to be insensitive to trends in sampling; therefore, the counts it provides are absolute minimums. Extinctions or severe population crashes have accumulated steadily since the 1970s and 1980s, and at least 3.1% of frog species have already disappeared. Based on these data and this conservative method, the best estimate of the global grand total is roughly 200 extinctions. Consistent with previous results, frog losses are heavy in Latin America, which has been greatly affected by the pathogenic chytrid fungus Batrachochytrium dendrobatidis. Extinction rates are now four orders-of-magnitude higher than background, and at least another 6.9% of all frog species may be lost within the next century, even if there is no acceleration in the growth of environmental threats.
Keywords: Bayesian methods; amphibians; extinction rates; reptiles.
Conflict of interest statement
The author declares no conflict of interest.
Figures
Comment in
-
Reply to Solow: Sense and nonsense in the choice of extinction priors.Proc Natl Acad Sci U S A. 2016 Mar 1;113(9):E1133. doi: 10.1073/pnas.1600387113. Epub 2016 Feb 16. Proc Natl Acad Sci U S A. 2016. PMID: 26884202 Free PMC article. No abstract available.
-
On Bayesian inference about extinction.Proc Natl Acad Sci U S A. 2016 Mar 1;113(9):E1132. doi: 10.1073/pnas.1525317113. Epub 2016 Feb 16. Proc Natl Acad Sci U S A. 2016. PMID: 26884203 Free PMC article. No abstract available.
References
-
- Stuart SN, et al. Status and trends of amphibian declines and extinctions worldwide. Science. 2004;306(5702):1783–1786. - PubMed
-
- McCallum ML. Amphibian decline or extinction? Current declines dwarf background extinction rate. J Herptol. 2007;41(3):483–491.
-
- Hoffmann M, et al. The impact of conservation on the status of the world’s vertebrates. Science. 2010;330(6010):1503–1509. - PubMed
-
- Böhm M, et al. The conservation status of the world’s reptiles. Biol Conserv. 2013;157:372–385.
Publication types
MeSH terms
LinkOut - more resources
Full Text Sources
Other Literature Sources
